CNN Fear & Greed Analysis 2026-07-26
CNN Fear & Greed Composite at 39.43 (Fear). Of 7 sub-indicators: 4 Fear, 2 Neutral, 1 Greed. Market breadth hits Extreme Fear at 14. VIX at 18.58 remains neutral. Crisis precursor dashboard: 2 green, 2 red. Credit spreads normal, but margin debt and ETF inflows at all-time highs.
📊 Composite Index Trend
| Metric | Value |
|---|---|
| Latest Score | 39.43 |
| Sentiment Rating | 🟡 Fear |
| Previous Close | 39.60 |
| 1 Week Ago | 37.23 |
| 1 Month Ago | 26.46 |
| 1 Year Ago | 75.25 |
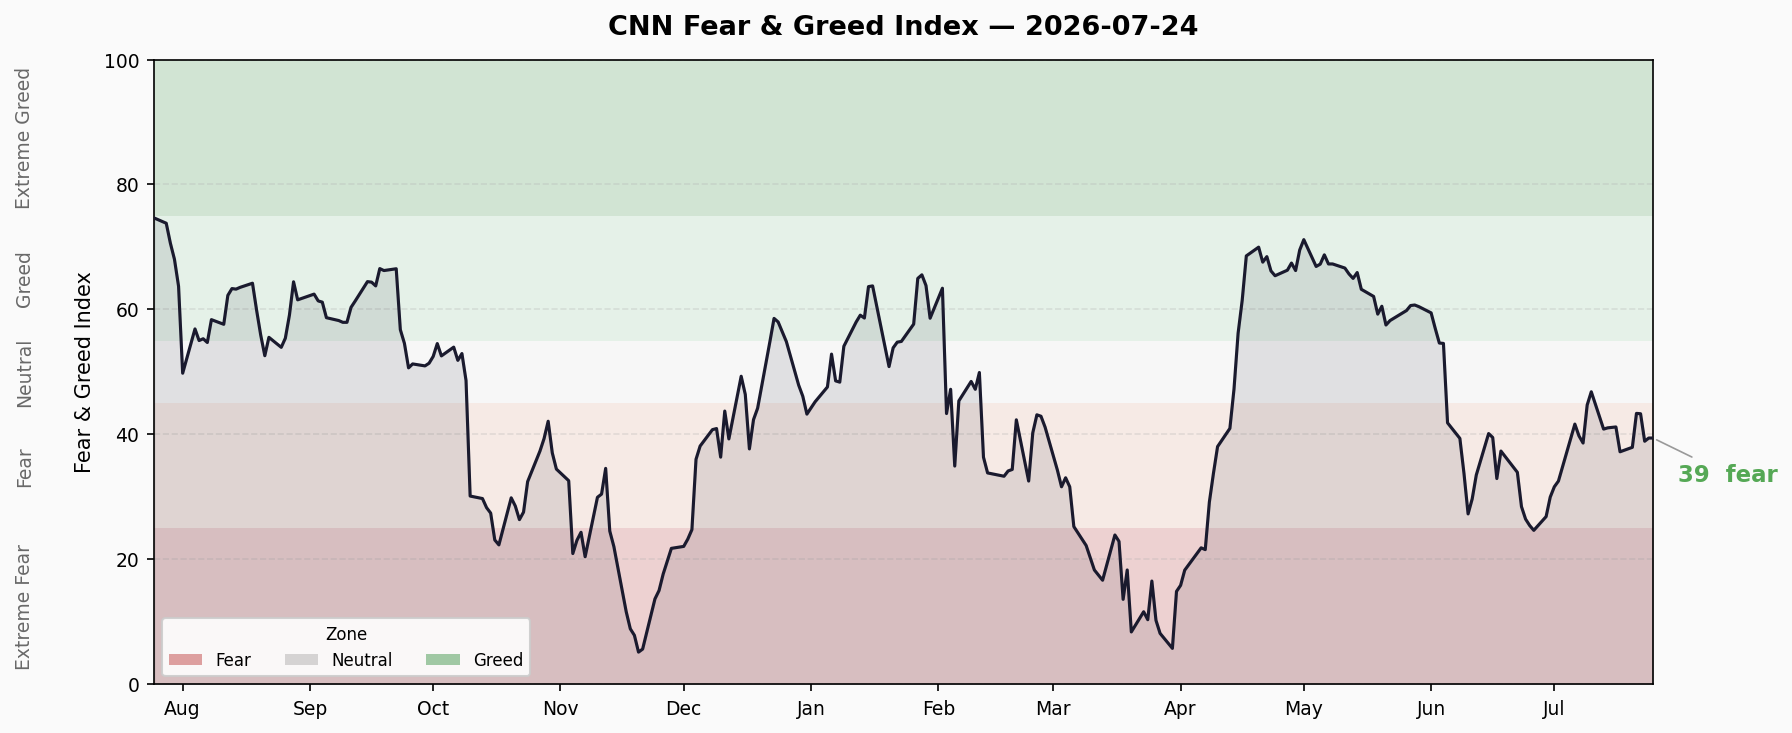
The composite index sits at 39.43, down 0.17 from the prior session, marking the 12th consecutive trading day in Fear territory. This is a notable recovery from 26.46 a month ago but remains far below the 75.25 (Greed) level of one year ago.
10-day trend: 37.23 → 43.37 → 43.31 → 38.91 → 39.43, oscillating within a 37-43 range without a decisive breakout.
🔬 Sub-Indicator Breakdown
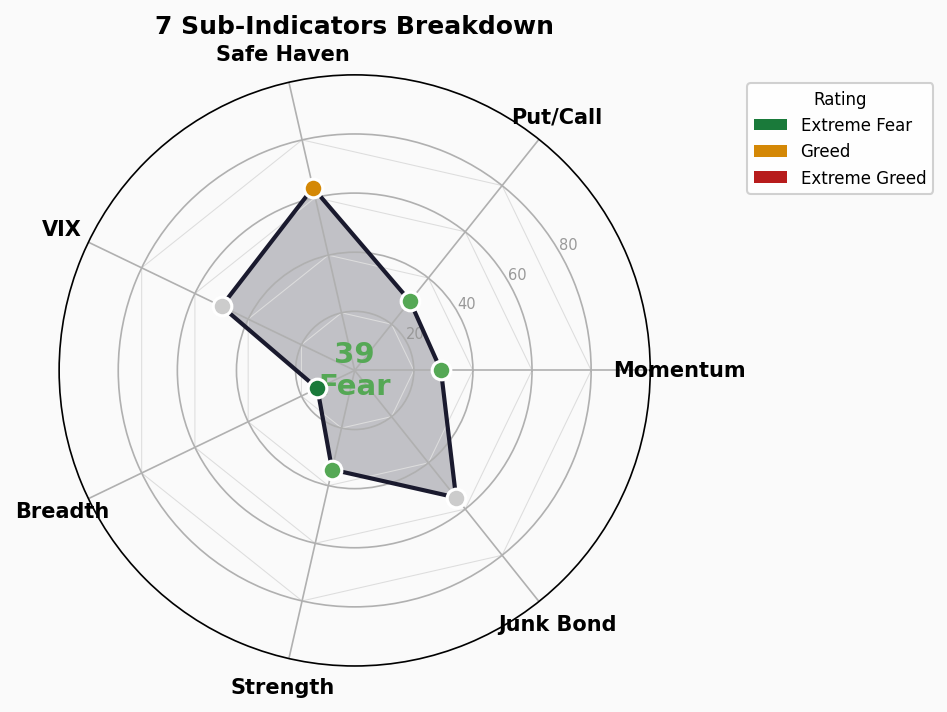
1. Market Momentum — 29.2 | 🔴 Fear
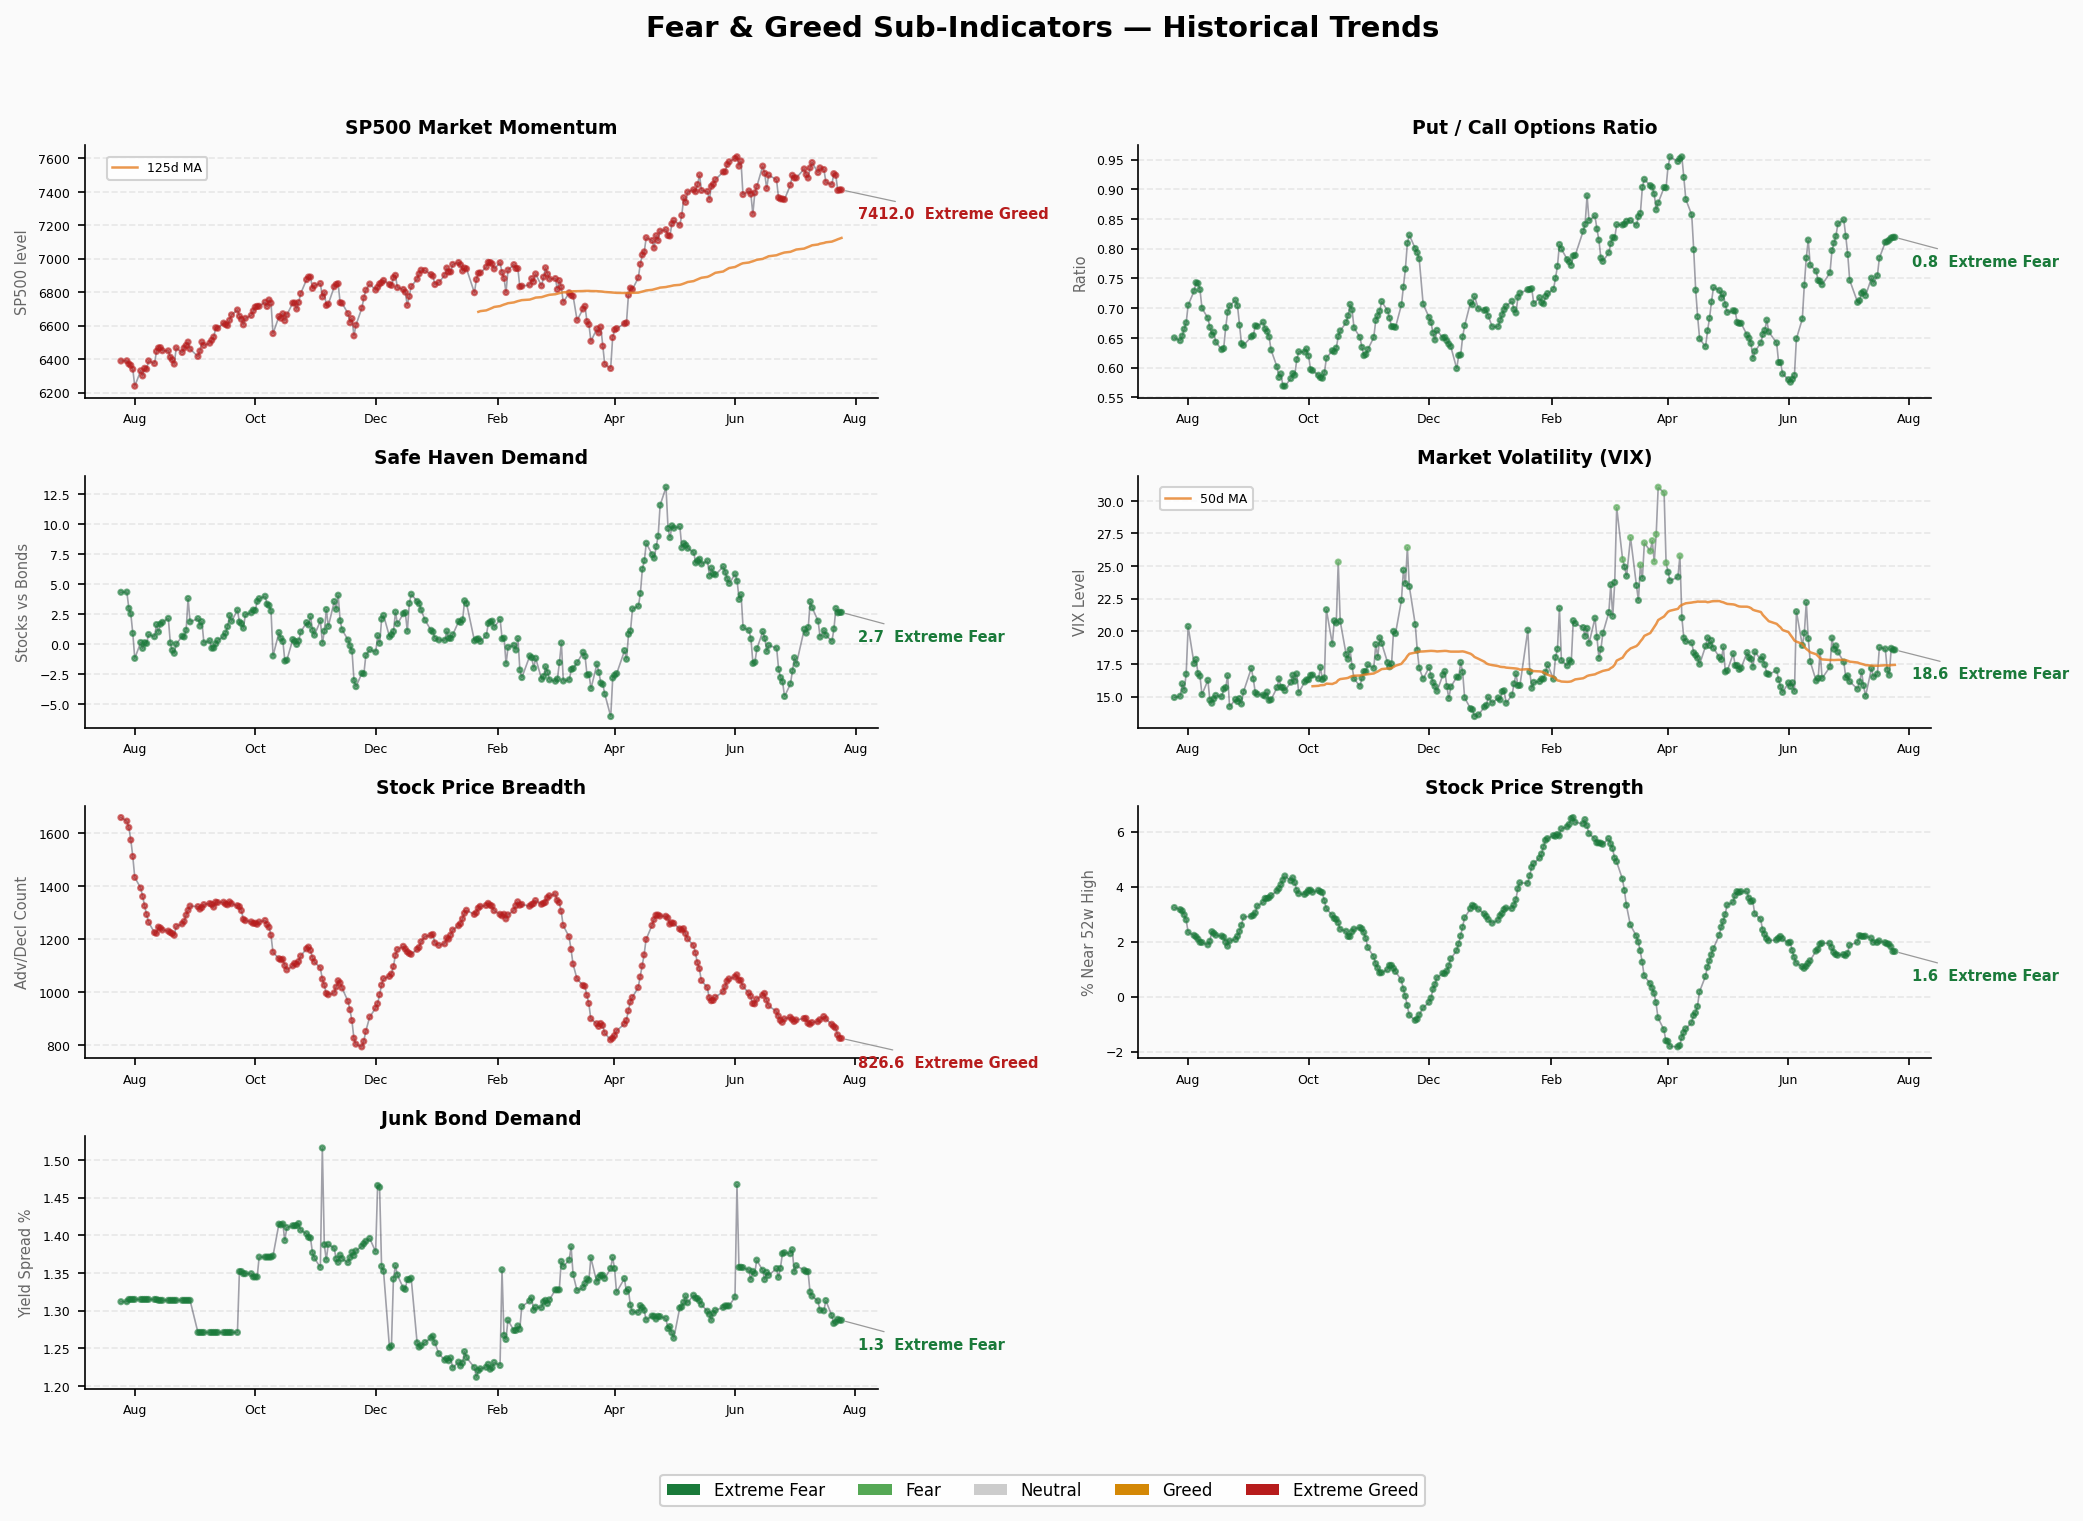
- S&P 500: 7,411.98 | +3.68 from prior (+0.05%)
- S&P 500 edged up Friday but remains ~2.6% below the July high of 7,610
2. Stock Price Strength — 34.4 | 🔴 Fear
- 52-Week High/Low Ratio: 1.646 | -0.171 from prior ↓
- Percentage of stocks at 52-week highs continues to shrink, breadth deteriorating
3. Stock Price Breadth — 14 | 🔴🔴 Extreme Fear
- McClellan Volume Summation Index: 826.59 | -13.29 from prior ↓
- ⚠️ Most extreme signal! Breadth plunging into Extreme Fear indicates gains concentrated in a handful of mega-caps
4. Put/Call Ratio — 30 | 🔴 Fear
- Put/Call Ratio: 0.819 | +0.001 from prior →
- Options market leans bearish but not panicked
5. Market Volatility (VIX) — 50 | 🟡 Neutral
- VIX: 18.58 | -0.12 from prior ↓
- VIX easing to ~18, mid-range for the year — market not pricing extreme risk
6. Junk Bond Demand — 55 | 🟡 Neutral
- Junk-Treasury Spread: 1.287% | -0.001 from prior →
- Credit markets stable, demand for high-yield bonds normal
7. Safe Haven Demand — 63.4 | 🟢 Greed
- Stock vs Bond Relative Strength: 2.669 | +0.040 from prior ↑
- Capital continues favoring equities over Treasuries — the only Greed-zone indicator
⚡ Structural Divergence Analysis
Extreme Value Alert
- Stock Price Breadth at 14 (Extreme Fear): The most concerning signal. When upward momentum concentrates in a tiny number of mega-caps while the broader market loses steam, the internal structure is fragile.
Divergence Signals
- Safe Haven Greed vs Market Breadth Extreme Fear: Capital broadly favors stocks (haven demand in Greed) yet internal breadth is extremely poor. Classic “index holds, stocks bleed” — institutional money crowding into mega-caps, small/mid-caps hemorrhaging.
Overall Assessment
- FNG has held in Fear territory for ~2 weeks, with support forming near 37
- Extreme breadth fear is the primary concern; if mega-caps eventually crack, a deeper correction could follow
- VIX neutral and credit spreads normal suggest systemic risk remains contained for now
🚨 Crisis Precursor Dashboard
1. Credit Spreads
- HY OAS: 2.77% (2026-07-23) | 🟢 Normal
- IG OAS: 0.79% (2026-07-23) | 🟢 Normal
- Trend: Stable. HY OAS <3%, IG OAS <1% — credit markets healthy, no systemic stress
2. Yield Curve
- 10Y-2Y Spread: +36bp | 🟢 Normal / Slightly Flat
- 10Y: 4.71% | 2Y: 4.37% | 30Y: 5.17%
- Curve remains positively sloped, no inversion risk. 10Y-30Y at -46bp suggests limited long-end premium
3. Margin Debt
- FINRA Margin Debt: $1.304T (Apr 2026, latest available) | 🔴 All-Time High Zone
- ⚠️ Margin debt at historical peak. Elevated leverage means any significant drawdown risks a deleveraging spiral
4. IPO Market
- 2026 YTD IPOs: ~73 (Renaissance Capital) | 🟡 Moderately Active
- IPO pace not frenzied but has picked up from 2025 levels
5. Fund Flows
- 2026 YTD ETF Net Inflows: ~$856B (record) | 🔴 Record Inflows
- ⚠️ ETF money pouring in at an unprecedented rate — may reflect FOMO sentiment and represents potential liquidity risk
Summary
| Level | Count | Indicators |
|---|---|---|
| 🟢 Normal | 2 | Credit spreads (HY+IG), Yield curve |
| 🟡 Caution | 0 | — |
| 🔴 Alert | 2 | Margin debt, ETF inflows |
Overall Assessment: 2 green, 2 red — structurally divided. Credit markets and yield curve signal health, suggesting low systemic risk. But margin debt and ETF inflows both at record highs indicate extreme positioning. This isn’t an “imminent crash” signal, but any correction that does materialize could be amplified by leverage.