CNN Fear & Greed Analysis 2026-07-25
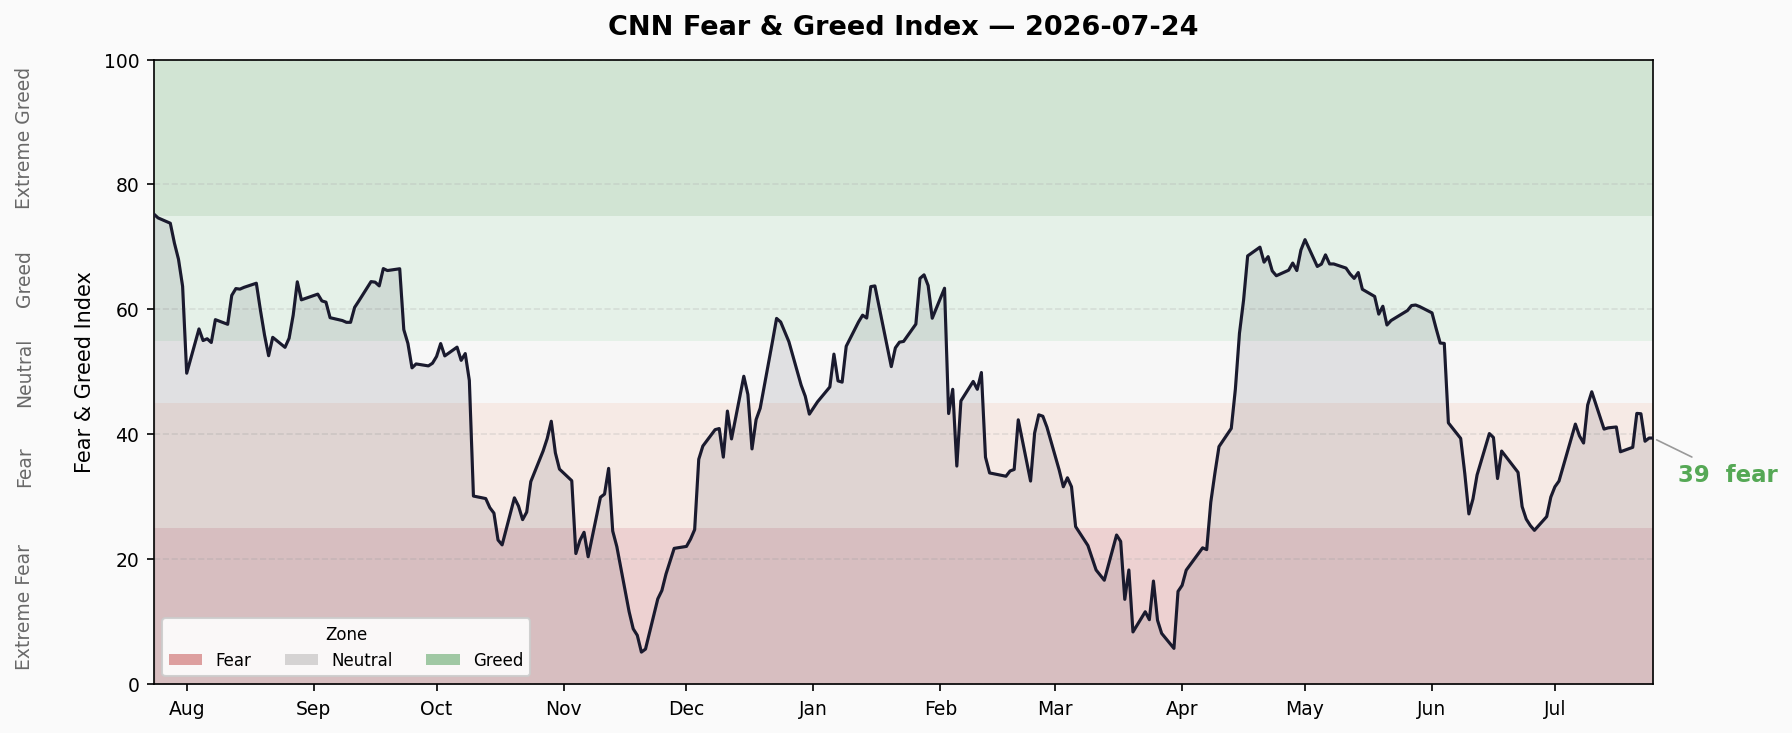
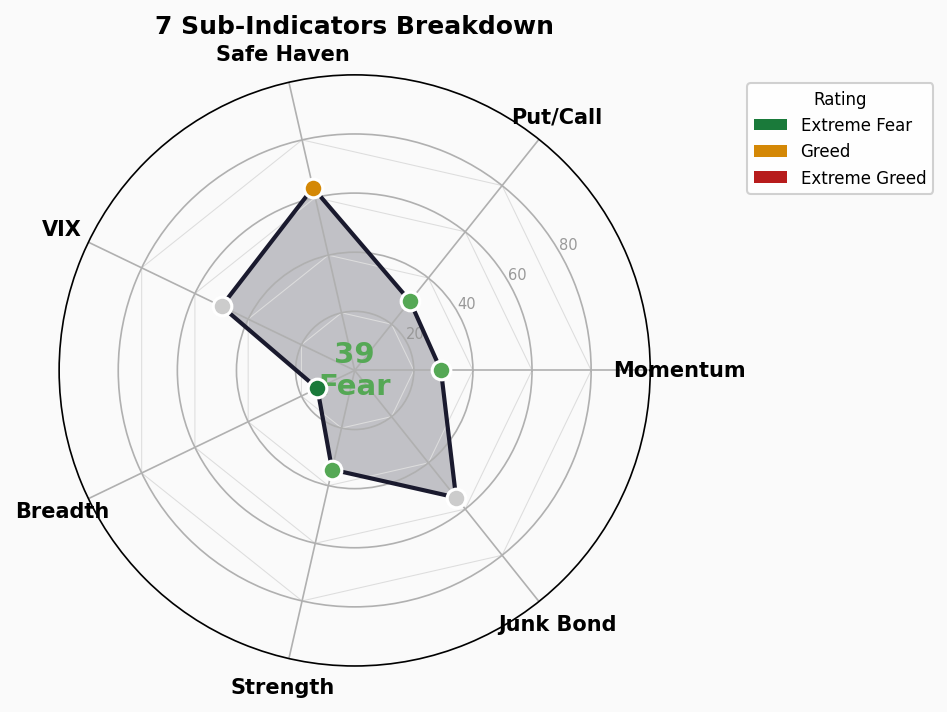
CNN Fear & Greed Index composite at 39.4 (Fear), down 0.2 from prior close of 39.6. Among 7 sub-indicators: 4 Fear, 2 Neutral, 1 Greed. Stock Price Breadth at 14.0 (Extreme Fear) is the biggest drag. VIX at 18.58 (Neutral). Safe Haven Demand at 63.4 is the sole Greed signal. Crisis precursor dashboard: 2 Green / 0 Yellow / 2 Red — credit spreads normal, but record margin debt and ETF inflows warrant caution.
Composite Index Trend
| Metric | Value |
|---|---|
| Latest | 39.4 |
| Rating | 🟠 Fear |
| Prior Close | 39.6 (↓ 0.2) |
| 1 Week Ago | 37.2 (↑ 2.2) |
| 1 Month Ago | 26.5 (↑ 12.9) |
| 1 Year Ago | 75.3 (↓ 35.9) |
10-Day Trend:
| Date | Score | Rating |
|---|---|---|
| Jul 10 | 46.8 | Neutral |
| Jul 13 | 40.9 | Fear |
| Jul 14 | 41.1 | Fear |
| Jul 16 | 41.2 | Fear |
| Jul 17 | 37.2 | Fear |
| Jul 20 | 37.9 | Fear |
| Jul 21 | 43.4 | Fear |
| Jul 22 | 43.3 | Fear |
| Jul 23 | 38.9 | Fear |
| Jul 24 | 39.4 | Fear |
Trend Assessment: 10 consecutive sessions in Fear territory (37–43 range), oscillating within a narrow band. The recovery from early June’s Extreme Fear low (5.2) reached 43+ in mid-July but failed to break into Neutral territory before pulling back. Currently consolidating in a 37–43 box; direction unclear.
Seven Sub-Indicator Scan
1. Market Momentum — 29.2 🟠 Fear
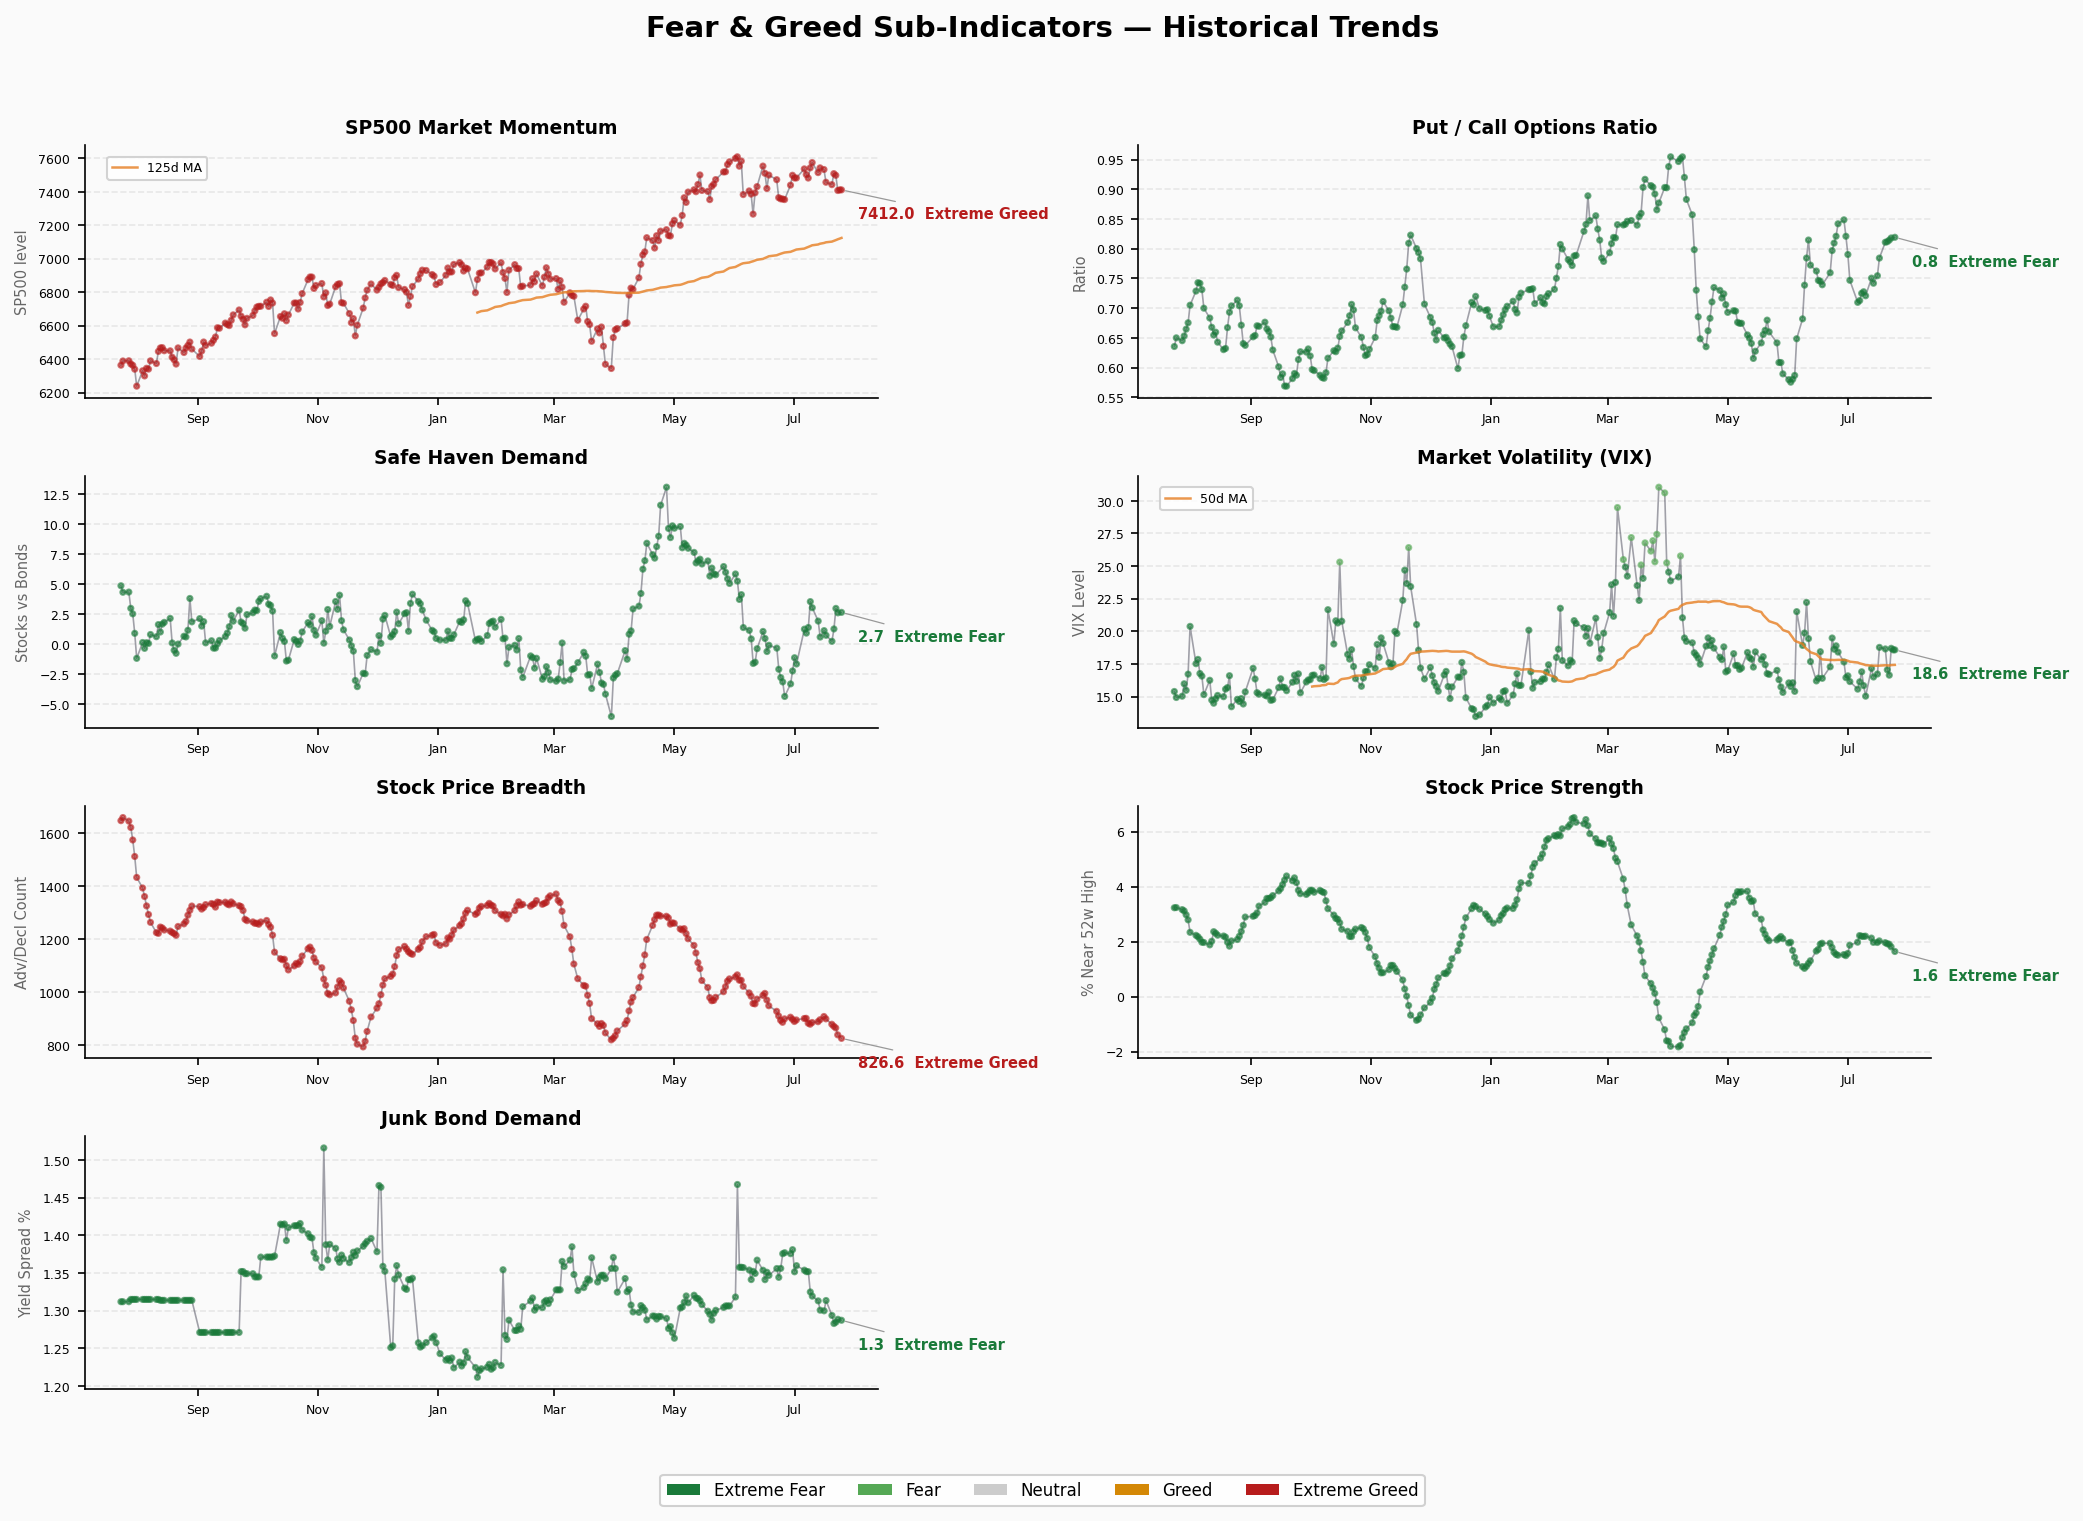
S&P 500 at 7,411.98; deviation from 125-day moving average has narrowed significantly. SPX retreated from 7,500+ highs earlier in the year while the 125-day MA kept climbing, compressing the momentum spread from Extreme Greed to Fear. SPX itself remains near all-time highs, but momentum “acceleration” has vanished.
2. Stock Price Strength — 34.4 🟠 Fear
NYSE 52-week high/low ratio continues to deteriorate. Many individual stocks are failing to make new highs alongside the index — severe internal divergence. Current ratio at 1.65 (highs/lows), deep in Extreme Fear territory.
3. Stock Price Breadth — 14.0 🔴 Extreme Fear
Lowest of all 7 indicators — the most alarming signal. McClellan Volume Summation Index at 826.6, down from 839.9 prior. Declining volume on advancing issues, capital concentrated in a handful of mega-caps. Retail and small/mid-cap participation is minimal. Classic “hollow rally” signature.
4. Put/Call Options — 30.0 🟠 Fear
Put/Call ratio at 0.819, in the low Fear range. Options market participants continue buying protective puts; hedging sentiment persists. At 0.82, however, this is not panic-level — more like sustained caution.
5. Market Volatility (VIX) — 50.0 🟡 Neutral
VIX at 18.58, squarely in Neutral territory. Volatility has eased from 20+ earlier this year; 18.58 is near the lower end of the 2026 range. 50-day VIX MA at 17.42. The volatility market is signaling “calm waters” — a notable contrast with the Fear readings elsewhere.
6. Junk Bond Demand — 55.0 🟡 Neutral
High-yield to investment-grade spread at 1.29%, in the Neutral-to-Greed range. Credit markets show no stress, consistent with the HY OAS at 2.77% absolute level. Bond market participants have limited concern about the economic outlook.
7. Safe Haven Demand — 63.4 🟢 Greed
The sole Greed signal among all 7 indicators. Stocks continue outperforming Treasuries, with a spread of 2.67. Capital is still flowing from bonds to equities — or at least not rotating defensively. This stands in stark contrast with Breadth’s Extreme Fear: money is coming in, but into an increasingly narrow set of names.
Structural Contradictions
⚠️ Core Contradiction #1: Index Near ATH vs. Breadth at Extreme Fear
SPX at 7,400+ near all-time highs, but Breadth at 14.0 (Extreme Fear). The classic “hollow market” signal — the index is propped up by a handful of mega-cap tech names (Mag 7) while the vast majority of stocks are declining or flat. This divergence has appeared at multiple historical market tops.
⚠️ Core Contradiction #2: Low VIX vs. High Fear
VIX at 18.58 signals neutral/low volatility, but the composite and most sub-indicators are in Fear. Either the market is experiencing a “slow bleed” (low vol, directionally down), or VIX is suppressed and tail risk is being underpriced.
⚠️ Core Contradiction #3: Safe Haven Greed vs. Options Fear
Safe Haven Demand at 63.4 (Greed) vs. Put/Call at 30.0 (Fear) form a contradiction. Stocks are still outperforming bonds, but options traders are aggressively buying protection. Institutions may be hedging tail risk via options while maintaining equity long exposure.
⚠️ Extreme Value Alert
- Stock Price Breadth at 14.0: Below the 20 Extreme Fear threshold, with consecutive daily declines. During the Nov 2025 panic, this indicator bottomed at 5–8. Current 14 is not extreme by that measure, but the trajectory is concerning.
Composite Assessment
- Short-term (1–2 weeks): Range-bound in Fear territory, 37–43 consolidation box. A break above 44 would signal Neutral/bullish; a drop below 35 accelerates downside.
- Medium-term (1–3 months): The recovery from 5.2 Extreme Fear lows has been substantial, but failure to hold Neutral territory is telling. Deteriorating breadth is the biggest risk — if breadth doesn’t improve, this rally may prove to be a bear market bounce.
- Key watchpoints: Whether Stock Price Breadth stabilizes and turns up; whether VIX breaks above 20; whether credit spreads widen.
🚨 Crisis Precursor Dashboard
1. Credit Spreads
- HY OAS: 2.77% (2026-07-23) | 🟢 Normal/Greed
- IG OAS: 0.79% (2026-07-23) | 🟢 Normal
- Trend: Credit spreads remain at historically low levels. HY OAS < 3% is in the greed zone. Bond markets are pricing minimal default risk — zero stress signals.
2. Yield Curve
- 10Y–2Y Spread: +36bp | 🟢 Normal (slightly flat)
- 10Y: 4.71% | 2Y: 4.37% | 30Y: 5.17%
- Trend: Curve has recovered from inversion, but 36bp is still relatively flat. The 10Y–30Y spread at -46bp shows slight long-end inversion, suggesting weak long-term growth expectations.
3. Margin Debt (FINRA)
- Latest Known: $1.304T (Apr 2026) | 🔴 All-Time High Range
- Trend: Margin debt at record levels. Not a problem in a bull market, but deleveraging amplifies any selloff. May–Jul data pending (FINRA monthly release).
4. IPO Activity & Fund Flows
- IPOs: ~73 YTD 2026 (Renaissance Capital) | 🟡 Neutral
- ETF Net Inflows: $856B YTD 2026 (record) | 🔴 Record Inflows
- Trend: ETF money pouring in at unprecedented pace; retail sentiment remains hot. Historically, record ETF inflows tend to appear late-cycle and serve as a contrarian overheating signal.
5. Composite Judgment
| Indicator | Status |
|---|---|
| Credit Spreads (HY OAS) | 🟢 Normal |
| Credit Spreads (IG OAS) | 🟢 Normal |
| Yield Curve (10Y–2Y) | 🟢 Normal (flat) |
| Margin Debt | 🔴 All-Time High |
| Fund Flows (ETF) | 🔴 Record |
Composite: 2 🟢 / 0 🟡 / 2 🔴
Interpretation: Credit markets — the most sensitive early-warning indicator — are completely normal, and the yield curve has exited inversion danger. However, both funding-side indicators — margin debt and ETF inflows — are at historical extremes, reflecting heavy speculative appetite. Current state resembles “alarm raised but no fire yet” — credit spreads are the last line of defense. If HY OAS breaks above 3.5–4%, heightened vigilance is warranted.