CNN Fear & Greed Analysis 2026-07-24
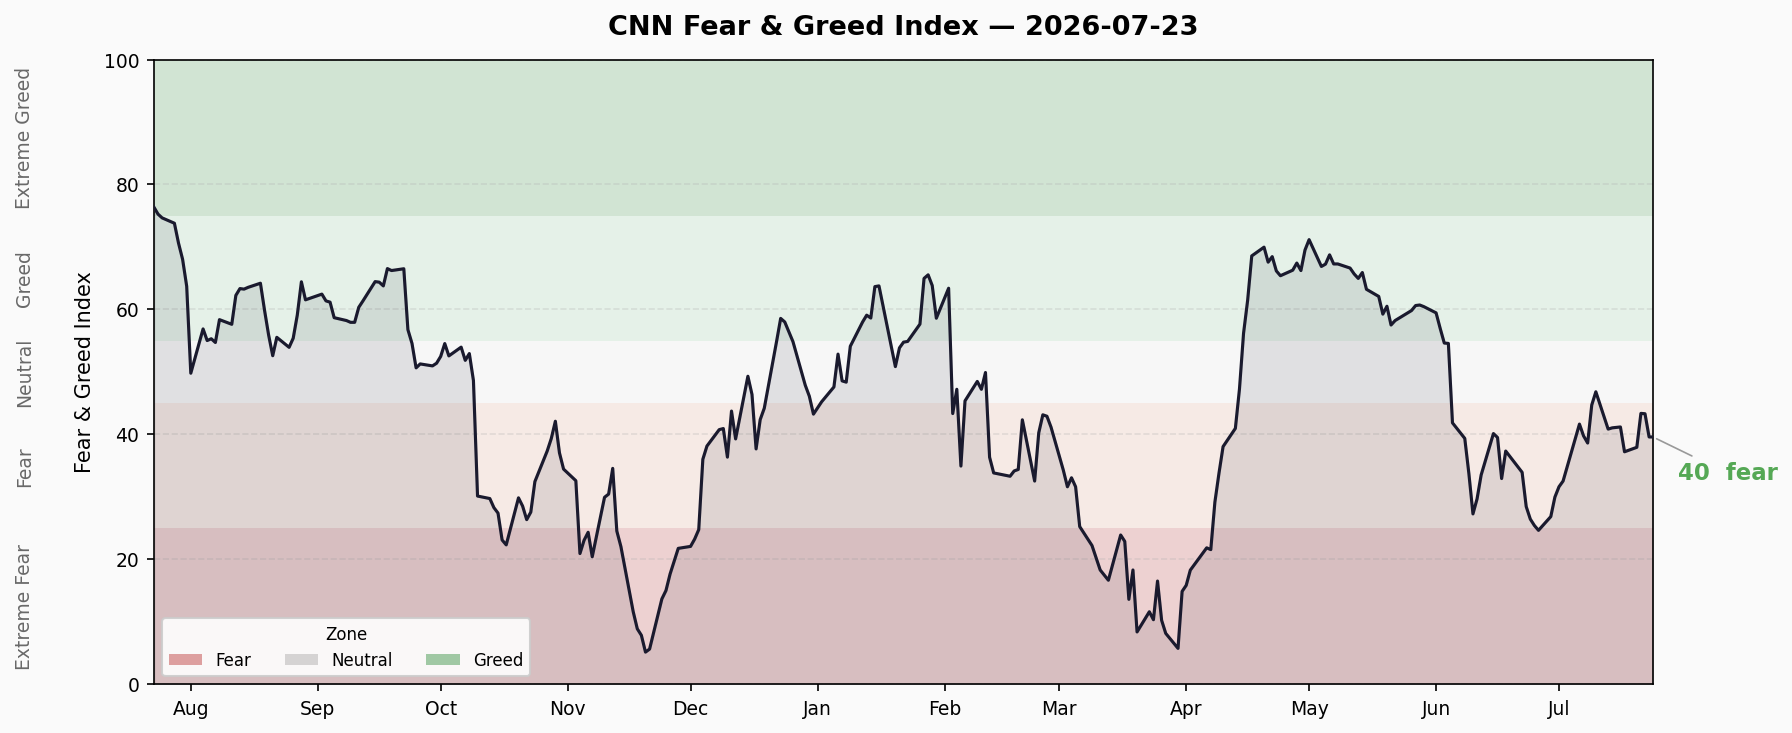
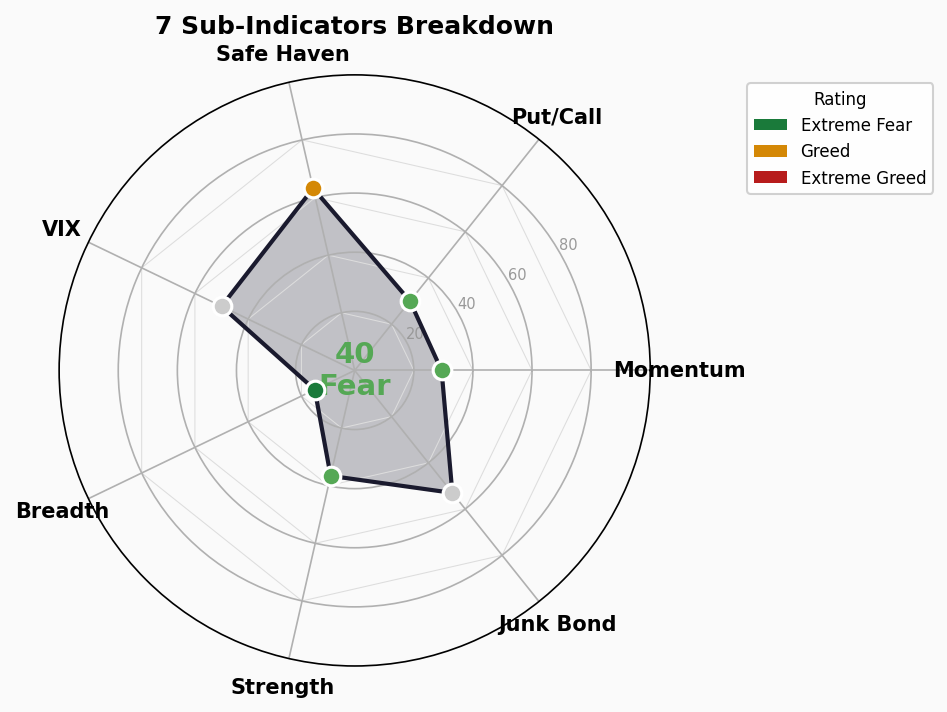
Fear & Greed composite 39.6 (Fear), down 3.37 from prior close of 42.97. Among 7 sub-indicators: 3 Fear, 1 Extreme Fear, 2 Neutral, 1 Greed. VIX jumped from 16.64 to 18.70. Crisis signals dashboard: 2 Green / 0 Yellow / 2 Red — margin debt and fund flows at historical extremes.
📊 Composite Index Trend
| Metric | Value |
|---|---|
| Current Composite | 39.6 — Fear |
| Previous Close | 42.97 (Fear) |
| Daily Change | -3.37 (-7.8%) |
| 1 Week Ago | 41.2 (Fear) |
| 1 Month Ago | 28.46 (Extreme Fear) |
| 1 Year Ago | 76.37 (Extreme Greed) |
Trend Assessment: The composite has been sliding from the Neutral zone (46-49) since mid-July. 7 of the last 10 trading days registered Fear. After touching a low of 37.23 on 7/15 and briefly bouncing to 43.4, the index fell back below 40 on 7/23. At 39.6, it sits at the lower end of the Fear range, just 14.6 points from Extreme Fear (25). Short-term direction: bearish.
🔬 Sub-Indicator Scan
| # | Indicator | Score | Rating | Raw Value | Direction |
|---|---|---|---|---|---|
| 1 | Market Momentum (SPX vs 125-day MA) | 29.4 | 😨 Fear | SPX 7408.3 | ↓ Flat |
| 2 | Stock Price Strength (52W High/Low) | 36.6 | 😨 Fear | 1.82:1 | ↓ More lows |
| 3 | Stock Price Breadth (McClellan Volume) | 15.0 | 😱 Extreme Fear | 839.9 | ↓ Down from 872 |
| 4 | Put/Call Ratio | 30.0 | 😨 Fear | 0.818 | ↑ Puts rising |
| 5 | Market Volatility (VIX) | 50.0 | 😐 Neutral | 18.70 | ↑ Jump from 16.64 |
| 6 | Safe Haven Demand (Stock/Bond spread) | 63.2 | 😊 Greed | +2.63% | ↓ Narrowing |
| 7 | Junk Bond Demand (HY Spread) | 53.0 | 😐 Neutral | 1.29% | → Stable |
Indicator Details
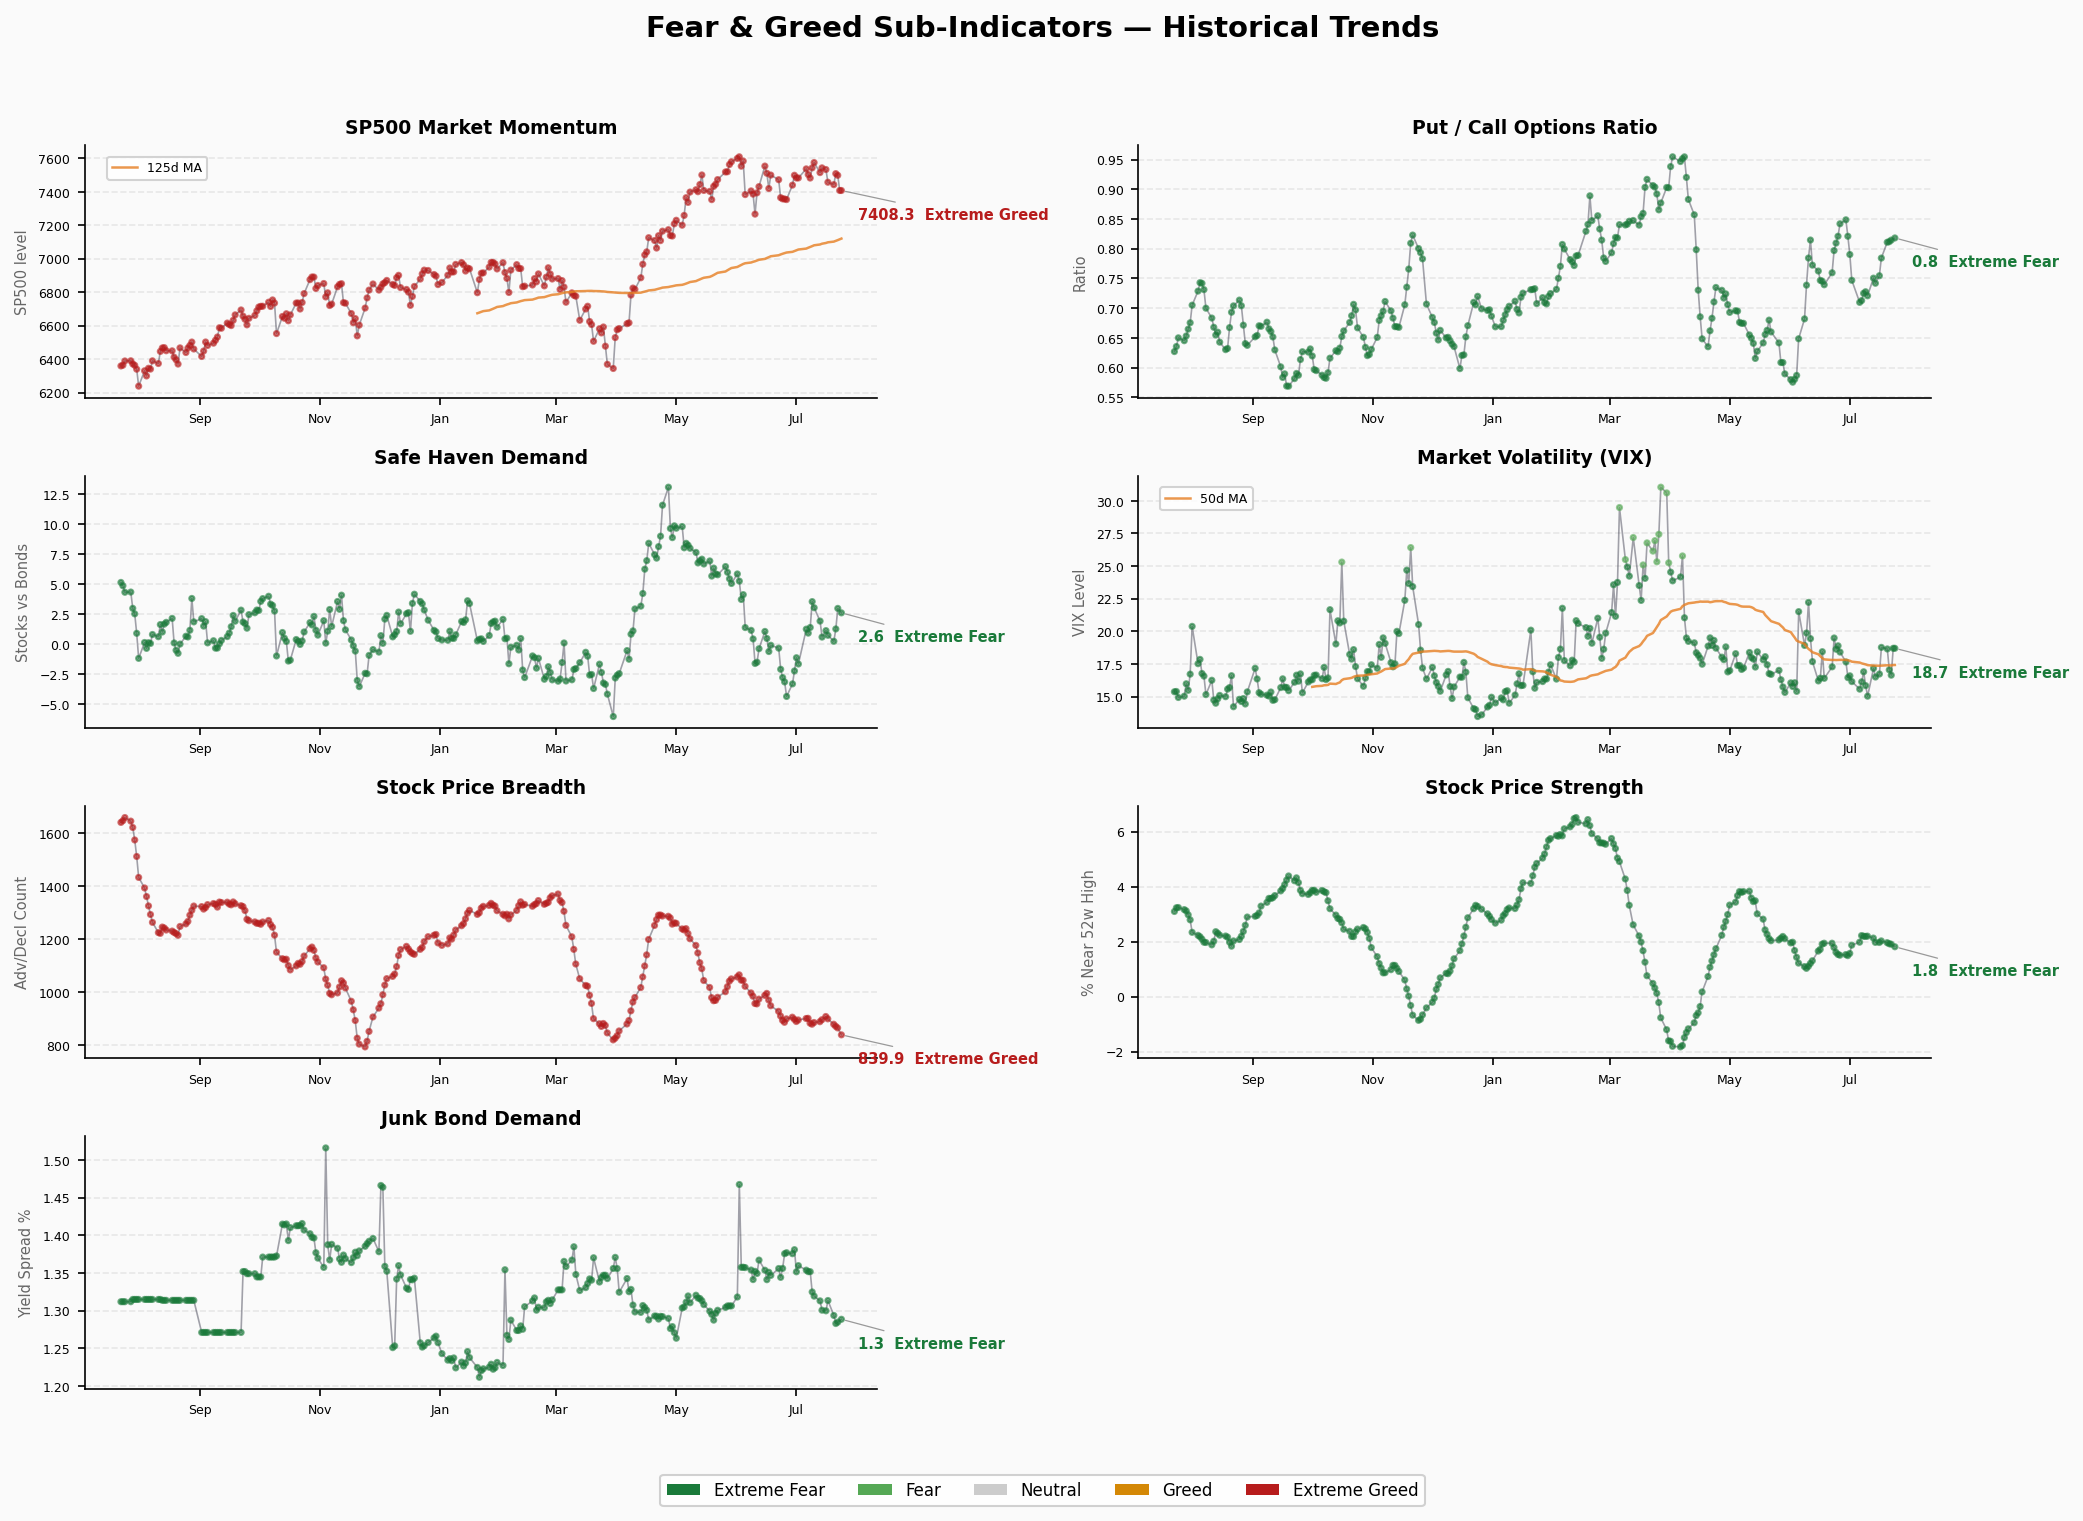
1. Market Momentum — 29.4 (Fear) SPX at 7408.3, flat from prior session. The index remains above its 125-day moving average (otherwise the score would be lower), but the margin is shrinking. Momentum continues to decay — a classic late-cycle pattern of elevated index levels with exhausted momentum.
2. Stock Price Strength — 36.6 (Fear) NYSE 52-week high/low ratio dropped to 1.82:1, declining for multiple sessions. More stocks are hitting new lows, indicating deteriorating market breadth. Even as SPX stays elevated, an increasing number of individual names are weakening.
3. Stock Price Breadth — 15.0 (Extreme Fear) ⚠️ McClellan Volume Summation Index fell from 872 last week to 839.9, declining for four consecutive sessions. Volume breadth is the most extreme of all seven sub-indicators, suggesting capital is retreating from the broad market and concentrating in a handful of mega-caps.
4. Put/Call Ratio — 30.0 (Fear) Put/call ratio rose to 0.818, indicating increased put option activity. While not yet at panic levels (>1.0), the rising trend suggests growing hedging demand among professional traders.
5. Market Volatility (VIX) — 50.0 (Neutral) VIX jumped from 16.64 (7/22) to 18.70, a single-day spike of 12.4%. While the absolute level remains in the neutral range (15-20), the speed of the move warrants attention. A VIX above 18 typically signals rising near-term risk pricing.
6. Safe Haven Demand — 63.2 (Greed) The 20-day stock vs bond outperformance spread is +2.63%, narrowing from prior readings. Investors still favor equities over safe havens, but this leading indicator is declining from the upper Greed range. Continued narrowing would signal a shift in risk appetite.
7. Junk Bond Demand — 53.0 (Neutral) High-yield spread over investment-grade stands at 1.29%, in neutral territory. Credit market sentiment remains calm with no flight-to-safety signals. This is the most stable of the seven indicators.
⚡ Structural Contradictions
Contradiction 1: Elevated SPX vs Collapsing Breadth
SPX remains above 7400 at all-time highs, yet Stock Price Breadth is just 15 (Extreme Fear) — the most significant structural divergence among all seven indicators. A handful of mega-cap tech names are holding up the index while the majority of stocks are bleeding. Similar patterns appeared at the 2000 and 2007 tops.
Contradiction 2: Calm Credit Markets vs Nervous Equities
HY OAS at 2.68% (🟢 Normal) and Junk Bond Demand at 53 (Neutral) show zero stress in credit markets. Meanwhile, equity sentiment indicators are broadly in Fear territory. Historically, credit markets lead equities by 3-6 months. Current credit calm suggests low probability of systemic crisis, but does not rule out a technical correction.
Contradiction 3: Safe Haven Greed vs Broad Fear
Safe Haven Demand at 63.2 (Greed) is the only Greed signal among the seven. This indicates retail and passive flows continue pouring into equities (record ETF inflows of $856B YTD), while professional investors (Put/Call, Breadth) are already in defensive mode.
Extreme Value Alerts
- Stock Price Breadth: 15.0 — approaching the Extreme Fear lower bound (<15 enters extreme territory). Continued decline would trigger extreme readings.
- No Greed indicators above 80 — no overheating signals present.
- Composite at 39.6 — only 14.6 points from Extreme Fear (25).
📈 Trend Assessment
| Dimension | Assessment |
|---|---|
| Time in Zone | Fear zone for ~10 sessions; previously spent 5 days in Neutral |
| Direction | ↓ Bearish — composite declined from 46.8 to 39.6 since July |
| Turning Signals | VIX spike + Breadth deterioration + Put/Call rising = three-signal bearish resonance |
| Key Support | 25 (Extreme Fear boundary); breach would trigger extreme panic signal |
| Key Resistance | 45 (Neutral lower bound); needs 3 consecutive days above to confirm sentiment repair |
Scenario Analysis:
- Base Case (60%): Composite oscillates in 35-45 Fear range. SPX consolidates at high levels awaiting fundamental catalysts. Healthy credit markets preclude a crash, but upside is limited.
- Bearish Case (30%): Breadth continues deteriorating, VIX rises above 22, composite breaks below 30 into deep Fear territory. SPX could see a 5-8% correction.
- Reversal Case (10%): Earnings season surprises to the upside, capital rotates back to small/mid-caps, breadth repairs, composite climbs back to Neutral.
🚨 Crisis Precursor Dashboard
1. Credit Spreads
| Indicator | Value | Status | Thresholds |
|---|---|---|---|
| High-Yield OAS | 2.68% | 🟢 Normal | <3% Normal / 3-5% Caution / 5-8% Panic / >8% Crisis |
| Investment-Grade OAS | 0.78% | 🟢 Normal | <1% Normal / 1-2% Caution / >2% Panic |
| Trend | Stable | — | HY OAS oscillating in narrow 2.6-2.7% range |
2. Yield Curve
| Indicator | Value | Status |
|---|---|---|
| 10Y-2Y Spread | +34bp | 🟢 Normal / Flattening |
| 10Y Yield | 4.67% | — |
| 2Y Yield | 4.31% | — |
| 30Y Yield | 5.15% | — |
| 10Y-30Y Spread | -48bp | Normal long-end premium |
The curve has recovered from inversion, with 10Y-2Y at +34bp positive spread. Historically, curve re-steepening often precedes recessions, but the current spread magnitude remains moderate.
3. Margin Debt
| Indicator | Value | Status |
|---|---|---|
| FINRA Margin Debt | $1.304T (Apr 2026) | 🔴 All-Time High Territory |
| Note | Margin debt at absolute record, exceeding 2025 highs | High leverage = high fragility |
⚠️ Margin debt is a lagging indicator (monthly release), with latest available data from April. Given SPX has continued rising since April, actual margin debt is likely higher. Elevated margin debt means the market is more sensitive to drawdowns — margin calls during a decline create negative feedback loops.
4. IPO Market
| Indicator | Value | Status |
|---|---|---|
| 2026 YTD IPOs | ~73 (Renaissance Capital) | 🔴 Sustained Activity |
| Note | H1 IPO pace remains elevated but below 2021 bubble levels | Hot but not frothy |
5. Fund Flows
| Indicator | Value | Status |
|---|---|---|
| 2026 YTD ETF Net Inflows | ~$856B | 🔴 Record |
| Note | ETF inflow velocity at all-time high; retail/passive flows surging | Extreme optimism on the flip side |
⚠️ Record ETF inflows are a double-edged sword: they provide market support, but also represent future selling ammunition. If sentiment reverses, passive fund redemptions could amplify downside moves.
Composite Assessment
| Category | Green | Yellow | Red |
|---|---|---|---|
| Credit Markets | 🟢🟢 | — | — |
| Yield Curve | 🟢 | — | — |
| Leverage / Fund Flows | — | — | 🔴🔴 |
| Total | 2 Green | 0 Yellow | 2 Red |
Conclusion: Credit and rates are safe, but leverage and fund flows are at extreme levels. This is not an imminent crash signal, but it indicates rising market fragility. Comparable to January 2018 or February 2020 — not the eve of a crisis, but drawdown risk is accumulating.