CNN Fear & Greed Analysis 2026-07-23
Fear & Greed Composite at 42.8 (Fear), 4th consecutive session in Fear territory. Breadth indicator at Extreme Fear (18.8) while credit market indicators (Junk Bond Demand 55.8, Safe Haven Demand 67.2) remain in Greed, creating a significant cross-market divergence.
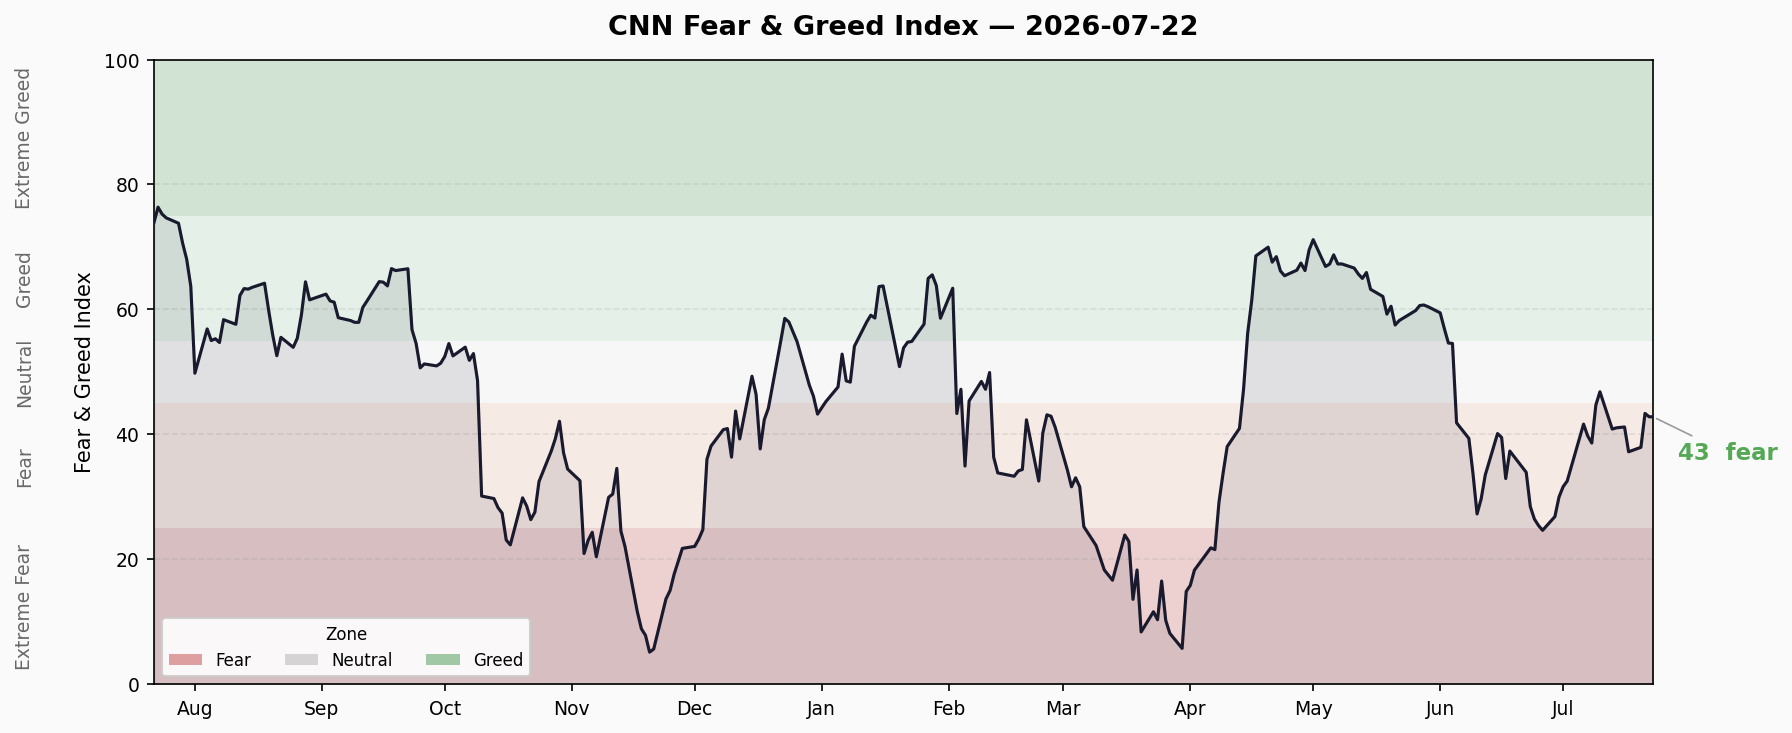
Composite Index Trend
| Metric | Value | Rating | Change |
|---|---|---|---|
| Fear & Greed Composite | 42.83 | 🟠 Fear | Prev close 41.03 → +1.80 |
| 1 Week Ago | 41.06 | Fear | +1.77 |
| 1 Month Ago | 33.94 | Fear | +8.89 |
| 1 Year Ago | 73.89 | Greed | −31.06 |
The composite index reads 42.83, up +1.80 from the prior close of 41.03, remaining in the Fear zone (25–45). The last 10 sessions show a “dip then stabilize” pattern: after falling from 46.83 (Neutral) into Fear on July 11, the index has oscillated narrowly between 37–44. The last three sessions: 37.94 → 43.37 → 42.83, suggesting a short-term bottoming attempt but lacking upward momentum.
Compared to one month ago at 33.94 (near the Extreme Fear boundary), the index has recovered ~9 points, indicating gradual sentiment repair from the most panicked phase. However, versus one year ago at 73.89 (Greed), current sentiment remains at a significantly depressed level.
Seven Sub-Indicators Scan
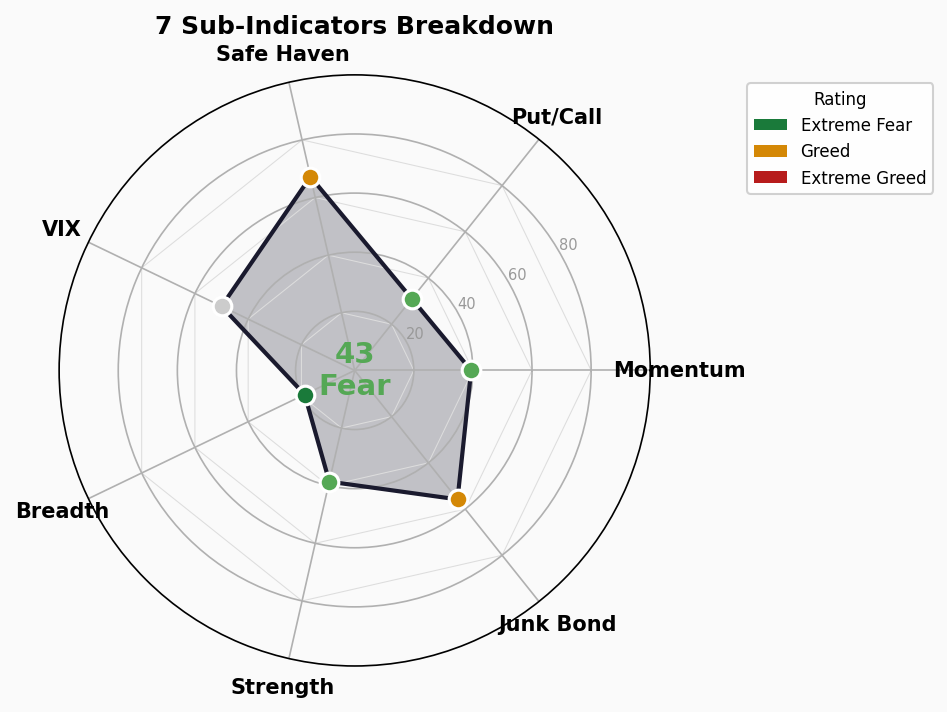
| # | Indicator | Score | Rating | Direction | Interpretation |
|---|---|---|---|---|---|
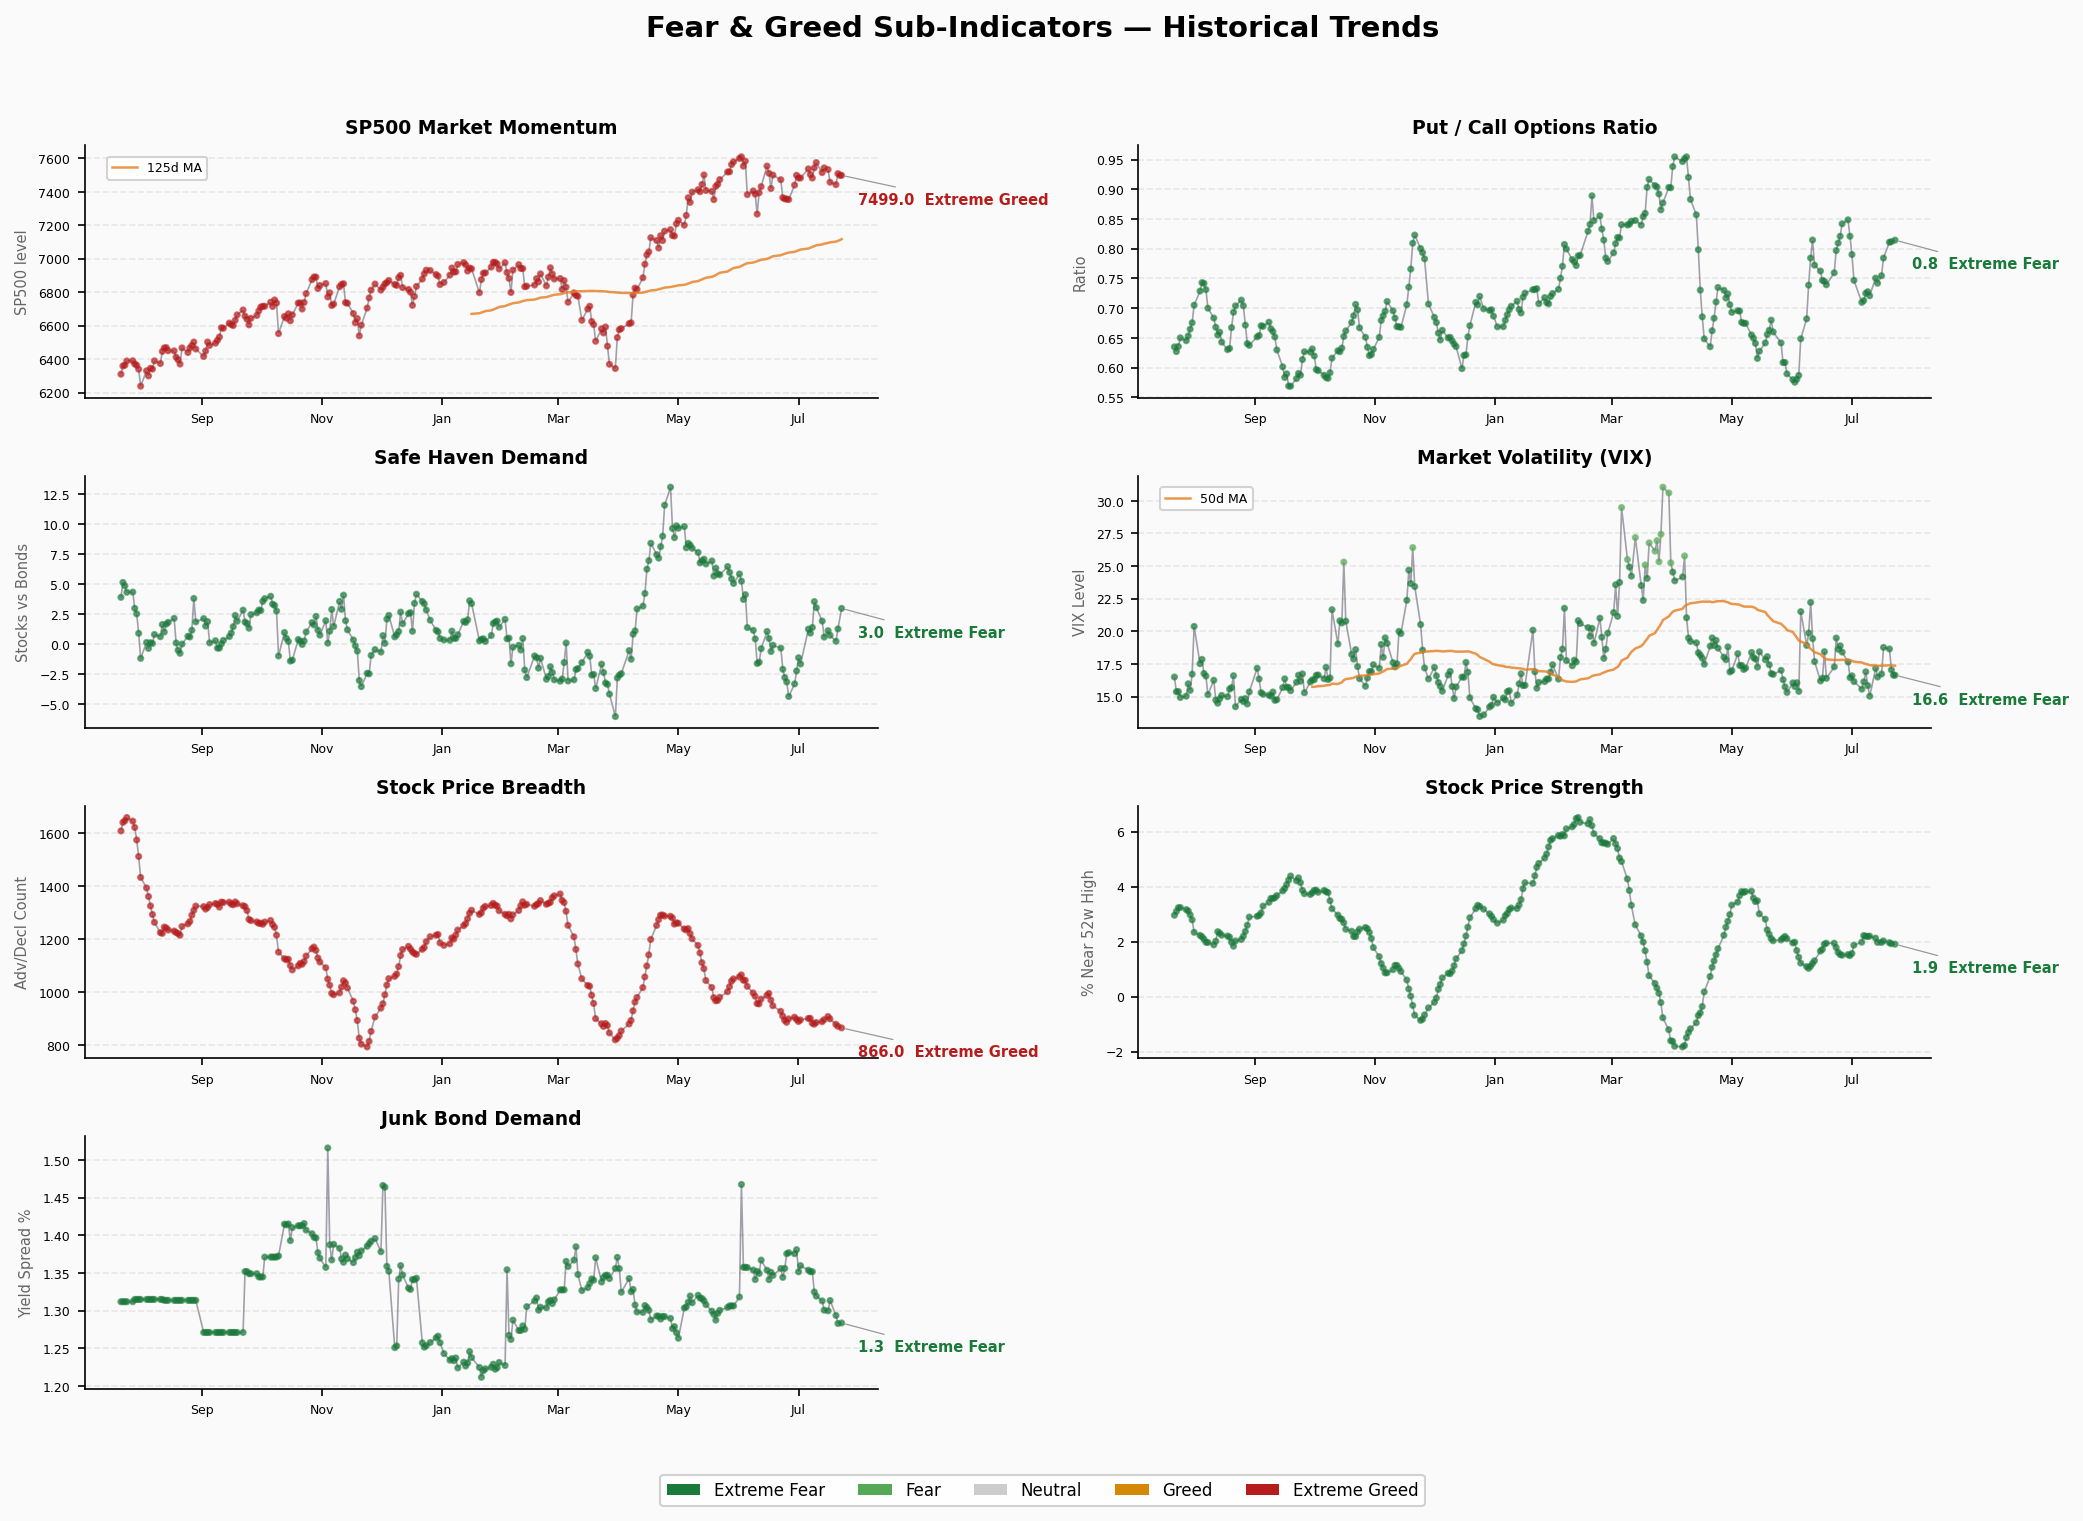
| 1 | Market Momentum (SP500) | 39.4 | 🟠 Fear | — | SP500 deviation from 125-day MA narrowing, momentum fading |
| 2 | Stock Price Breadth | 18.8 | 🔴 Extreme Fear | ⚠️ | New highs vs new lows ratio extremely bearish, breadth deteriorating sharply |
| 3 | Stock Price Strength | 38.6 | 🟠 Fear | — | Low percentage of stocks near 52-week highs |
| 4 | Put/Call Ratio | 31.0 | 🟠 Fear | — | Put options relatively active, hedging demand elevated |
| 5 | Junk Bond Demand | 55.8 | 🟡 Greed | ↑ | Junk bond spread to Treasuries narrowing, risk appetite persists |
| 6 | Safe Haven Demand | 67.2 | 🟡 Greed | ↑ | Stocks performing adequately vs bonds, but elevated score also signals caution |
| 7 | VIX (Market Volatility) | 50.0 | ⚪ Neutral | — | VIX at mid-range, volatility expectations not extreme |
Structural Divergence Analysis
The seven sub-indicators exhibit significant internal fragmentation:
🟢 Bullish Signals (2/7)
- Junk Bond Demand 55.8 (Greed): Credit markets show no panic. HY OAS at just 2.69%, well below the 3%警戒线. Capital still chasing yield.
- Safe Haven Demand 67.2 (Greed): Stocks are still favored relative to bonds.
🔴 Bearish Signals (4/7)
- Breadth 18.8 (Extreme Fear): The biggest red flag. New highs are far outnumbered by new lows, suggesting the index’s surface stability masks widespread individual stock decline. This is the classic “index holds, stocks crumble” divergence pattern.
- Stock Price Strength 38.6 (Fear): Most stocks are far from 52-week highs.
- Put/Call 31.0 (Fear): Options market leaning defensive.
- Market Momentum 39.4 (Fear): SP500 momentum decelerating.
⚪ Neutral (1/7)
- VIX 50.0 (Neutral): Volatility expectations neutral, market not pricing extreme risk.
Core Contradiction
The credit market (Greed) vs equity breadth (Extreme Fear) divergence is the most noteworthy signal. Historically, similar divergences tend to appear near market tops or in early correction phases — credit markets lag equity markets in reacting to risk. Junk bond demand staying in Greed suggests ample liquidity, but the extreme deterioration in breadth warns that capital is rotating out of most individual stocks and concentrating in a few mega-cap names.
Trend Outlook
- Current Zone: Fear (25–45), 4 consecutive sessions.
- Recent Path: Briefly touched Greed (56+) in mid-June, then rapidly fell back to Fear in early July. Currently in the upper-middle of the Fear range (42.8).
- Key Watch Points:
- Whether Breadth can recover from Extreme Fear (18.8) is critical for near-term sentiment repair.
- If Junk Bond Demand also begins retreating from Greed, it would confirm synchronized cross-market risk appetite contraction.
- VIX at Neutral suggests the market hasn’t priced tail risk, but VIX may lag if breadth continues to deteriorate.
- Directional Bias: Near-term consolidation; medium-term depends on breadth recovery. If breadth fails to improve and the composite breaks below 35, a retest of Extreme Fear is likely.
🚨 Crisis Precursor Dashboard
1. Credit Spreads
- HY OAS: 2.69% (2026-07-21) | 🟢 Normal
- Thresholds: <3% Normal | 3–5% Alert | 5–8% Panic | >8% Crisis
- IG OAS: 0.78% (2026-07-21) | 🟢 Normal
- Thresholds: <1% Normal | 1–2% Alert | >2% Panic
- Trend: Credit spreads at historically low levels. No stress signals whatsoever in credit markets. HY OAS well below 3%警戒线, IG OAS below 1%. This is the most reassuring indicator.
2. Yield Curve
- 10Y-2Y Spread: +36bp | 🟢 Normal-Flat
- 10Y: 4.63% | 2Y: 4.26% | 30Y: 5.13%
- 10Y-30Y Spread: −50bp (30Y > 10Y, long end steepening)
- Trend: The curve has been out of inversion for some time, now with a modest positive spread. However, +36bp qualifies as flat territory. Historically, curve re-steepening from inversion often accompanies economic slowdown or recession. The long end (30Y at 5.13%) significantly above the short end reflects market pricing of long-term inflation/fiscal premium.
3. Margin Debt
- FINRA Margin Debt: $1.304T (April 2026, latest available) | 🔴 All-Time High Zone
- Interpretation: Margin debt at historically extreme levels, indicating very high leveraged participation. High margin debt alone is not a sell signal, but if the market turns, the deleveraging process amplifies drawdowns. Watch for whether May/June data shows any decline.
4. IPO Market
- 2026 YTD IPOs: ~73 (Renaissance Capital estimate) | 🟡 Moderately Active
- Interpretation: IPO count at moderate levels — neither the frenzy of 2021 (400+ full year) nor the freeze of 2022–2023. Current IPO pace does not constitute an overheating signal.
5. Fund Flows
- 2026 YTD ETF Net Inflows: ~$856B (record pace) | 🔴 Record Inflows
- Interpretation: ETF capital pouring in at unprecedented velocity. On one hand, this reflects strong allocation demand from both retail and institutional investors. On the other, historical patterns show extreme inflows tend to occur late in market cycles. Full-year 2021 ETF inflows were ~$900B; 2026 is approaching that in just over half a year.
Composite Assessment
| Indicator | Status |
|---|---|
| Credit Spreads (HY OAS) | 🟢 Normal |
| Credit Spreads (IG OAS) | 🟢 Normal |
| Yield Curve (10Y-2Y) | 🟢 Normal-Flat |
| Margin Debt | 🔴 All-Time High |
| IPO Activity | 🟡 Moderate |
| ETF Fund Flows | 🔴 Record |
2 🟢 / 1 🟡 / 2 🔴
Conclusion: Crisis precursor indicators paint a picture of “healthy credit + overheated flows.” Credit spreads and yield curve are not sounding alarms, but historically extreme margin debt and ETF inflows warn of excessive market participation. Combined with FNG Breadth at Extreme Fear, the current environment resembles liquidity-driven structural divergence rather than a systemic crisis eve. However, the extreme levels of leverage and inflows mean that any catalyst (inflation surprise, geopolitical risk) could amplify the magnitude of a correction.