CNN Fear & Greed Analysis 2026-07-22
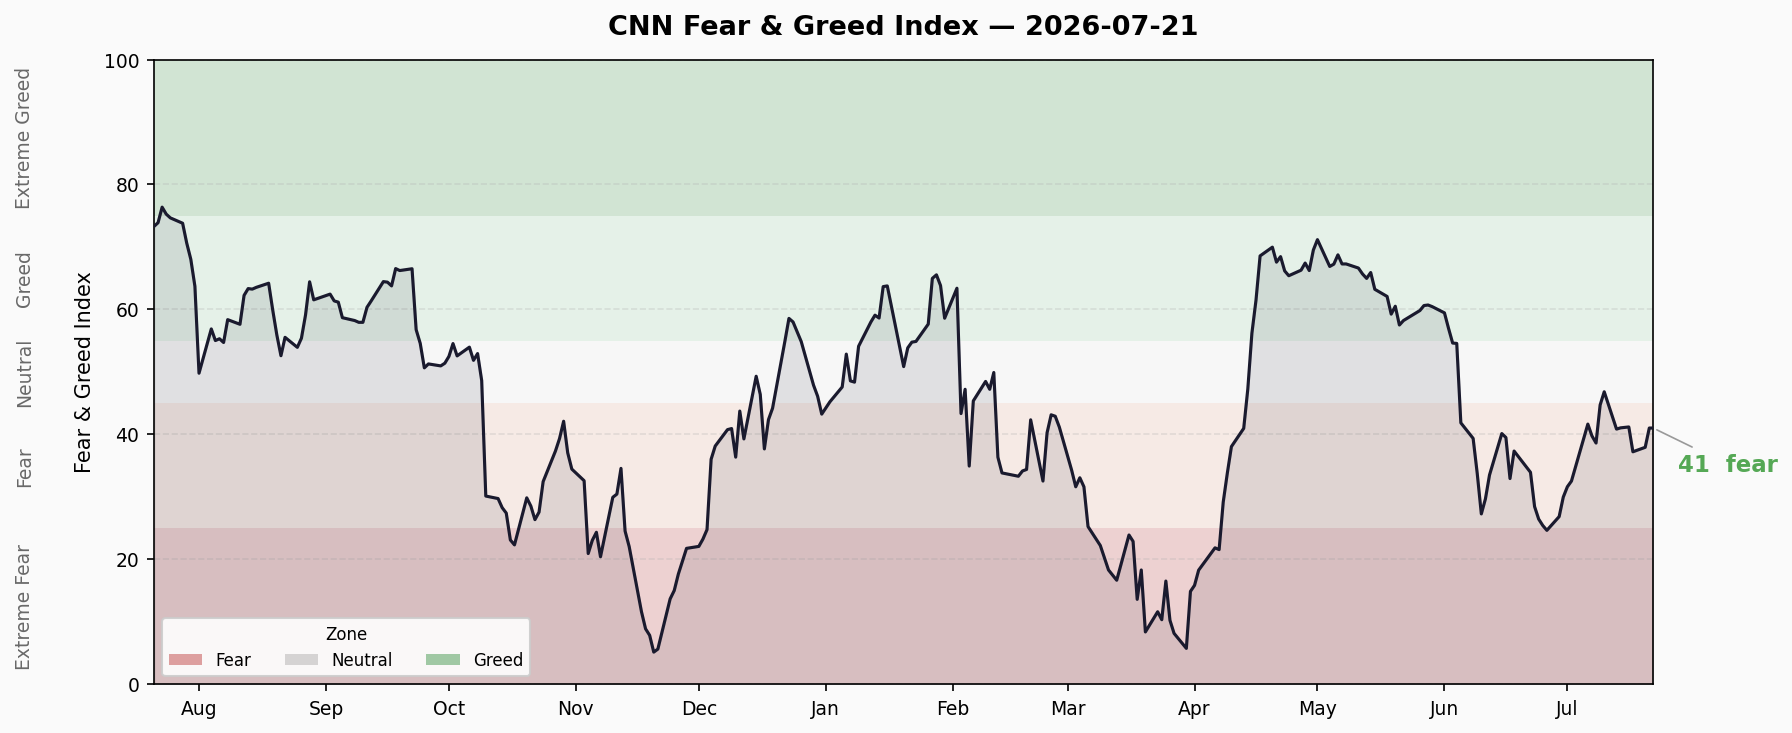
Composite 41.03 (Fear), +3.51 vs prior close. Three consecutive weeks oscillating in Fear territory. Stock Price Breadth hits 19 (Extreme Fear), while Junk Bond Demand bucks the trend. Crisis indicators: credit spreads normal, yield curve normal-but-flat, margin debt and ETF inflows at historic extremes.
Composite Index Trend
| Metric | Value |
|---|---|
| Latest Composite | 41.03 |
| Sentiment Rating | 😨 Fear |
| Prior Close | 37.51 (+3.51 ↑) |
| 1 Week Ago | 41.06 (-0.03 →) |
| 1 Month Ago | 37.34 (+3.69 ↑) |
| 1 Year Ago | 73.29 (-32.26 ↓) |
Recent Trend: The composite has been in the Fear zone since July 3, roughly three weeks. It bottomed at 33.5 on July 9 before rebounding toward 41, with a modest three-day uptick. At 41.03, the index sits in the upper portion of the Fear range (25-45), just 4 points from the Neutral threshold (45).
Notably, the index stood at 73.29 (Greed) one year ago — a 32-point decline that represents a fundamental shift in market psychology.
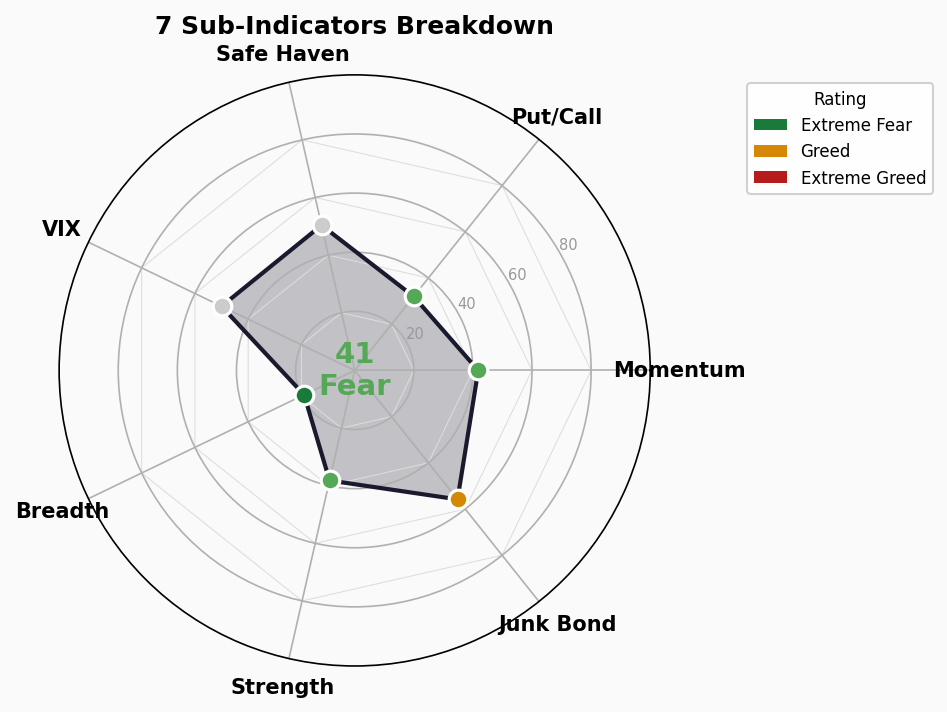
Seven Sub-Indicator Scan
1. 📉 Stock Price Strength — 38.2 | Fear
NYSE 52-week highs vs. lows ratio leans bearish. Individual stock momentum remains weak; most names are struggling near lows.
2. ⚠️ Stock Price Breadth — 19.0 | Extreme Fear
Most bearish signal today. Advancing vs. declining breadth has fallen into Extreme Fear (<20). A large number of individual stocks are declining in sync — rallies lack broad participation. Deteriorating breadth is often a precursor to deeper corrections.
3. 📊 Market Volatility (VIX) — 50.0 | Neutral
VIX sits in neutral territory — no panic spike, but no complacency either. Current volatility levels suggest concern without capitulation. This is the most level-headed reading among the seven.
4. 📉 Put/Call Options — 32.0 | Fear
Put volume remains elevated relative to calls. Market participants continue hedging downside risk. Consistent with the overall Fear posture.
5. 🟢 Junk Bond Demand — 55.8 | Greed
The lone bullish signal. High-yield spreads vs. investment-grade are tightening; money is still chasing risk premiums. Bond market participants are more optimistic than equity traders — a notable divergence, as bond investors are often considered the “smart money.”
6. ⚖️ Safe Haven Demand — 50.4 | Neutral
Stock performance relative to Treasuries is neutral. Capital is neither flooding into safe havens nor aggressively chasing risk. A neutral reading in a Fear environment is actually a mildly constructive signal.
7. 📉 Market Momentum — 41.8 | Fear
S&P 500 deviation from its 125-day moving average has entered Fear territory. The index is struggling around its moving average, with weak momentum.
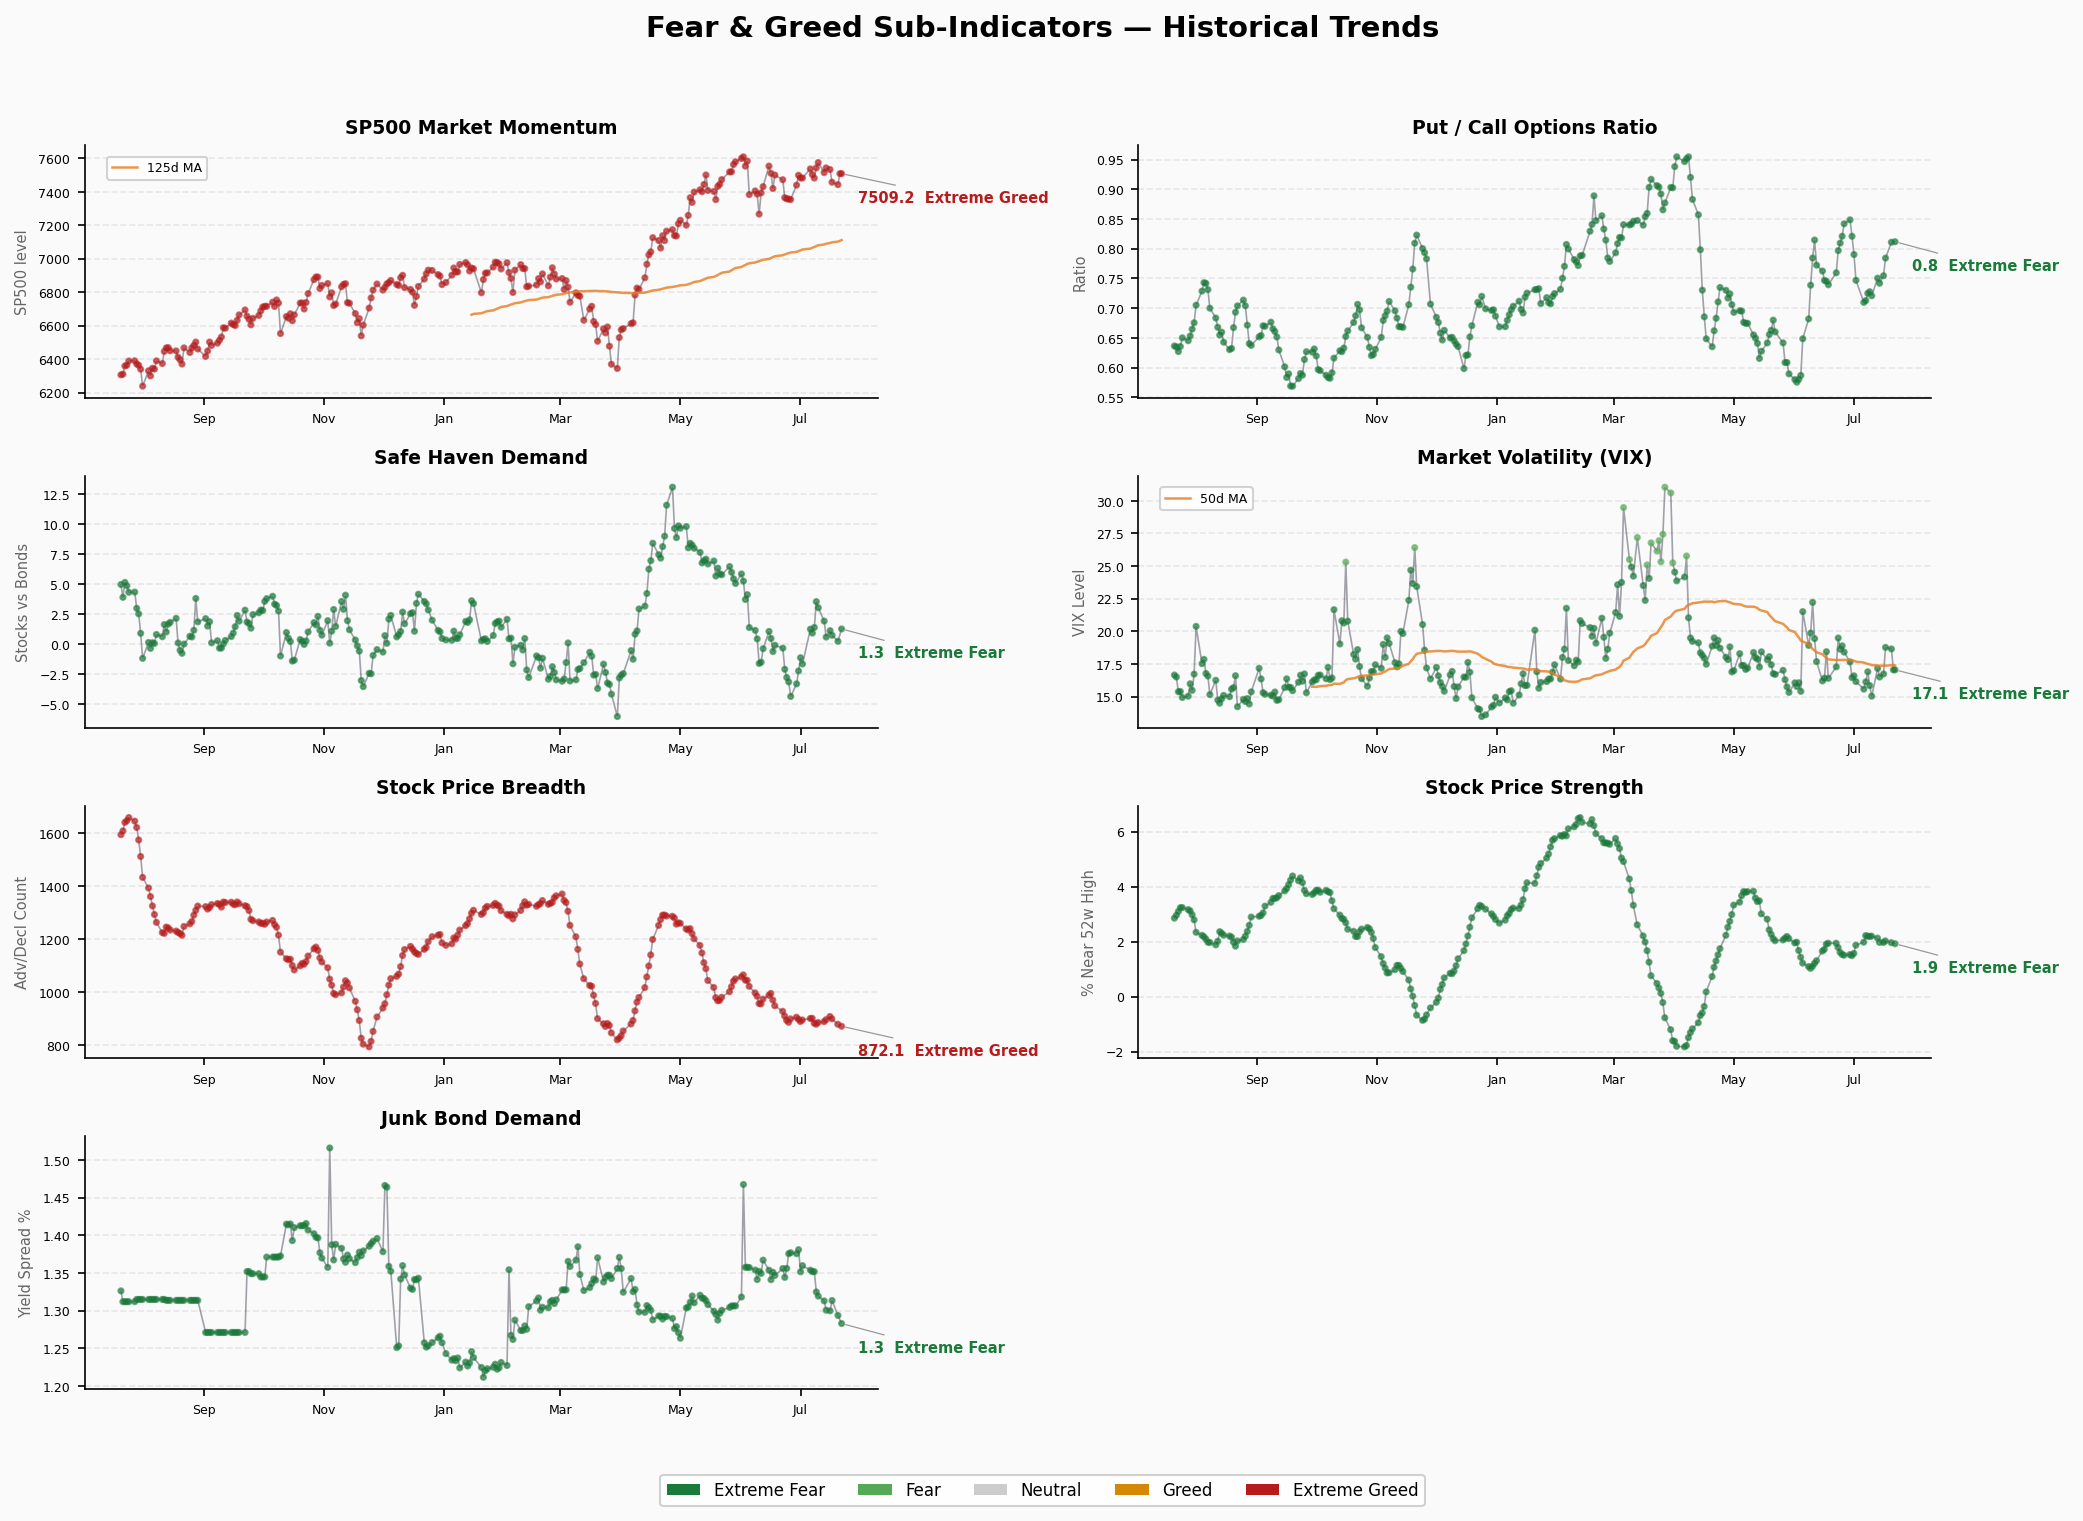
Structural Divergence Analysis
Extreme Value Alerts
- Stock Price Breadth @ 19.0 (Extreme Fear): The most concerning indicator. When breadth reaches this extreme, rallies typically lack internal strength — even if the headline index appears stable, individual stocks are deteriorating beneath the surface. Historically, such readings lead to either: (a) a rapid V-shaped breadth recovery, or (b) consolidation at lower levels followed by further declines.
Divergence Signals
Junk Bonds vs. Equities: Junk Bond Demand (55.8, Greed) diverges from the overall composite (41.03, Fear). Bond market participants are chasing risk premiums while equity sentiment is fearful. Historically, when junk bonds recover first and equities lag, it can be an early bottoming signal. However, if junk bonds subsequently weaken as well, it would signal a genuine credit event unfolding.
VIX Neutral vs. Breadth Extreme: VIX (50, Neutral) and Stock Price Breadth (19, Extreme Fear) are sending mixed messages. The volatility market is not pricing in crash risk, yet individual stocks are quietly deteriorating. This pattern suggests a “slow bleed” rather than a sharp crash.
Zone Distribution
| Zone | Count | Indicators |
|---|---|---|
| Extreme Greed (>80) | 0 | — |
| Greed (60-80) | 1 | Junk Bond Demand |
| Neutral (45-60) | 2 | VIX, Safe Haven Demand |
| Fear (25-45) | 3 | Price Strength, Put/Call, Market Momentum |
| Extreme Fear (<25) | 1 | Stock Price Breadth |
The distribution skews left (fear side), but is not a full-blown panic. The key question: can the resilience in other indicators offset this single extreme breadth reading?
Trend Assessment
- Time in Fear Zone: ~3 weeks (since July 3), preceded by ~2 weeks hovering at the Fear/Neutral boundary. The broader downtrend began in late June.
- Direction: The last three sessions moved 37.2 → 37.9 → 41.0, a gradual recovery. A move above 45 (Neutral) would confirm a short-term bottom.
- Reversal Risk: If Stock Price Breadth deteriorates further (below 15), the composite could be dragged into Extreme Fear even if other indicators hold steady.
- Key Watchpoint: Whether Junk Bond Demand stays bullish — if even junk bond demand turns, it would be a strong signal of a full shift toward Extreme Fear.
🚨 Crisis Precursor Dashboard
1. Credit Spreads
- HY OAS: 2.69% (2026-07-20) | 🟢 Normal
- Thresholds: <3% Normal | 3-5% Caution | 5-8% Panic | >8% Crisis
- IG OAS: 0.78% (2026-07-20) | 🟢 Normal
- Thresholds: <1% Normal | 1-2% Caution | >2% Panic
- Trend: Both spreads remain at historically low levels. No stress in credit markets. HY OAS and IG OAS are both in “greed” territory. This is the most reassuring signal — ahead of both the 2008 and 2020 crashes, credit spreads had widened significantly before equities cracked.
2. Yield Curve
- 10Y-2Y Spread: +37bp | 🟢 Normal-but-Flat
- Thresholds: >50bp Normal | 0-50bp Flat | <0 Inverted
- Key Yields: 10Y 4.60% | 2Y 4.21% | 30Y 5.11%
- Analysis: The curve has exited inversion (after nearly two years inverted), but +37bp remains flat. The 30Y-10Y spread is actually inverted at -51bp (5.11% vs 4.60%), with long-end yields unusually elevated — reflecting market concerns about fiscal deficits and sticky inflation.
3. Margin Debt
- FINRA Margin Debt: $1.304T (April 2026, latest available) | 🔴 All-Time High Territory
- Analysis: Margin debt at absolute highs. High margin debt alone is not a problem, but if a market decline triggers forced liquidation, it creates a “decline → margin call → accelerated decline” feedback loop. May-June data pending FINRA release; if balances begin declining, that would be an early deleveraging signal.
4. IPO Market
- 2026 YTD IPOs: ~73 (Renaissance Capital estimate) | 🟡 Cool
- Analysis: IPO pace has slowed vs. 2025 (~90 same period). The window is not frozen but activity is declining, reflecting reduced risk appetite in primary markets.
5. Fund Flows
- 2026 YTD ETF Net Inflows: ~$856B (record) | 🔴 Extreme Euphoria
- Analysis: ETF money is pouring in at record pace, continuing the 2024-2025 passive investing boom. Record inflows amid Fear sentiment indicate a disconnect between “passive buying” and “active sentiment” — retail and institutional money keeps flowing via ETFs, while active trader sentiment is subdued.
Composite Assessment
| Status | Signal | Count |
|---|---|---|
| 🟢 Green | Credit spreads, Yield curve | 2 |
| 🟡 Yellow | IPO activity | 1 |
| 🔴 Red | Margin debt, ETF inflows | 2 |
2 Green / 1 Yellow / 2 Red
Overall, crisis precursor indicators are moderately benign. Credit markets — the most important leading indicator — show no alarm whatsoever. The two red signals (margin debt + ETF inflows) are “excess prosperity” risks rather than “credit crunch” risks, pointing more toward market fragility than imminent collapse.
Caveat: high margin debt + Fear sentiment means that if a catalyst emerges (deteriorating economic data, geopolitical shock), deleveraging could happen quickly. The current environment is better described as “high fragility” rather than “about to break.”