CNN Fear & Greed Analysis 2026-07-21
Fear & Greed Composite at 37.51 (Fear), marking the 4th consecutive session in Fear territory. Breadth plunges to Extreme Fear (19.4), while Safe Haven Demand improves dramatically, creating a bullish divergence. Credit spreads normal, yield curve normal-flat, but margin debt and fund inflows remain at historical extremes.
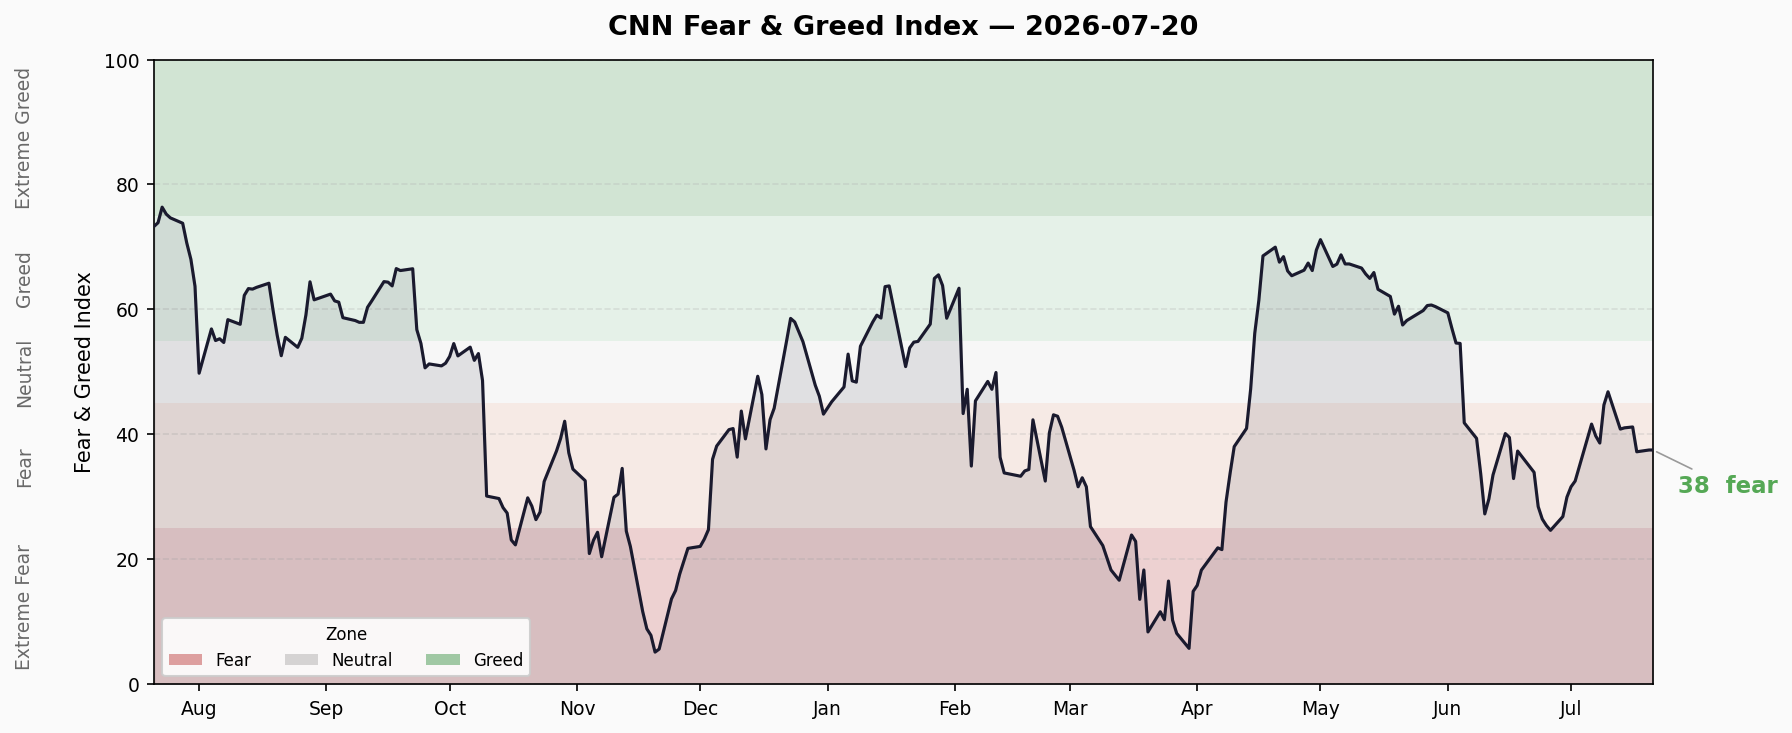
Composite Index Trend
| Metric | Value |
|---|---|
| Fear & Greed Index | 37.51 |
| Rating | Fear 😨 |
| vs Previous Close | +0.43 (37.09 → 37.51) |
| vs 1 Week Ago | -3.34 (40.86 → 37.51) |
| vs 1 Month Ago | +0.17 (37.34 → 37.51) |
| vs 1 Year Ago | -36.43 (73.94 → 37.51) |
Last 10 Sessions Trend:
Jul 07: 39.8 (Fear)    Jul 08: 38.6 (Fear)
Jul 09: 44.7 (Fear)    Jul 10: 46.8 (Neutral) ← brief touch of Neutral
Jul 13: 40.9 (Fear)    Jul 14: 41.1 (Fear)
Jul 16: 41.2 (Fear)    Jul 17: 37.2 (Fear)
Jul 20: 37.5 (Fear)    Jul 21: 37.5 (Fear)
Overall direction: briefly touched Neutral (46.8) on July 10 before retreating. The last 4 sessions have consolidated in the lower 37-41 range. ~12 points above Extreme Fear threshold (25), ~7 points below Neutral (45).
Sub-Indicator Breakdown
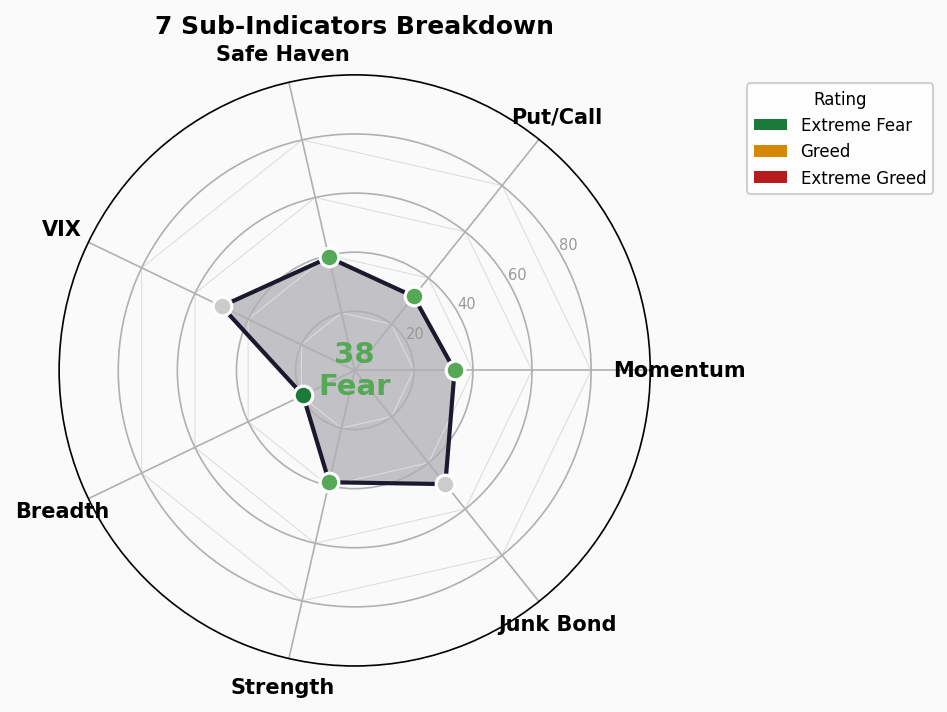
1. Stock Price Strength — 38.8 😨 Fear
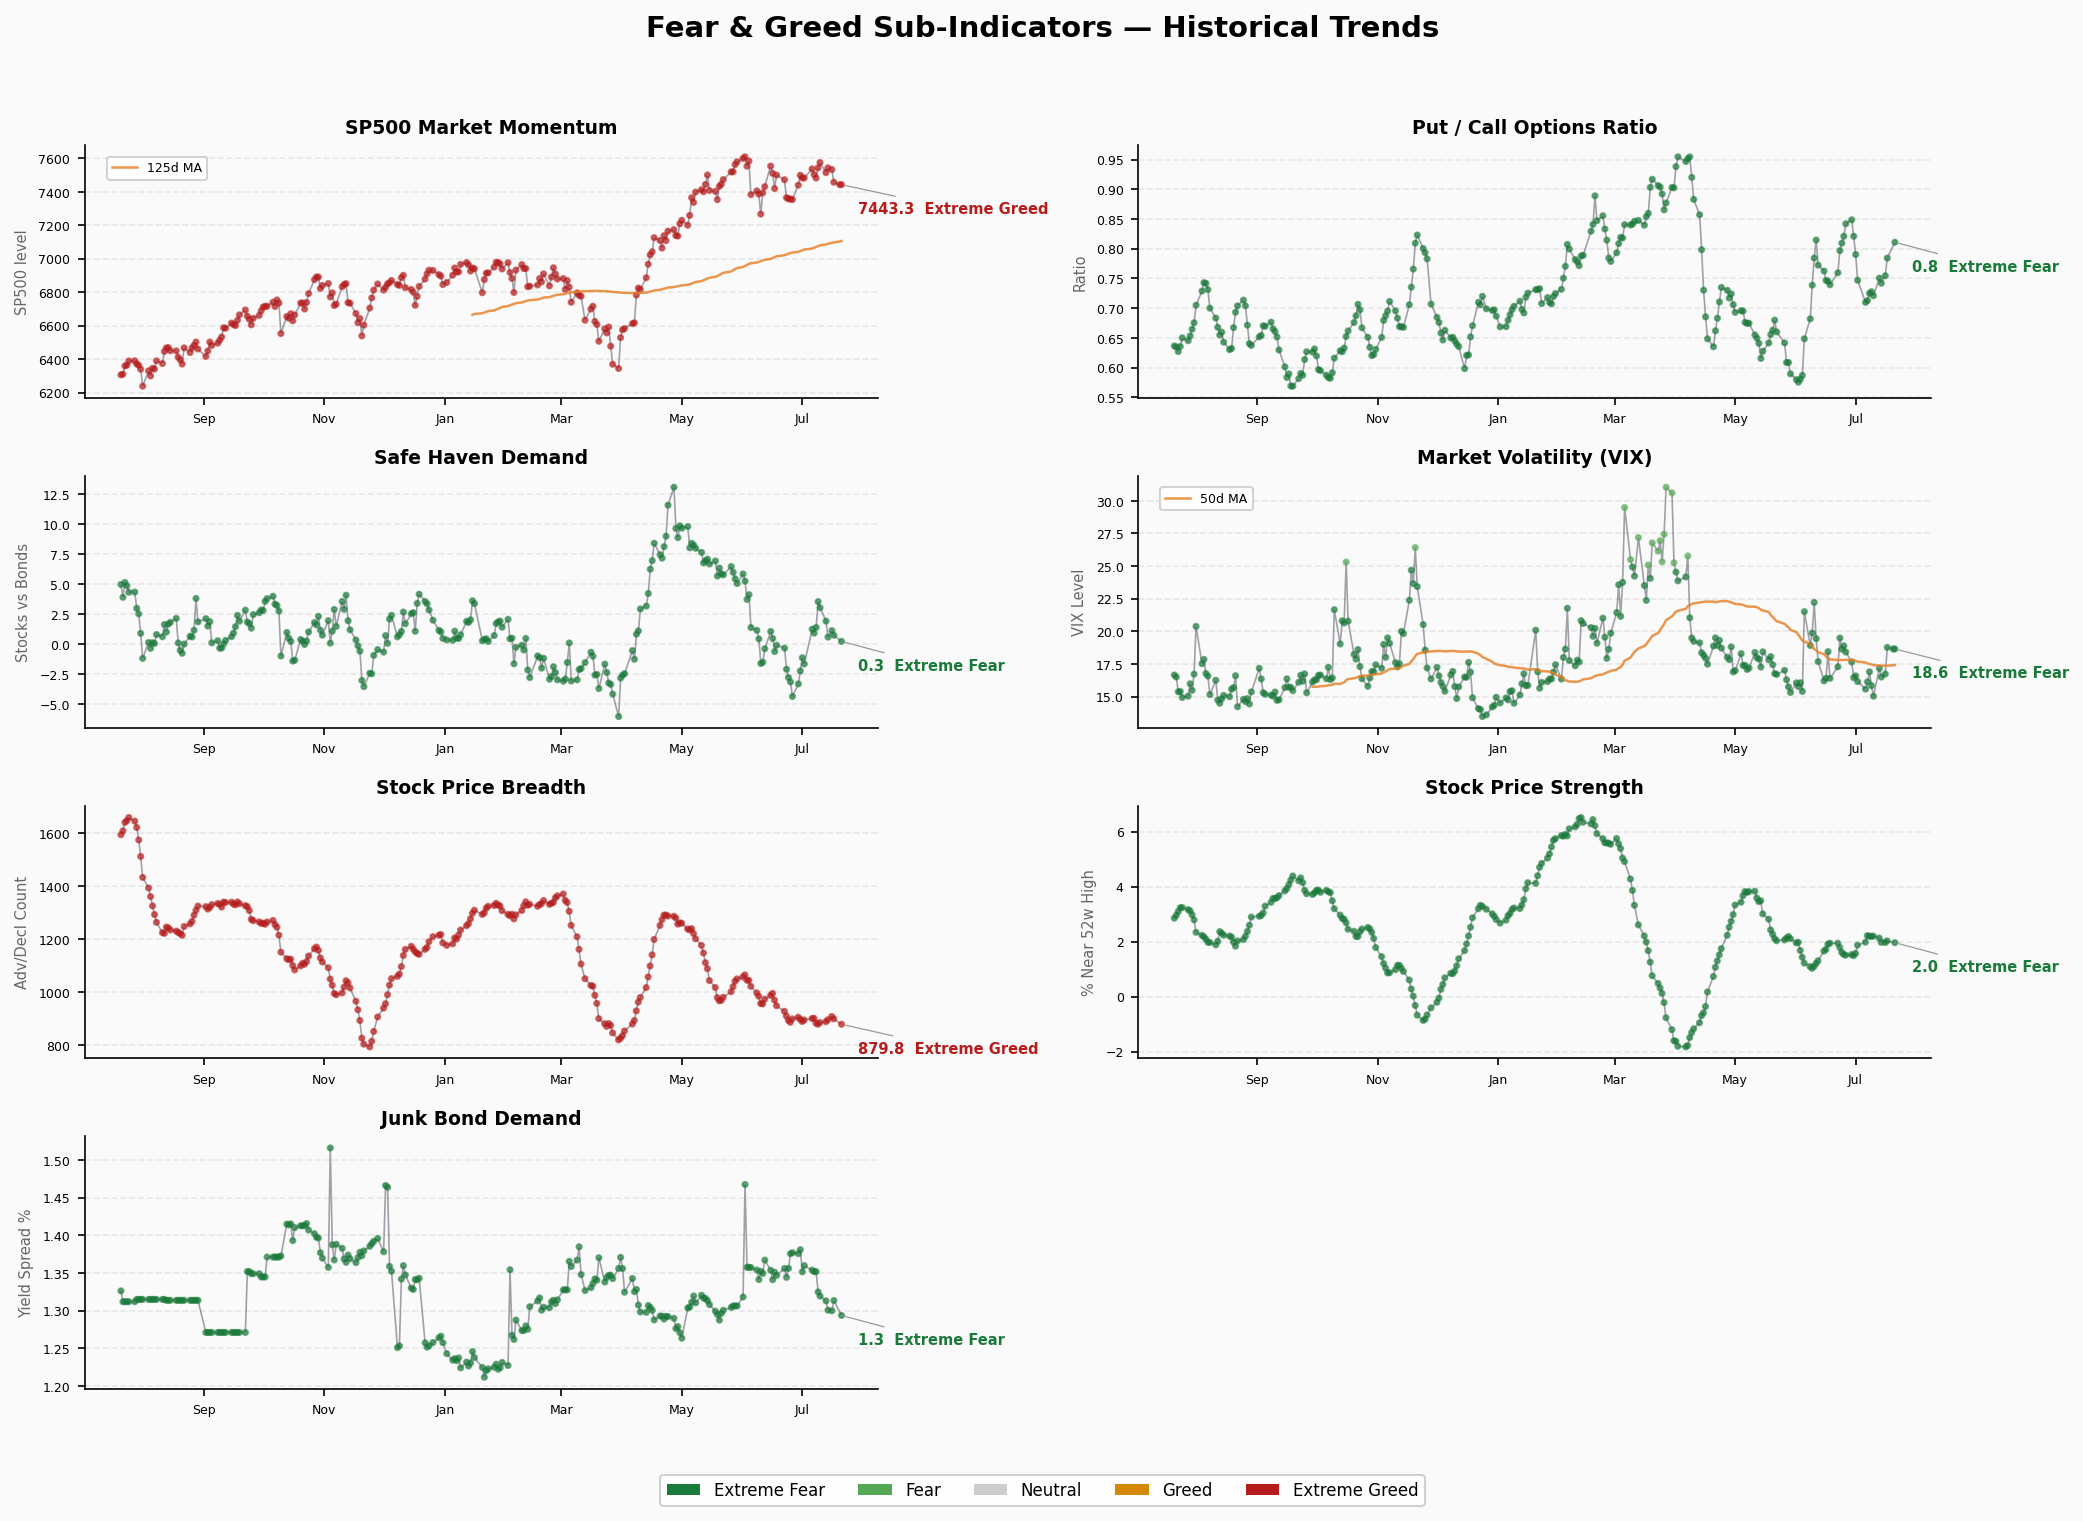
- Raw Value: 1.97 (NYSE 52-week high/low ratio)
- Previous: 2.03 | Direction: ↓ Declining
- Fewer stocks making 52-week highs, more making lows. Upward momentum weakening.
2. Stock Price Breadth — 19.4 😱 Extreme Fear
- Raw Value: 879.77M (NYSE advancing/declining volume)
- Previous: 900.15M | Direction: ↓ Declining
- ⚠️ Most extreme reading among all indicators. Volume concentrated in declining stocks, market participation deteriorating.
3. Market Momentum — 33.8 😨 Fear
- S&P 500: 7,443.28 | 125-Day MA: 7,102.48
- Previous: Flat | Direction: → Sideways
- S&P remains ~4.8% above its 125-day MA, but momentum score continues to slide. Stark contrast to Extreme Greed readings of a year ago.
4. Put/Call Ratio — 32.0 😨 Fear
- Raw Value: 0.811
- Previous: 0.784 | Direction: ↑ Rising
- Increased put buying signals growing hedging demand. Bearish tilt.
5. Market Volatility (VIX) — 50.0 😐 Neutral
- VIX: 18.65 | VIX 50-Day MA: 17.40
- Previous: 18.65 | Direction: → Flat
- VIX oscillating in the 18-19 range, historically median. Neither panic nor complacency. The only Neutral reading among the seven.
6. Junk Bond Demand — 49.2 😐 Neutral
- Raw Value: 1.294 (junk vs. investment-grade spread ratio)
- Previous: 1.313 | Direction: ↓ Narrowing
- Spread modestly narrowing, marginal improvement in credit risk appetite. A hair away from Greed territory.
7. Safe Haven Demand — 39.2 😨 Fear
- Raw Value: 0.254 (stocks vs. Treasuries relative performance)
- Previous: 0.760 | Direction: ↓ Sharply lower
- 📈 Most notable positive signal. Stocks significantly outperforming Treasuries, indicating capital rotating back from safe havens. The most dramatic improvement across all seven indicators.
Structural Divergence Analysis
Extreme Readings
- Breadth 19.4 (Extreme Fear): The only indicator in Extreme Fear territory. Declining volume persistently exceeds advancing volume, signaling internal market weakness that demands attention.
- VIX 50.0 (Neutral): Volatility has not followed breadth deterioration, suggesting the market is not pricing systemic risk. An intriguing divergence.
Divergence Signals
- Bullish Divergence: Safe Haven Demand plunged from 0.760 to 0.254 (↓67%), with stocks decisively outperforming Treasuries. Meanwhile, Junk Bond Demand holds at 49.2 near the upper Neutral boundary. Both form a mild divergence against the overall Fear rating.
- Bearish Divergence: Breadth at Extreme Fear while the index remains above its 125-day MA. If breadth fails to improve, index resilience may prove unsustainable.
Overall Assessment
The market is in a state of “fractured fear” — poor breadth but low volatility, improving safe haven demand but rising put/call ratios. No clear directional consensus; more akin to selective anxiety awaiting a catalyst.
Trend Outlook
- Duration in Zone: FNG has been in the Fear range (25-45) for approximately 3 months (since late April), with occasional dips into Extreme Fear and brief touches of Neutral.
- Recent Direction: After bouncing to Neutral (46.8) on July 10, failed to sustain and quickly retreated to ~37. Short-term momentum is weak.
- Key Levels: Resistance at 45 (Neutral threshold), support at 25 (Extreme Fear threshold). Current 37.5 sits in the lower half of the range.
- Reversal Signals: If Safe Haven Demand continues improving + breadth bottoms and rebounds, FNG could break above 45. If breadth continues deteriorating + VIX breaks above 22, a move toward 25 is possible.
🚨 Crisis Precursor Dashboard
1. Credit Spreads
- HY OAS: 2.73% (2026-07-17) | 🟢 Normal/Greed
- Thresholds: <3% Normal | 3-5% Caution | 5-8% Panic | >8% Crisis
- IG OAS: 0.79% (2026-07-17)
- Thresholds: <1% Normal | 1-2% Caution | >2% Panic
- Trend: Stable. Credit markets show no stress signals — the healthiest macro indicator at present.
2. Yield Curve
- 10Y-2Y Spread: +39bp | 🟢 Normal-Flat
- 10Y: 4.55% | 2Y: 4.18% | 30Y: 5.06%
- 10Y-30Y Spread: -51bp (long-end inversion persists)
- Trend: Short-end curve has normalized (no longer inverted), but 10Y-30Y remains inverted by 51bp, reflecting lingering doubts about long-term economic growth.
3. Margin Debt
- FINRA Margin Debt: $1.304T (April 2026, latest available) | 🔴 Historical High Range
- Interpretation: Margin debt at extreme levels. High leverage increases market vulnerability to negative shocks. Note: this is April data, lagging ~3 months.
4. IPO Market
- 2026 YTD IPO Count: ~73 (Renaissance Capital estimate)
- Status: 🔴 Record Fund Inflows
- Interpretation: YTD ETF net inflows of $856B set an all-time record, indicating sustained retail and institutional capital deployment. IPO count is normal-to-elevated — neither 2021-style froth nor a freeze.
5. Fund Flows
- 2026 YTD ETF Net Inflows: ~$856B | 🔴 Record
- Interpretation: Persistent inflows may reflect FOMO, but could also be structural allocation demand (401k, passive investing trends). Creates an interesting contrast with FNG’s Fear reading — people keep buying while feeling afraid.
Composite Assessment
| Indicator | Status |
|---|---|
| Credit Spreads (HY OAS) | 🟢 Normal |
| Yield Curve (10Y-2Y) | 🟢 Normal-Flat |
| Margin Debt | 🔴 Historical High |
| IPO / Fund Flows | 🔴 Record |
2 🟢 / 0 🟡 / 2 🔴
Core Contradiction: Credit markets and the yield curve — the two most reliable leading indicators — both flash green, suggesting low systemic crisis probability. But margin debt and fund inflows at historical extremes indicate elevated sentiment and leverage. Should a catalyst emerge (inflation rebound, geopolitical shock, earnings miss), the deleveraging process could be sharp.
Cross-Reference with FNG: FNG sits in Fear territory (37.51), contrasting with the two green lights on crisis indicators. This suggests current fear stems more from internal market structure (breadth deterioration, momentum decay) than from macro systemic risk. If credit spreads remain stable, deep pullbacks are more likely buying opportunities than the start of a crisis.