CNN Fear & Greed Analysis 2026-07-20
CNN Fear & Greed Index at 37.06 (Fear), down sharply from 41.69 prior close. Five of seven sub-indicators in Fear, Market Breadth at Extreme Fear (21.4), only VIX at Neutral. Crisis dashboard: credit spreads normal, yield curve flat but not inverted, margin debt at record $1.304T, ETF inflows at record $856B YTD.
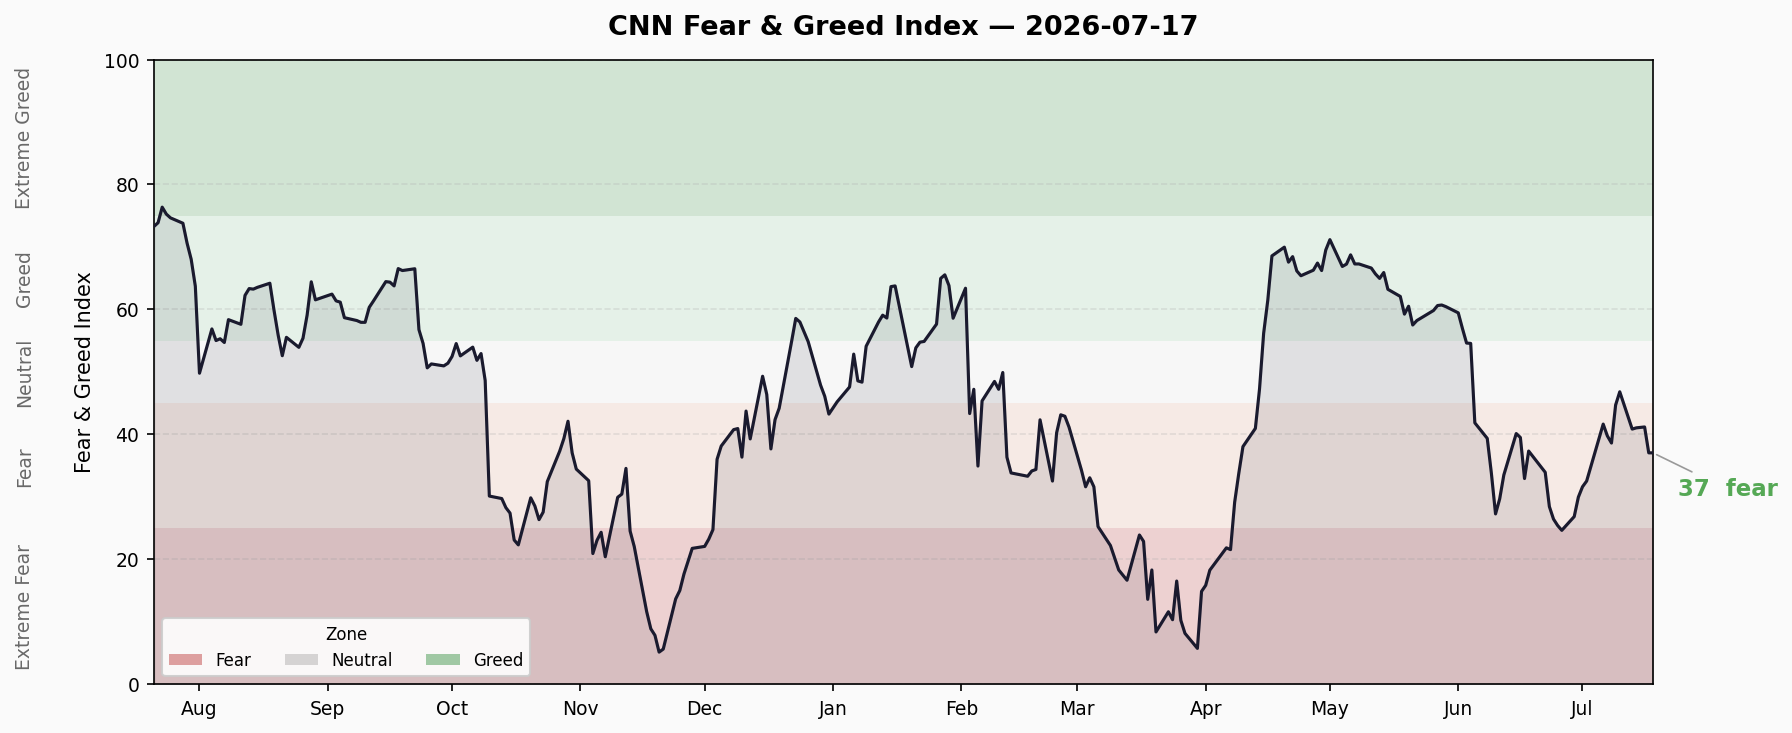
📊 Composite Index Trend
| Metric | Value |
|---|---|
| Latest | 37.06 — Fear |
| Previous Close | 41.69 (Fear) |
| Day Change | -4.63 pts ↓ |
| 1 Week Ago | 46.83 (Neutral) |
| 1 Month Ago | 32.94 (Fear) |
| 1 Year Ago | 74.17 (Greed) |
The composite index has now spent three consecutive sessions in Fear territory, with today’s sharp drop from 41.69 to 37.06 marking the largest single-day decline in a week. Just one week ago the index sat at the upper boundary of Neutral (46.83). The pace of sentiment deterioration warrants attention.
Recent 10-day trend (data as of 7/17):
- 7/11 → 41.06 (Fear)
- 7/14 → 41.20 (Fear)
- 7/15 → 41.69 (Fear)
- 7/16 → 41.69 (Fear)
- 7/17 → 37.06 (Fear)
The index consolidated in the 40-42 range for roughly a week before breaking down on 7/17. At 37.06, there remains 12 points of buffer to the Extreme Fear threshold (25), but at the current pace, that boundary could be tested within a week.
🔬 Sub-Indicator Breakdown
| Sub-Indicator | Score | Rating | Raw Value | Direction |
|---|---|---|---|---|
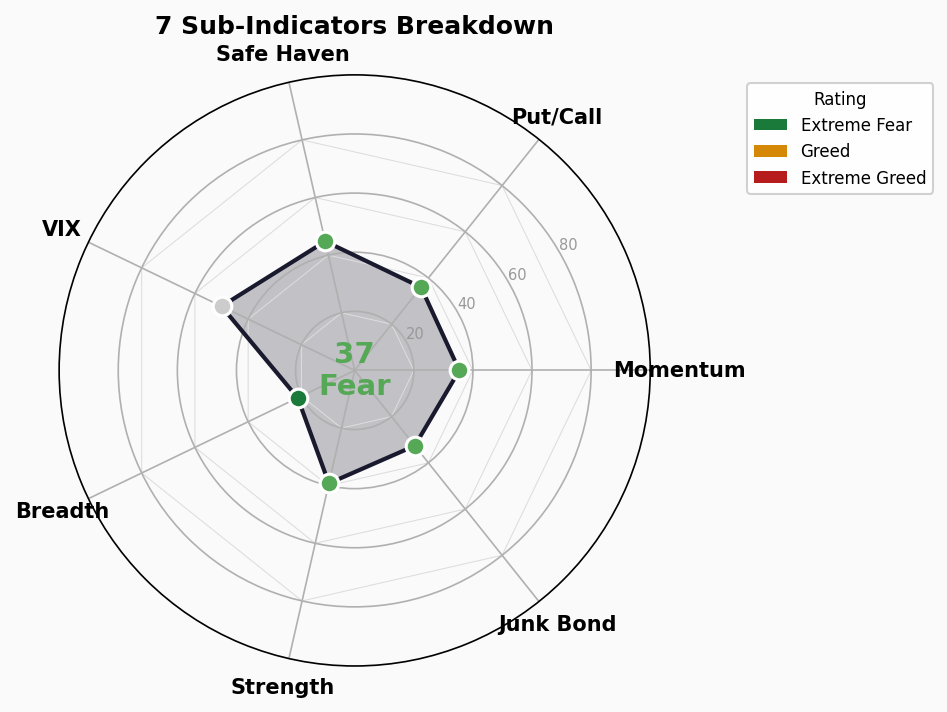
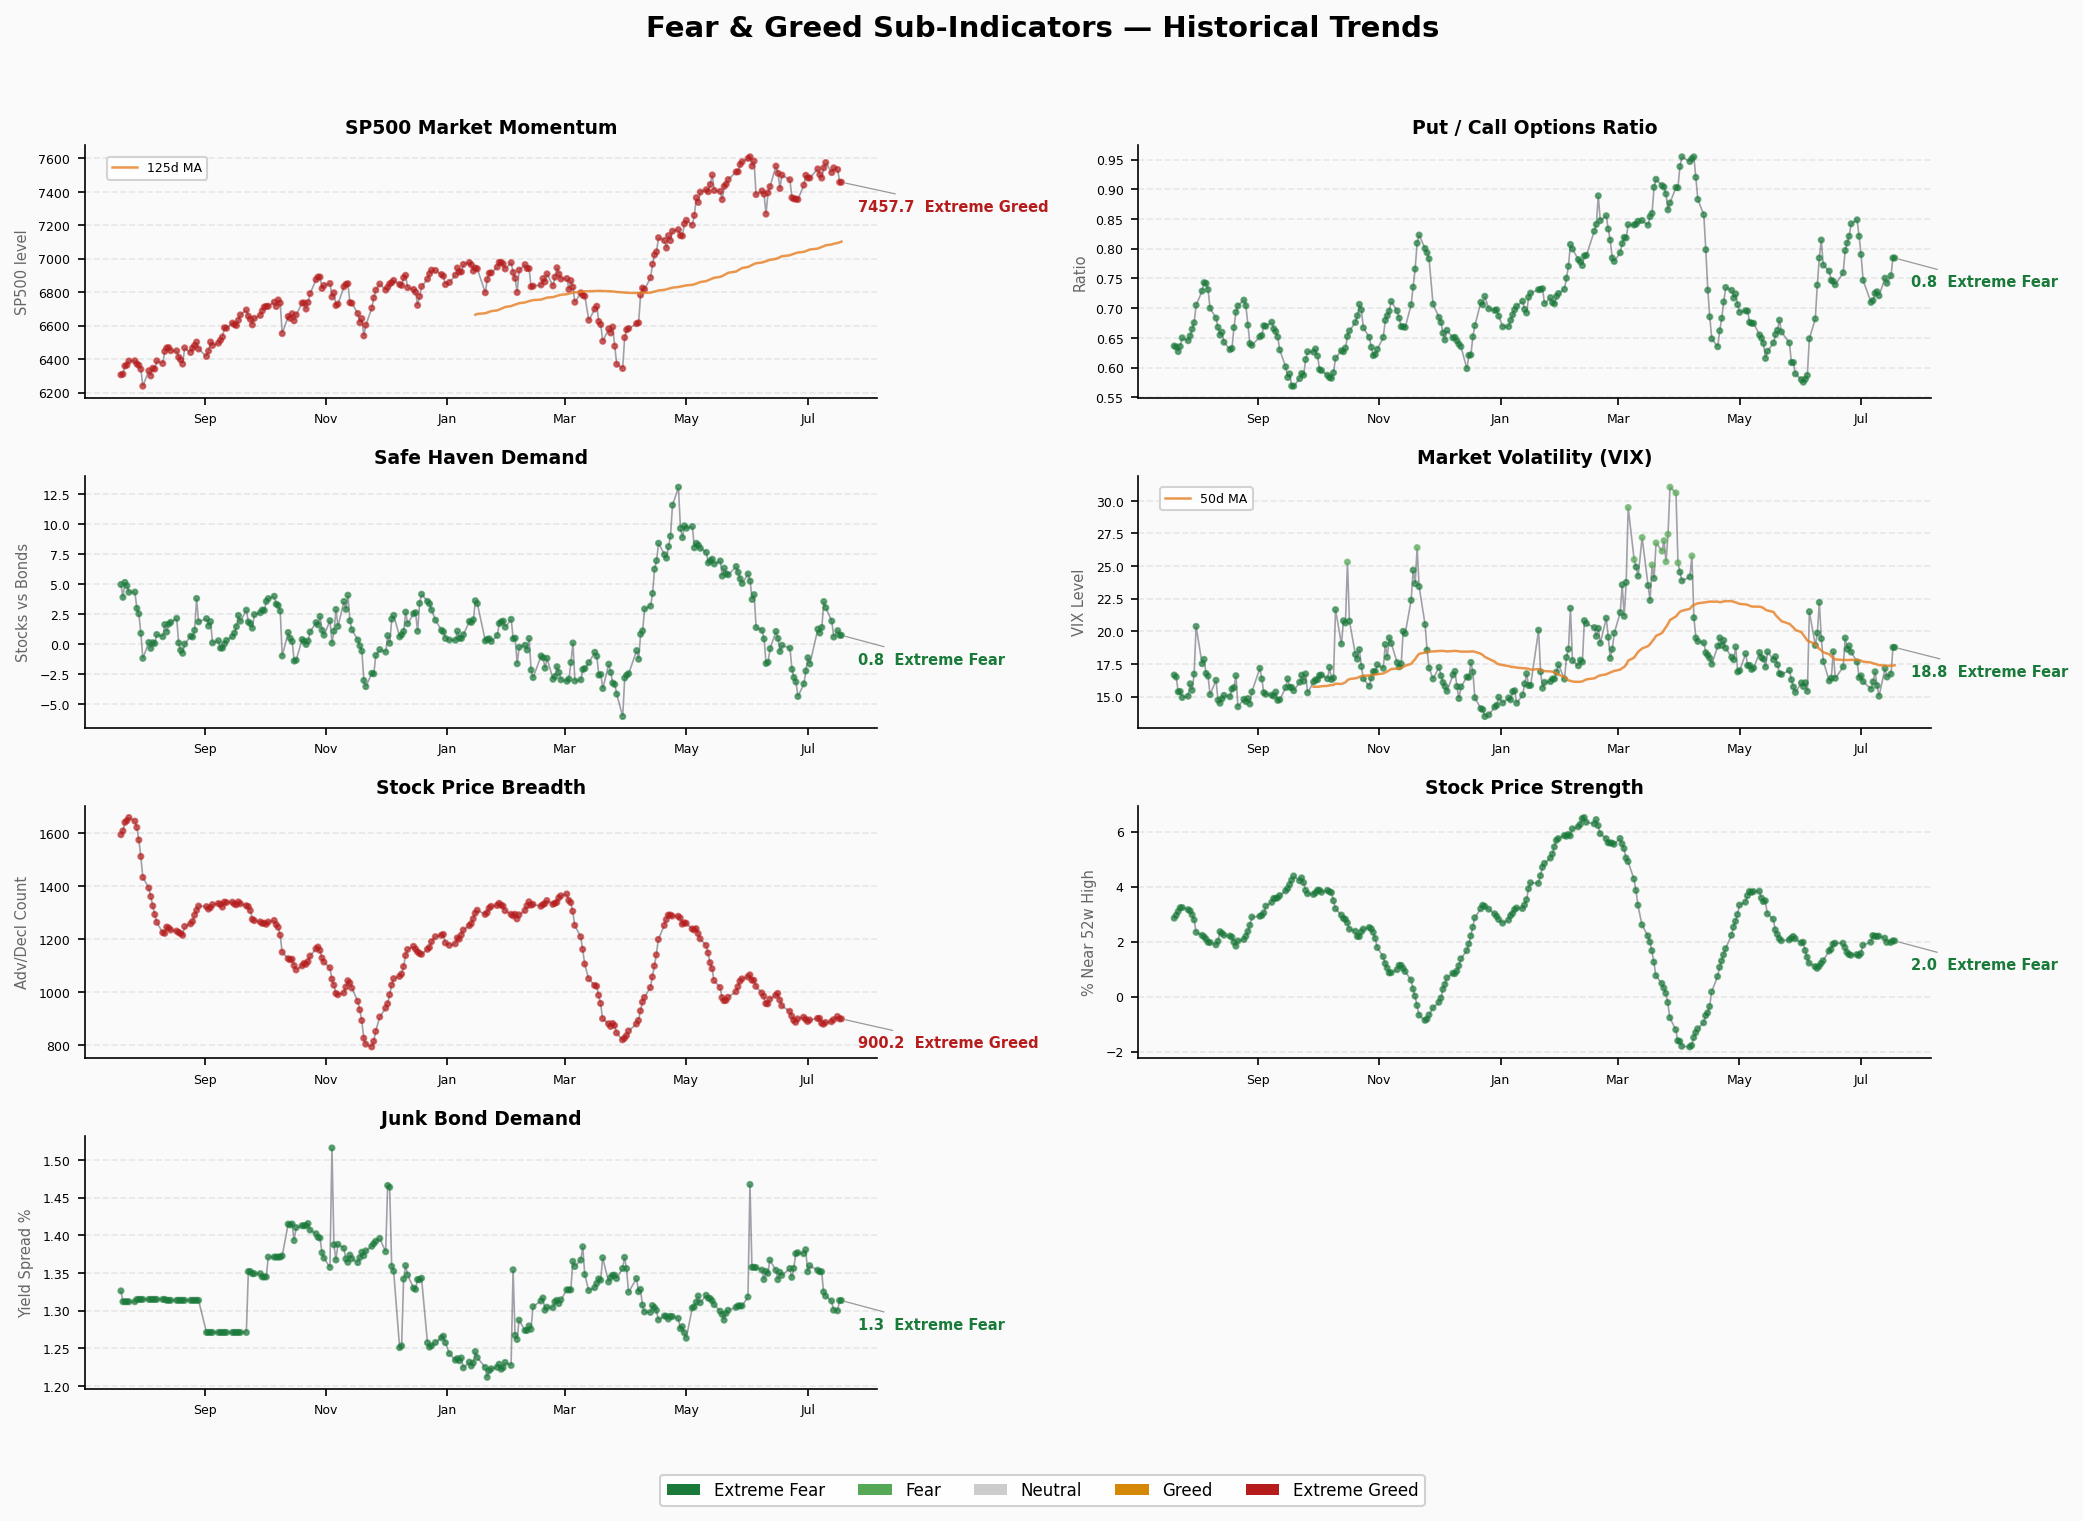
| Market Momentum (S&P 500 vs 125-day MA) | 35.4 | Fear | S&P 7457.69 | Weakening |
| Stock Price Strength (52-wk highs vs lows) | 39.2 | Fear | 2.03 | Weakening |
| Stock Price Breadth (McClellan Oscillator) | 21.4 | Extreme Fear | 900.15 | Deteriorating |
| Put/Call Ratio | 36.0 | Fear | 0.78 | Bearish tilt |
| Junk Bond Demand (Spread) | 32.6 | Fear | 1.31% | Widening |
| Market Volatility (VIX) | 50.0 | Neutral | 18.77 | Stable |
| Safe Haven Demand (Stocks vs Treasuries) | 44.8 | Fear | 0.76 | Rotating to bonds |
Interpretation
Market Momentum (35.4 / Fear): S&P 500 at 7457.69, still above the 125-day moving average but the premium is narrowing sharply. After months of Extreme Greed readings, the return to Fear signals that index-level momentum has meaningfully eroded.
Stock Price Strength (39.2 / Fear): 52-week highs to lows ratio at 2.03—new highs still outnumber new lows but the margin has thinned considerably. The steady decline from Extreme Greed levels reflects deteriorating individual stock momentum.
Market Breadth (21.4 / Extreme Fear): The only sub-indicator in Extreme Fear territory. The McClellan Oscillator at 900.15 reveals that advancing vs declining volume is narrowing dramatically. This is the most concerning signal—breadth often leads price, deteriorating well before the index breaks down.
Put/Call Ratio (36.0 / Fear): At 0.78, put volume is rising relative to calls, indicating an options market tilting defensive.
Junk Bond Demand (32.6 / Fear): High-yield spreads widening to 1.31% as credit markets begin pricing in higher risk premiums.
VIX (50.0 / Neutral): VIX at 18.77, within historical norms. The only neutral reading across all indicators. However, if FNG continues to slide, VIX could pivot to Fear rapidly—this lag pattern was also observed during the October 2025 pullback.
Safe Haven Demand (44.8 / Fear): Stocks are losing relative appeal vs Treasuries, with clear rotation from equities to bonds.
⚠️ Structural Divergence Analysis
Extreme Readings
- Market Breadth 21.4 (Extreme Fear): The lone indicator in extreme territory. Breadth is typically a leading indicator—it deteriorates before the index itself breaks down. The S&P 500 is still above 7450, but breadth is already flashing a warning about internal market health.
Divergence Signals
VIX vs FNG Divergence: VIX remains at Neutral (50.0) while the FNG composite has fallen to 37.06. This “fear first, volatility later” pattern was also observed during the October 2025 correction. If markets continue to weaken, expect VIX to catch up quickly.
Elevated Index vs Depressed Sentiment: S&P 500 near all-time highs (~7457) but FNG deep in Fear territory. This “high prices, low conviction” divergence typically signals that market participants lack confidence in current valuations.
Rating Distribution
- Extreme Greed: 0
- Greed: 0
- Neutral: 1 (VIX)
- Fear: 5
- Extreme Fear: 1 (Market Breadth)
All seven sub-indicators are at Neutral or below. Not a single greed signal. This is the most bearish distribution pattern in recent months.
📈 Trend Outlook
Duration in Current Zone
- Fear zone (25-44): ~9 consecutive sessions
- Prior Neutral zone: ~20 sessions
- At current decline rate (-2 to 4 pts/day), Extreme Fear threshold could be reached in 3-5 sessions
Key Reversal Signals to Watch
- Critical support: FNG at 30. A breach below typically signals systemic selling pressure
- Reversal trigger: At least two consecutive days of FNG recovery plus breadth exiting Extreme Fear
- VIX above 22: Would confirm volatility signal convergence with sentiment
Scenario Analysis
- Base Case (60%): FNG oscillates in the 30-40 range as the market digests prior gains; no systemic risk
- Bearish Case (30%): Breadth continues to deteriorate, dragging FNG below 30 and triggering broader profit-taking
- Rebound Case (10%): Earnings season surprises to the upside, repairing sentiment and pushing FNG back above 45 (Neutral)
🚨 Crisis Precursor Dashboard
1. Credit Spreads
- High-Yield OAS: 2.71% (7/16) | 🟢 Normal
- Thresholds: <3% Normal | 3-5% Caution | 5-8% Panic | >8% Crisis
- Investment-Grade OAS: 0.78% (7/16) | 🟢 Normal
- Thresholds: <1% Normal | 1-2% Caution | >2% Panic
- Trend: Credit spreads remain at historically low levels with zero stress signals. HY OAS at 2.71% is well within healthy range, a stark contrast to the sharp widening seen during the November 2025 Extreme Fear episode.
2. Yield Curve
- 10Y-2Y Spread: +37bp | 🟡 Flat
- Thresholds: >50bp Normal | 0-50bp Flat | <0 Inverted
- 10Y: 4.57% | 2Y: 4.16% | 30Y: 5.09%
- Trend: The curve is positive but flat. The 10Y-2Y spread at 37bp is on the low end of normal. Notably, the 10Y-30Y remains inverted at -52bp (30Y 5.09% > 10Y 4.57%), reflecting elevated inflation expectations and term premium.
3. Margin Debt
- FINRA Margin Debt: $1.304T (Apr 2026) | 🔴 Record Territory
- Trend: Margin debt near all-time highs. Elevated margin alone is not a sell signal, but it amplifies downside risk—forced liquidations during a downturn can accelerate declines. This is currently the most concerning systemic risk indicator.
4. IPO Market
- 2026 YTD IPOs: ~73 (Renaissance Capital) | 🟡 Active
- Trend: IPO activity remains healthy but well below 2021 bubble levels. The market remains open to new issuance—a neutral-to-positive signal.
5. Fund Flows
- 2026 YTD ETF Net Inflows: ~$856B | 🔴 Record Pace
- Trend: ETF inflows at all-time highs, partly reflecting secular passive investing trends but also hinting at FOMO dynamics. Historically, peak ETF inflow readings have coincided with intermediate market tops.
Composite Assessment
| Indicator | Status |
|---|---|
| Credit Spreads (HY OAS) | 🟢 Normal |
| Credit Spreads (IG OAS) | 🟢 Normal |
| Yield Curve (10Y-2Y) | 🟡 Flat |
| Margin Debt | 🔴 Record High |
| IPO Activity | 🟡 Active |
| ETF Inflows | 🔴 Record Pace |
Overall: 2 🟢 / 2 🟡 / 2 🔴
The crisis precursor dashboard presents a divided picture: credit markets and the yield curve are not flashing warning signals, but extreme readings in fund flows (margin debt + ETF inflows) are converging with the FNG sentiment decline. This is not a “market about to crash” signal set, but it does point to an environment where reducing risk exposure is warranted.