CNN Fear & Greed Analysis 2026-07-19
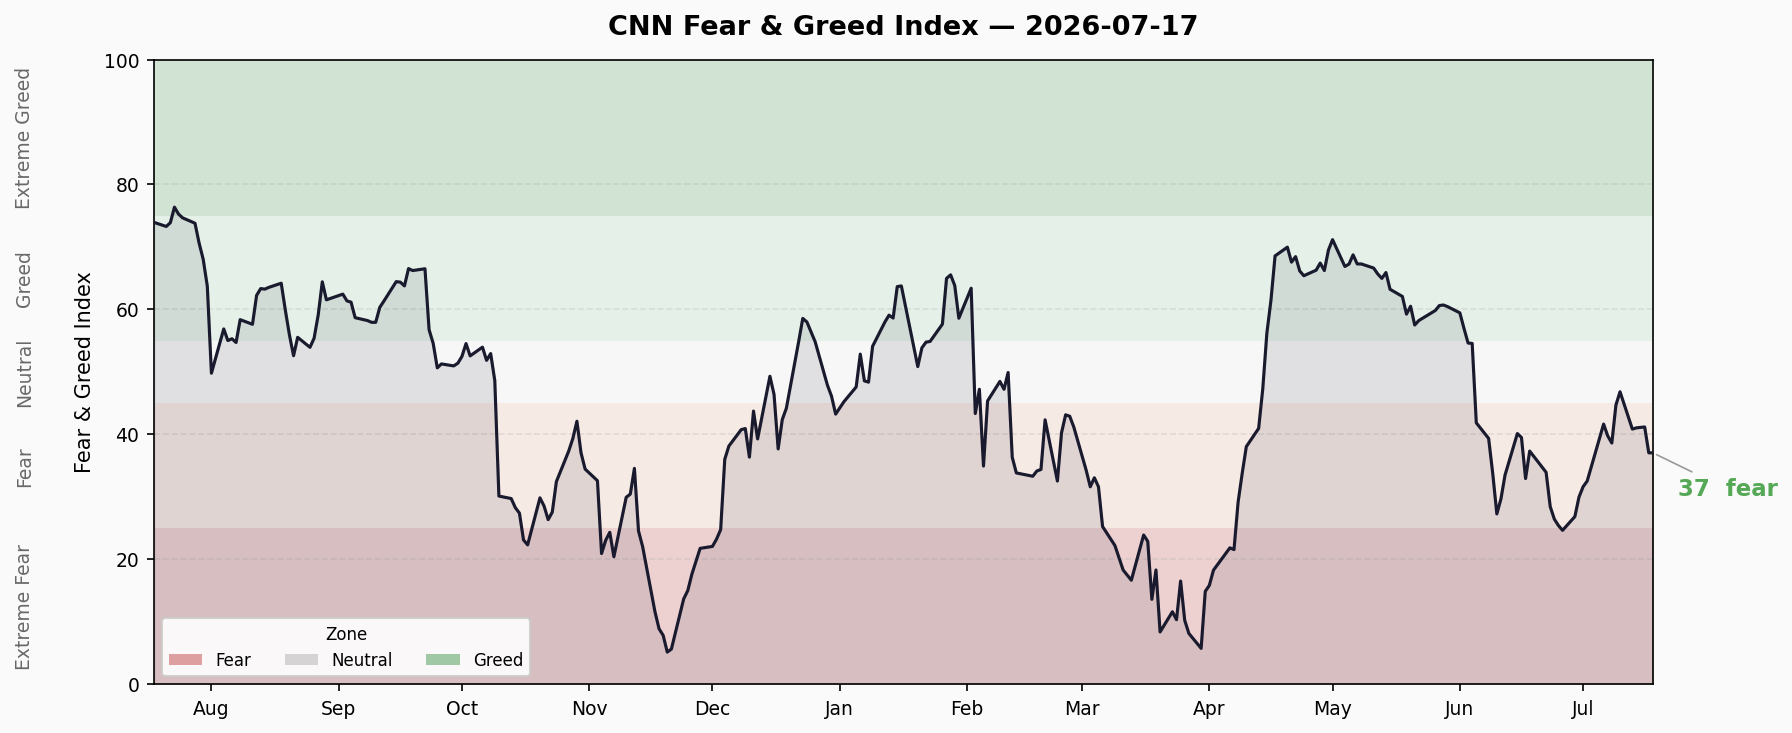
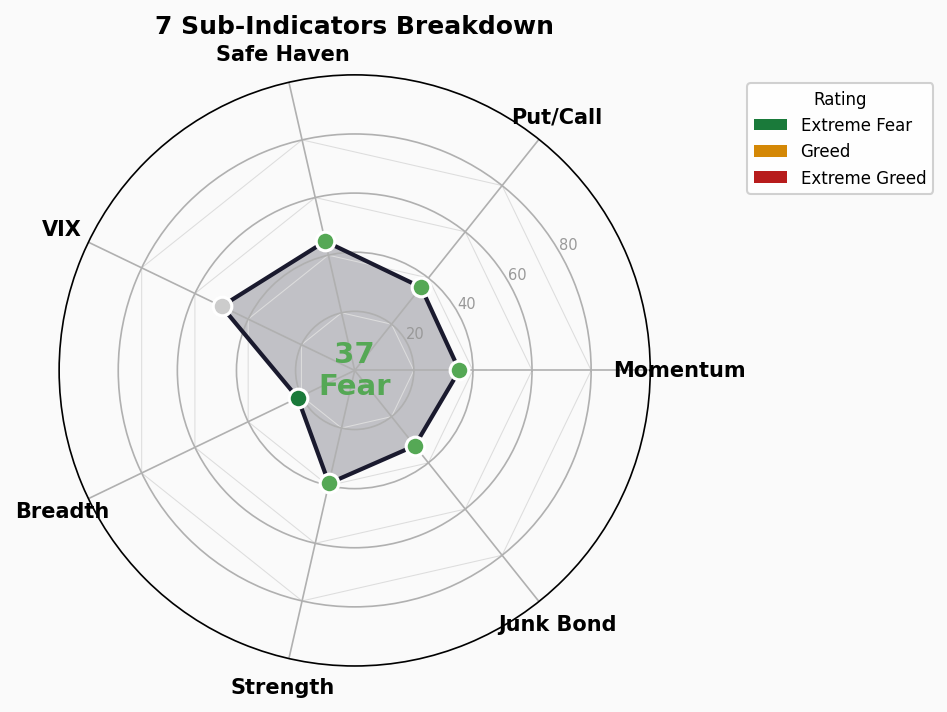
CNN Fear & Greed Index at 37.06, in Fear territory. Down 4.63 points from prior close of 41.69, marking the 5th consecutive session in Fear. Among 7 sub-indicators: 1 Extreme Fear, 5 Fear, 1 Neutral. Crisis signals: credit spreads normal, yield curve normal/flat, margin debt at all-time high (🔴), ETF inflows at record (🔴). Overall: 2🟢 0🟡 2🔴.
📊 Composite Index Trend
| Metric | Value |
|---|---|
| Latest | 37.06 / 100 |
| Rating | 😨 Fear |
| Prior Close | 41.69 |
| Daily Change | ⬇️ -4.63 |
| 1 Week Ago | 46.83 (Neutral) |
| Weekly Change | ⬇️ -9.77 |
| 1 Month Ago | 32.94 (Fear) |
| Monthly Change | ⬆️ +4.12 |
| 1 Year Ago | 74.17 (Greed) |
| Yearly Change | ⬇️ -37.11 |
10-Day Trend: ⬇️ Declining
| Date | Score | Rating |
|---|---|---|
| 07/06 | 41.7 | Fear |
| 07/07 | 39.8 | Fear |
| 07/08 | 38.6 | Fear |
| 07/09 | 44.7 | Fear |
| 07/10 | 46.8 | Neutral |
| 07/13 | 40.9 | Fear |
| 07/14 | 41.1 | Fear |
| 07/15 | 41.2 | Fear |
| 07/17 | 37.1 | Fear |
Pattern: Brief bounce to Neutral on 7/10 followed by rapid retreat. Three consecutive daily declines totaling -9.7 points. Downtrend since 7/6 remains intact.
🔍 Sub-Indicator Breakdown
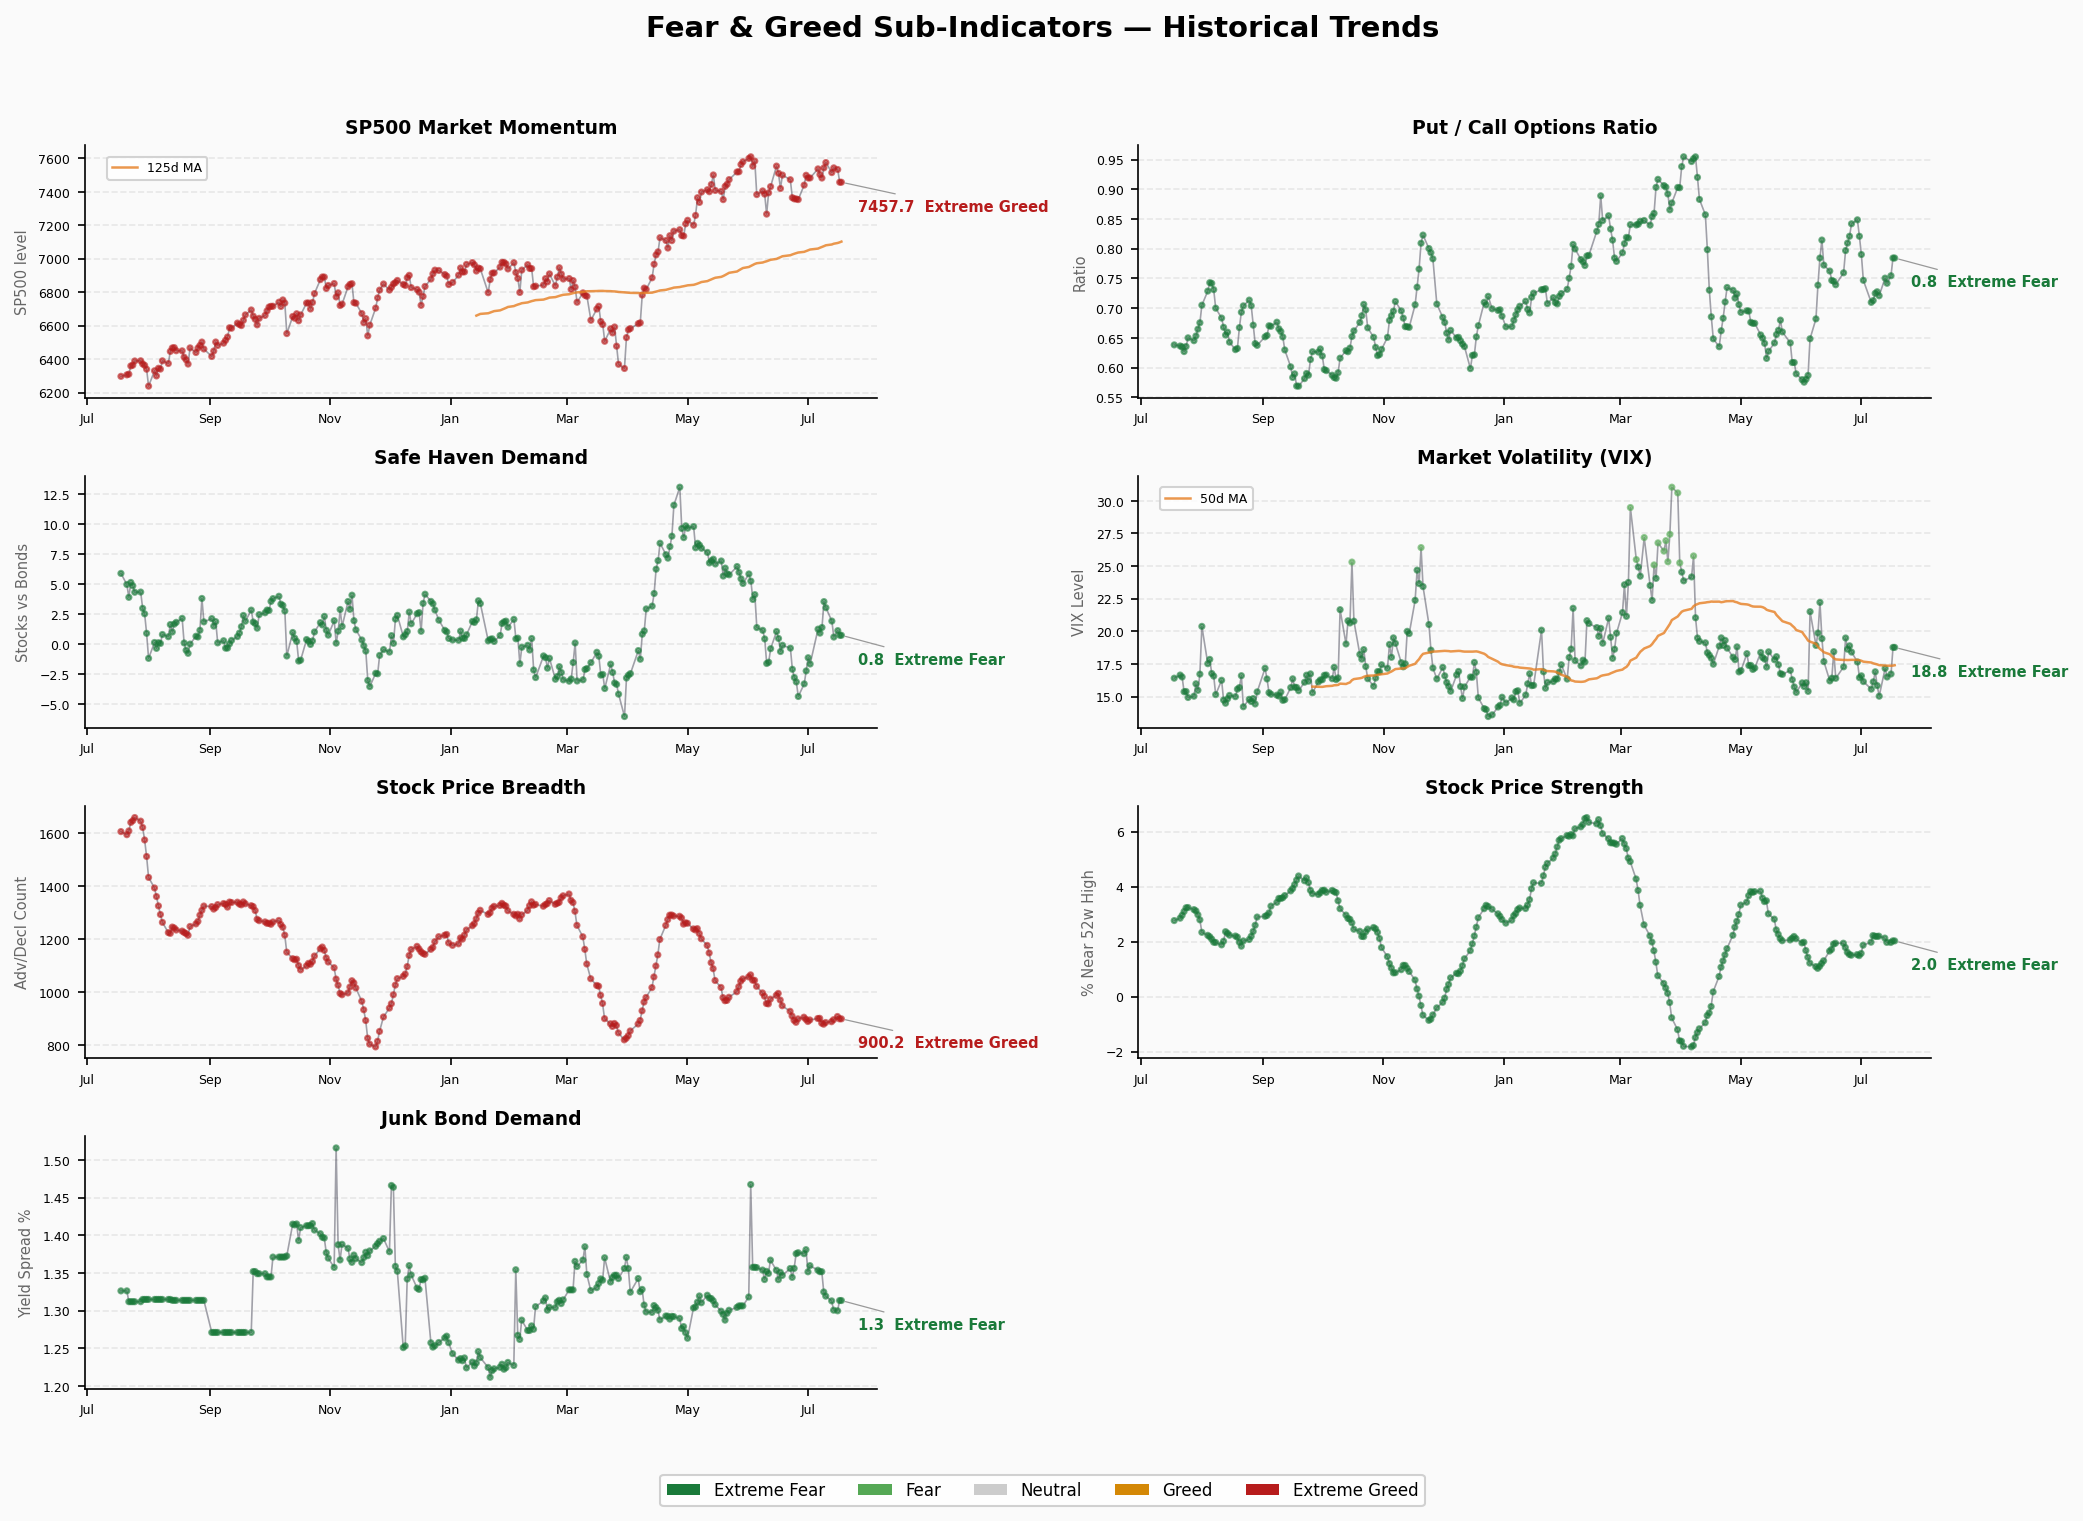
1. Stock Price Strength — 39.2 😨 Fear
- What it measures: Ratio of NYSE stocks at 52-week highs vs lows
- Raw value: 2.03% (extremely low new-high/new-low ratio)
- Change: +0.06pp (flat)
- Interpretation: Only 2% of stocks are making 52-week highs. Breadth is extremely narrow — classic defensive market where capital concentrates in a handful of mega-caps.
2. Stock Price Breadth — 21.4 😱 Extreme Fear
- What it measures: McClellan Volume Summation Index
- Raw value: 900.15
- Change: -8.82 (⬇️ declining)
- Interpretation: Weakest sub-indicator. Although absolute value remains positive, the sharp retreat and CNN’s Extreme Fear rating signal accelerating downside momentum with deteriorating volume breadth.
3. Market Momentum — 35.4 😨 Fear
- What it measures: S&P 500 deviation from its 125-day moving average
- Raw value: S&P 500 @ 7,457.69
- Change: -76.08 (⬇️ significant decline)
- Interpretation: S&P 500 sliding from 7,500+ to 7,457, breaching near-term support. Despite positive YTD returns, momentum has clearly faded.
4. Put/Call Options — 36 😨 Fear
- What it measures: Put-to-call volume ratio in options markets
- Raw value: 0.78
- Change: +0.03 (⬆️ more bearish)
- Interpretation: Rising put/call ratio signals increased hedging activity. At 0.78, not extreme but directionally defensive.
5. Market Volatility — 50 😐 Neutral
- What it measures: CBOE VIX volatility index
- Raw value: VIX @ 18.77
- Change: +2.04 (⬆️ volatility rising)
- Interpretation: VIX jumped from 16.73 to 18.77, a 12% single-day spike. Still in the sub-20 neutral zone, but rapid ascent bears watching. Spot VIX now above its 50-day average of 17.37.
6. Junk Bond Demand — 32.6 😨 Fear
- What it measures: Yield spread between high-yield and investment-grade bonds
- Raw value: 1.31% spread
- Change: +0.01pp (slightly wider)
- Interpretation: Spreads remain low but the Fear rating suggests marginal retreat in credit risk appetite relative to historical norms.
7. Safe Haven Demand — 44.8 😨 Fear
- What it measures: Excess return of stocks vs Treasuries
- Raw value: 0.76%
- Change: -0.39pp (⬇️ lower safe haven demand)
- Interpretation: Stock excess return over Treasuries narrowed, suggesting modest rotation back into equities. The only sub-indicator showing marginal improvement this week, though still in Fear territory.
🔬 Structural Contradictions
Extreme Readings (>80 or <20)
- Stock Price Breadth @ 21.4 — approaching Extreme Fear threshold (<20), the most vulnerable component
- No indicators in Extreme Greed territory
Divergence Signals
- VIX vs Other Indicators: VIX scores 50 (Neutral) while 5 of 7 indicators show Fear and 1 shows Extreme Fear. VIX has yet to fully price in internal market deterioration. If VIX catches up to 22+, FNG could slide further into Extreme Fear.
- Safe Haven Marginal Improvement: Declining safe haven demand contradicts the broader FNG slide — may indicate selective dip-buying, but insufficient to reverse overall sentiment.
Core Contradiction
This is not a broad panic — it’s selective defense. Breadth is at Extreme Fear but volatility hasn’t exploded (VIX neutral), and junk bond spreads haven’t widened. A classic “rolling bear”: index-level damage appears contained, but internal structure is steadily deteriorating.
📈 Trend Assessment
- Current zone: Fear (25-44), 5 consecutive sessions
- Prior zone: Neutral (45-54), briefly touched on 7/10 before retreating
- Key levels: Below 30 = lower Fear zone; below 25 = Extreme Fear trigger
- Reversal signals to watch: VIX breaking 22, Put/Call rising above 0.85, Breadth falling below 800
Directional bias: ⬇️ Leaning lower. Momentum, breadth, and options — three core indicators — are deteriorating in sync. VIX is accelerating upward. Probability of returning to Neutral in the near term is low. Watch Monday’s open for stabilization signals.
🚨 Crisis Precursor Dashboard
1. Credit Spreads
| Indicator | Value | Status | Thresholds |
|---|---|---|---|
| HY OAS | 2.71% | 🟢 Normal/Greed | <3% Normal | 3-5% Caution | 5-8% Panic | >8% Crisis |
| IG OAS | 0.78% | 🟢 Normal | <1% Normal | 1-2% Caution | >2% Panic |
- Data as of: 2026-07-16 (FRED)
- Trend: HY OAS at 2.71%, below the 3% caution threshold. Credit markets are not pricing recession risk.
- Interpretation: Credit spreads are among the most reliable leading indicators of market crashes. Both spreads are in safe territory — the bond market sees no systemic risk. This is the most positive signal currently.
2. Yield Curve
| Indicator | Value | Status |
|---|---|---|
| 10Y-2Y Spread | +37bp | 🟢 Normal/Flat |
| 10Y Yield | 4.57% | — |
| 2Y Yield | 4.16% | — |
| 30Y Yield | 5.09% | — |
| 10Y-30Y Spread | -52bp | Inverted (long-end higher, normal shape) |
- Data as of: 2026-07-16 (FRED)
- Interpretation: 10Y-2Y spread at +37bp, ending prolonged inversion and returning to positive slope, though still flat. Historically, yield curve normalization from inversion often precedes recession (driven by rate-cut expectations pulling down the short end). However, the 2Y at 4.16% remains elevated, suggesting the Fed has not cut aggressively. The flat curve prices a “soft landing” scenario.
3. Margin Debt
| Indicator | Value | Status |
|---|---|---|
| FINRA Margin Debt | ~$1.304T (Apr 2026) | 🔴 All-Time High Territory |
- Frequency: FINRA monthly release (1-2 month lag)
- Interpretation: Margin debt at absolute all-time highs. Elevated leverage means any significant pullback will trigger cascading margin calls that amplify downside. Classic “late-cycle fuel” — not the cause of a crash, but the accelerant.
4. IPO Market
| Indicator | Value | Status |
|---|---|---|
| 2026 YTD IPO Count | ~73 (Renaissance Capital) | 🟡 Moderately Active |
| 2025 Full-Year Reference | ~150 | — |
- Interpretation: IPO pace is moderate, nothing like the frothy issuance wave of 2021. Not a warning signal.
5. Fund Flows
| Indicator | Value | Status |
|---|---|---|
| 2026 YTD ETF Net Inflows | ~$856B | 🔴 Record |
- Interpretation: ETF inflows at an all-time record, reflecting FOMO-style chasing by both retail and institutional investors. Historically, record inflows tend to occur in late-cycle bull markets. Inflows alone are not a sell signal, but combined with record margin debt, they indicate high participation and crowded positioning — the exit could be as violent as the entrance.
Overall Assessment
| Category | Count |
|---|---|
| 🟢 Normal | 2 (credit spreads, yield curve) |
| 🟡 Caution | 0 |
| 🔴 Warning | 2 (margin debt, ETF inflows) |
Bottom line: Credit markets and the yield curve are not sounding alarms, but leverage and flow indicators are flashing red. This is not a “crash tomorrow” signal — it’s a warning that if a correction comes, the magnitude could be severe. The current environment resembles early 2018 or late 2021: fundamentals are still okay, but internal structure is steadily deteriorating.