CNN Fear & Greed Index Analysis 2026-07-18
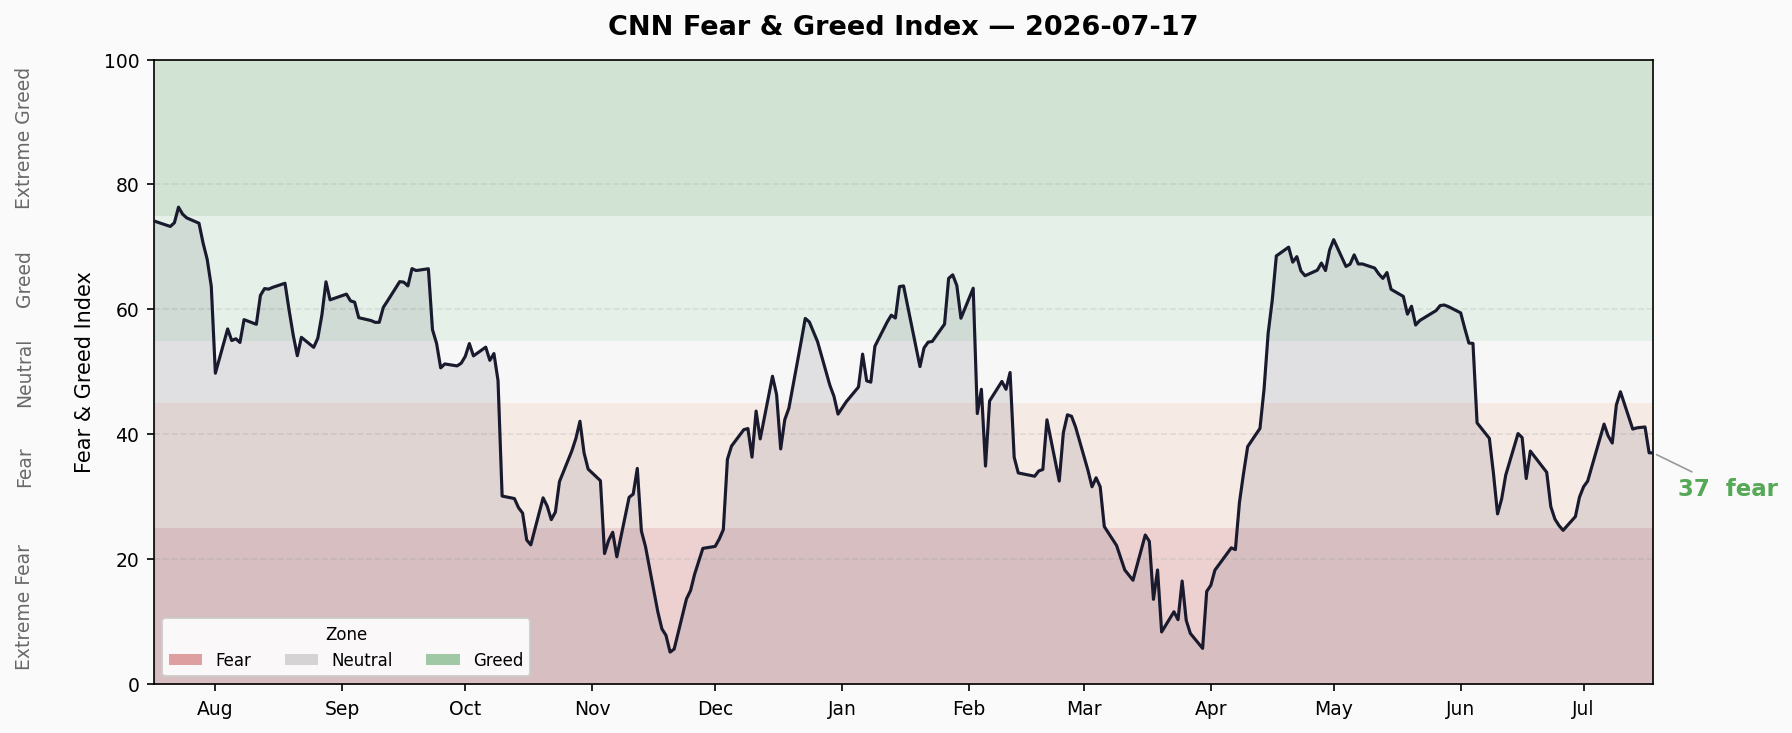
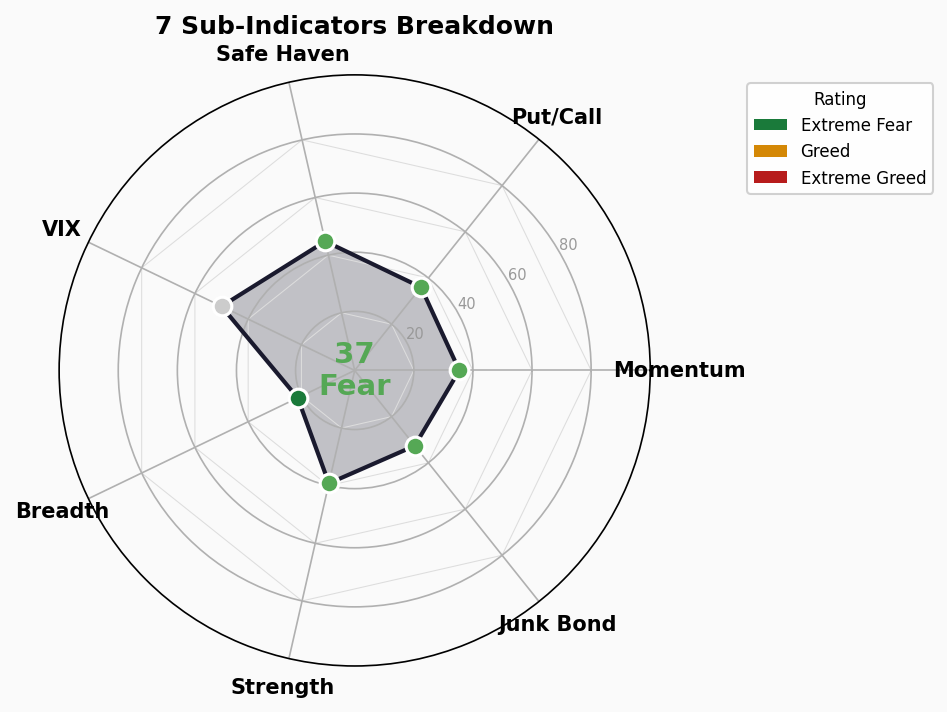
FNG Composite at 37.06 (Fear), down 4.63 from previous close of 41.69. The index has dropped 9.77 points over the past 7 days from a Neutral 46.83. Six of seven sub-indicators are in Fear or below; only VIX remains Neutral at 50.0. Stock Price Breadth has entered Extreme Fear (21.4), diverging from VIX (50.0 Neutral). Safe Haven Demand raw value plunged 33.77% in a single day. Crisis precursor dashboard: credit spreads normal (HY OAS 2.71%), yield curve normal (10Y-2Y +37bp), but margin debt at $1.304T (all-time high territory) and ETF inflows at record levels.
Composite Index Trend
| Metric | Value | Rating | Change |
|---|---|---|---|
| Composite Index | 37.06 | Fear 😨 | -4.63 from prior close ↓ |
| Previous Close | 41.69 | Fear | — |
| 1 Week Ago | 46.83 | Neutral | -9.77 ↓↓ |
| 1 Month Ago | 32.94 | Fear | +4.12 ↑ |
| 1 Year Ago | 74.17 | Greed | -37.11 ↓↓ |
Last 10-day trend: 41.7 on 7/6 → brief rebound to 46.8 (Neutral) on 7/10 → three consecutive trading days sliding to 37.1. A 9.77-point decline in 7 days with a steep slope.
Market sentiment has rapidly retreated from the Neutral boundary into mid-Fear territory without any meaningful bounce. The last time the index was at this level was around late June.
Seven Sub-Indicator Scan
1. Market Momentum — 35.4 😨 Fear
| Item | Value |
|---|---|
| S&P 500 | 7,457.69 |
| vs Prior Day | Flat |
| Trend | Down ~85 pts from ~7,540 this week |
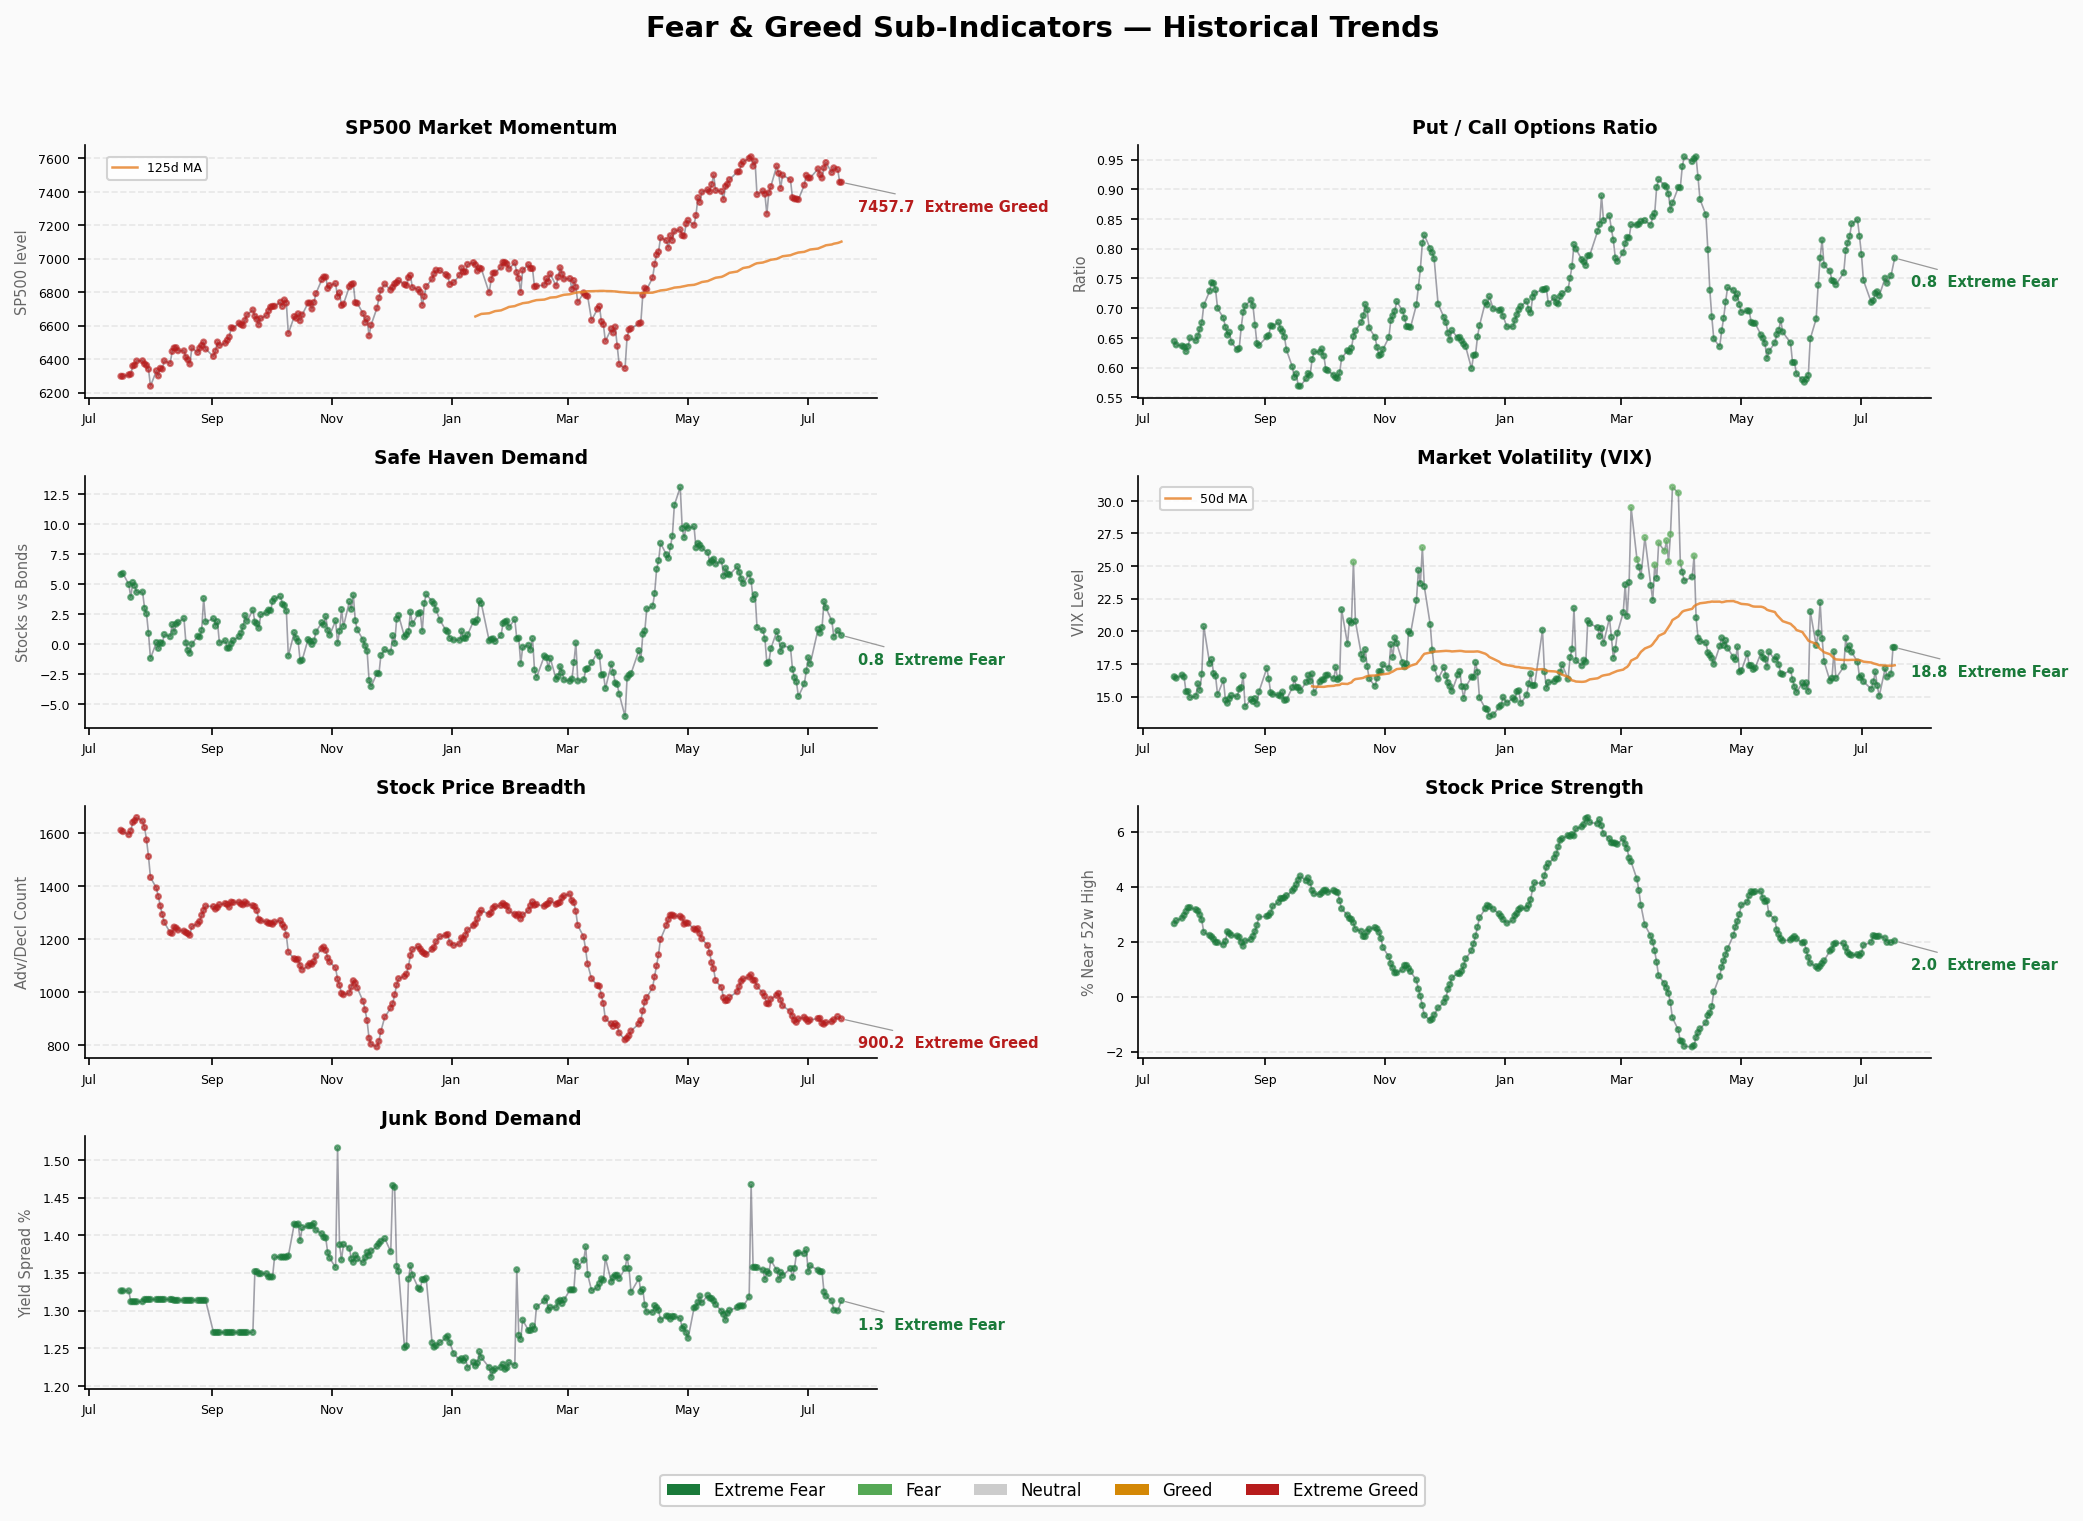
The S&P 500 pulled back modestly after hovering near highs. Momentum has not broken down technically but is weakening at the margin. Score of 35.4 sits in the lower-middle of the Fear range.
2. Stock Price Strength — 39.2 😨 Fear
| Item | Value |
|---|---|
| 52-Week High/Low Ratio | 2.03 |
| vs Prior Day | +2.92% ↑ |
The absolute ratio of 2.03 is low (only ~2x more new highs than new lows), but improved slightly intraday. At the upper end of Fear, close to the Neutral boundary.
3. Stock Price Breadth — 21.4 😱 Extreme Fear
| Item | Value |
|---|---|
| McClellan Volume Summation | 900.15 |
| vs Prior Day | -0.97% ↓ |
⚠️ The weakest of all seven indicators. Score of 21.4 is firmly in Extreme Fear territory. While the McClellan Index absolute reading remains high (900+), the marginal deterioration and the F&G model’s extremely low score indicate significantly narrowing market participation.
4. Put/Call Options — 36.0 😨 Fear
| Item | Value |
|---|---|
| Ratio | 0.78 |
| vs Prior Day | +3.95% ↑ (more bearish) |
Rising put/call ratio suggests more traders are buying puts for hedging. At 0.78, still in a normal-to-elevated range, but the consecutive rise warrants attention.
5. Market Volatility (VIX) — 50.0 😐 Neutral
| Item | Value |
|---|---|
| VIX | 18.77 |
| vs Prior Day | Flat |
The only Neutral indicator among the seven. VIX at 18.77 is historically normal-to-low, indicating the options market has not priced in panic. This is the most important “tranquilizer” in the current sentiment structure — but if VIX begins to rise, the entire FNG index could accelerate downward.
6. Junk Bond Demand — 32.6 😨 Fear
| Item | Value |
|---|---|
| Credit Spread | 1.31% |
| vs Prior Day | +1.05% ↑ (spread widening) |
The spread between junk and investment-grade bonds widened slightly to 1.31%, scoring 32.6 in Fear territory. However, the absolute spread of 1.31% remains well within healthy range, far from panic levels.
7. Safe Haven Demand — 44.8 😨 Fear
| Item | Value |
|---|---|
| Stock/Bond Relative Performance | 0.76 |
| vs Prior Day | -33.77% ↓↓ |
🆘 Largest single-day change among all indicators. The raw ratio plunged from 1.15 to 0.76, a 33.77% drop. This typically signals a sharp deterioration in stocks relative to bonds — a classic Risk-Off signal. Score of 44.8 is at the upper boundary of Fear, just 0.2 points from Neutral, suggesting this indicator may trigger further deterioration in the coming days.
Structural Contradiction Analysis
⚠️ Extreme Value Alerts
- Stock Price Breadth at 21.4 (Extreme Fear): The only indicator in Extreme Fear, signaling sharply narrowing market participation. Classic “index high but few stocks holding it up” pattern.
🔄 Divergence Signals
- Breadth vs VIX Divergence: Breadth is in Extreme Fear (21.4) while VIX remains calmly Neutral (50.0). If VIX catches up and confirms Breadth’s forward-looking signal, FNG could accelerate downward.
- Safe Haven Demand Crash vs Elevated Score: The raw ratio plunged 33.77% in one day, but the score at 44.8 is still near Neutral. This means the speed of deterioration is outpacing the scoring model’s responsiveness — likely a drag on the composite in the coming days.
- Momentum vs Breadth Split: The S&P 500 is down only modestly (-1.1%), yet breadth is in extreme deterioration. Classic pattern of mega-caps holding up the index while the majority of stocks weaken.
Trend Assessment
| Dimension | Assessment |
|---|---|
| Zone Duration | Fear zone for 6 weeks (since early June), with only 1 day briefly back in Neutral (7/10) |
| Direction | ↓ Downward, slope accelerating. Three consecutive declining trading days |
| Key Support | 30 (Fear/Extreme Fear boundary). A break below could trigger larger-scale panic |
| Key Resistance | 45 (Fear/Neutral boundary). Requires Breadth and Safe Haven to improve simultaneously |
| Near-term Outlook | Bearish bias. Breadth and Safe Haven deterioration speed exceeds Momentum and VIX stability |
| Medium-term Positioning | 37 is mid-to-low in historical range — neither extreme panic (contrarian buy) nor safe (hold). “Stay vigilant but don’t panic” territory |
🚨 Crisis Precursor Dashboard
1. Credit Spreads
| Indicator | Value | Status |
|---|---|---|
| High-Yield OAS | 2.71% | 🟢 Normal/Greed |
| Investment-Grade OAS | 0.78% | 🟢 Normal |
| Trend | Stable | HY OAS <3% normal range, IG OAS <1% |
Credit markets are calm. HY OAS at 2.71% is well below the 3% warning line, IG OAS at 0.78% is equally healthy. This is the most positive signal in the current macro environment — credit markets typically smell risk earlier than equities.
2. Yield Curve
| Indicator | Value | Status |
|---|---|---|
| 10Y-2Y Spread | +37bp | 🟢 Normal/Flat |
| 10Y Yield | 4.57% | — |
| 2Y Yield | 4.16% | — |
| 30Y Yield | 5.09% | — |
The curve maintains a positive slope. 10Y-2Y at +37bp is not steep but far from inversion. 10Y-30Y remains negative (-52bp), reflecting long-end structural supply/demand issues but not a recession signal.
3. Margin Debt
| Indicator | Value | Status |
|---|---|---|
| FINRA Margin Debt | $1.304T (Apr 2026) | 🔴 All-Time High Territory |
Margin debt is at historically elevated levels. High margin debt alone is not a sufficient condition for a crash, but forced liquidations can amplify declines if the market turns. Monthly updates should be monitored.
4. IPO Activity
| Indicator | Value | Status |
|---|---|---|
| 2026 YTD IPOs | ~73 (Renaissance Capital) | 🟡 Moderately Warm |
IPO pace is healthy but not overheated. Far below the 2021 bubble era (1,000+ annually). Within normal range.
5. Fund Flows
| Indicator | Value | Status |
|---|---|---|
| 2026 YTD ETF Net Inflows | $856B | 🔴 Record High |
ETF inflows are at an all-time record pace. Extreme optimism in fund flows is often a contrarian indicator — when everyone is already buying, the marginal buyer is exhausted.
Composite Assessment
| Signal | Count |
|---|---|
| 🟢 Normal | 2 (Credit Spreads ×2) |
| 🟡 Warning | 0 |
| 🔴 Risk | 2 (Margin Debt, ETF Inflows) |
2 🟢 / 0 🟡 / 2 🔴
Healthy credit markets and a normal yield curve provide a safety cushion, but extreme readings in margin debt and ETF inflows suggest market positioning may be overly crowded. Combined with the FNG index sliding from Neutral to Fear, the current environment is a contradictory mix of “credit-side safety + sentiment-side weakening + flow-side extremes.” Not a crisis eve, but vigilance is warranted.