CNN Fear & Greed Index 2026-07-17
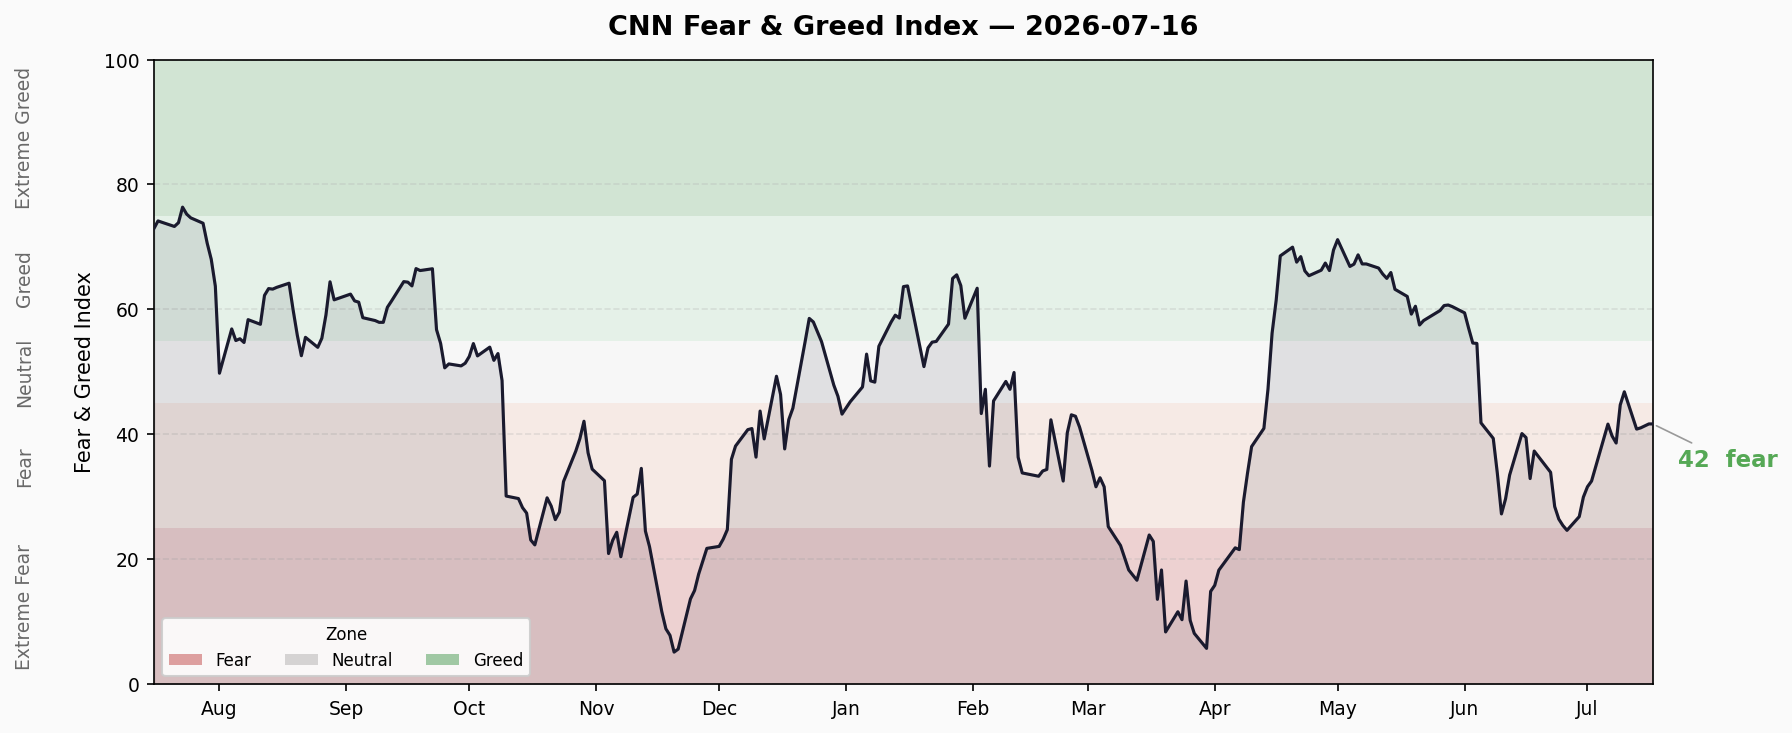
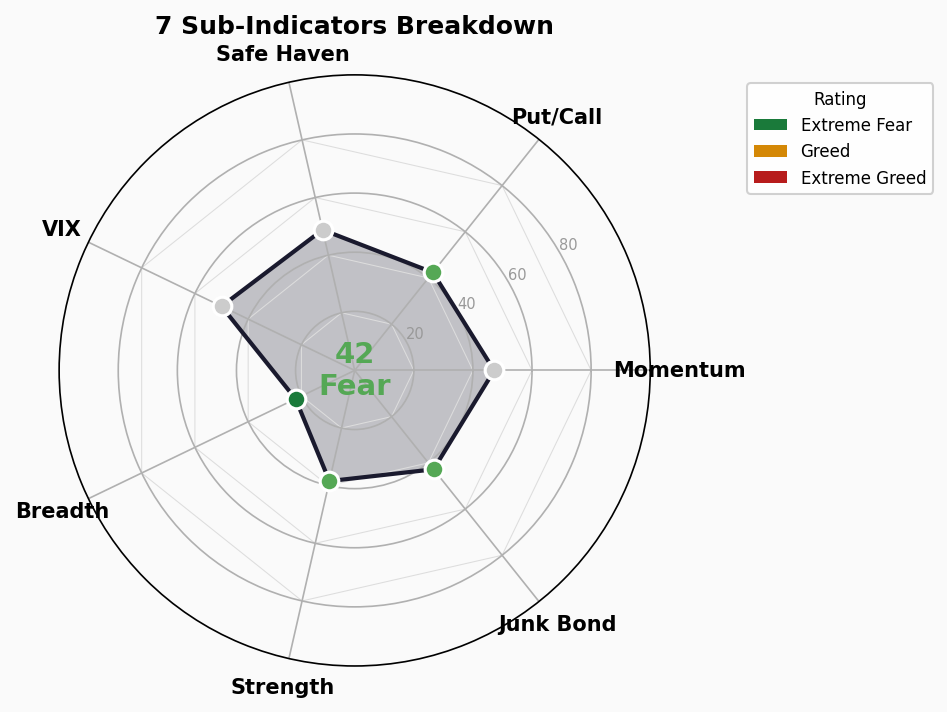
Composite 41.69 (Fear), +0.63 from prior close. 5 of 7 sub-indicators in Fear/Extreme Fear territory. Stock Price Breadth at 22.2 nears Extreme Fear, diverging sharply from Safe Haven at 48.8. Credit spreads normal, yield curve positive, but margin debt and fund flows at historic extremes.
📊 Composite Index Trend
| Metric | Value |
|---|---|
| Current Composite | 41.69 |
| Sentiment Rating | 🔶 Fear |
| Day-over-Day Change | +0.63 ↑ (prior 41.06) |
| One Week Ago | 40.86 (Fear) |
| One Month Ago | ~32.54 (Fear low) |
10-Day Trend: Recovered from July 2 low of 32.54, briefly touched Neutral (46.83) on July 10, then retreated back to Fear territory. Last three sessions: 40.86 → 41.06 → 41.69 — mild uptrend but lacking momentum.
The index has been in Fear territory for roughly two weeks, a mid-term fearful regime without the strength to break into Neutral.
🔬 Sub-Indicator Scan
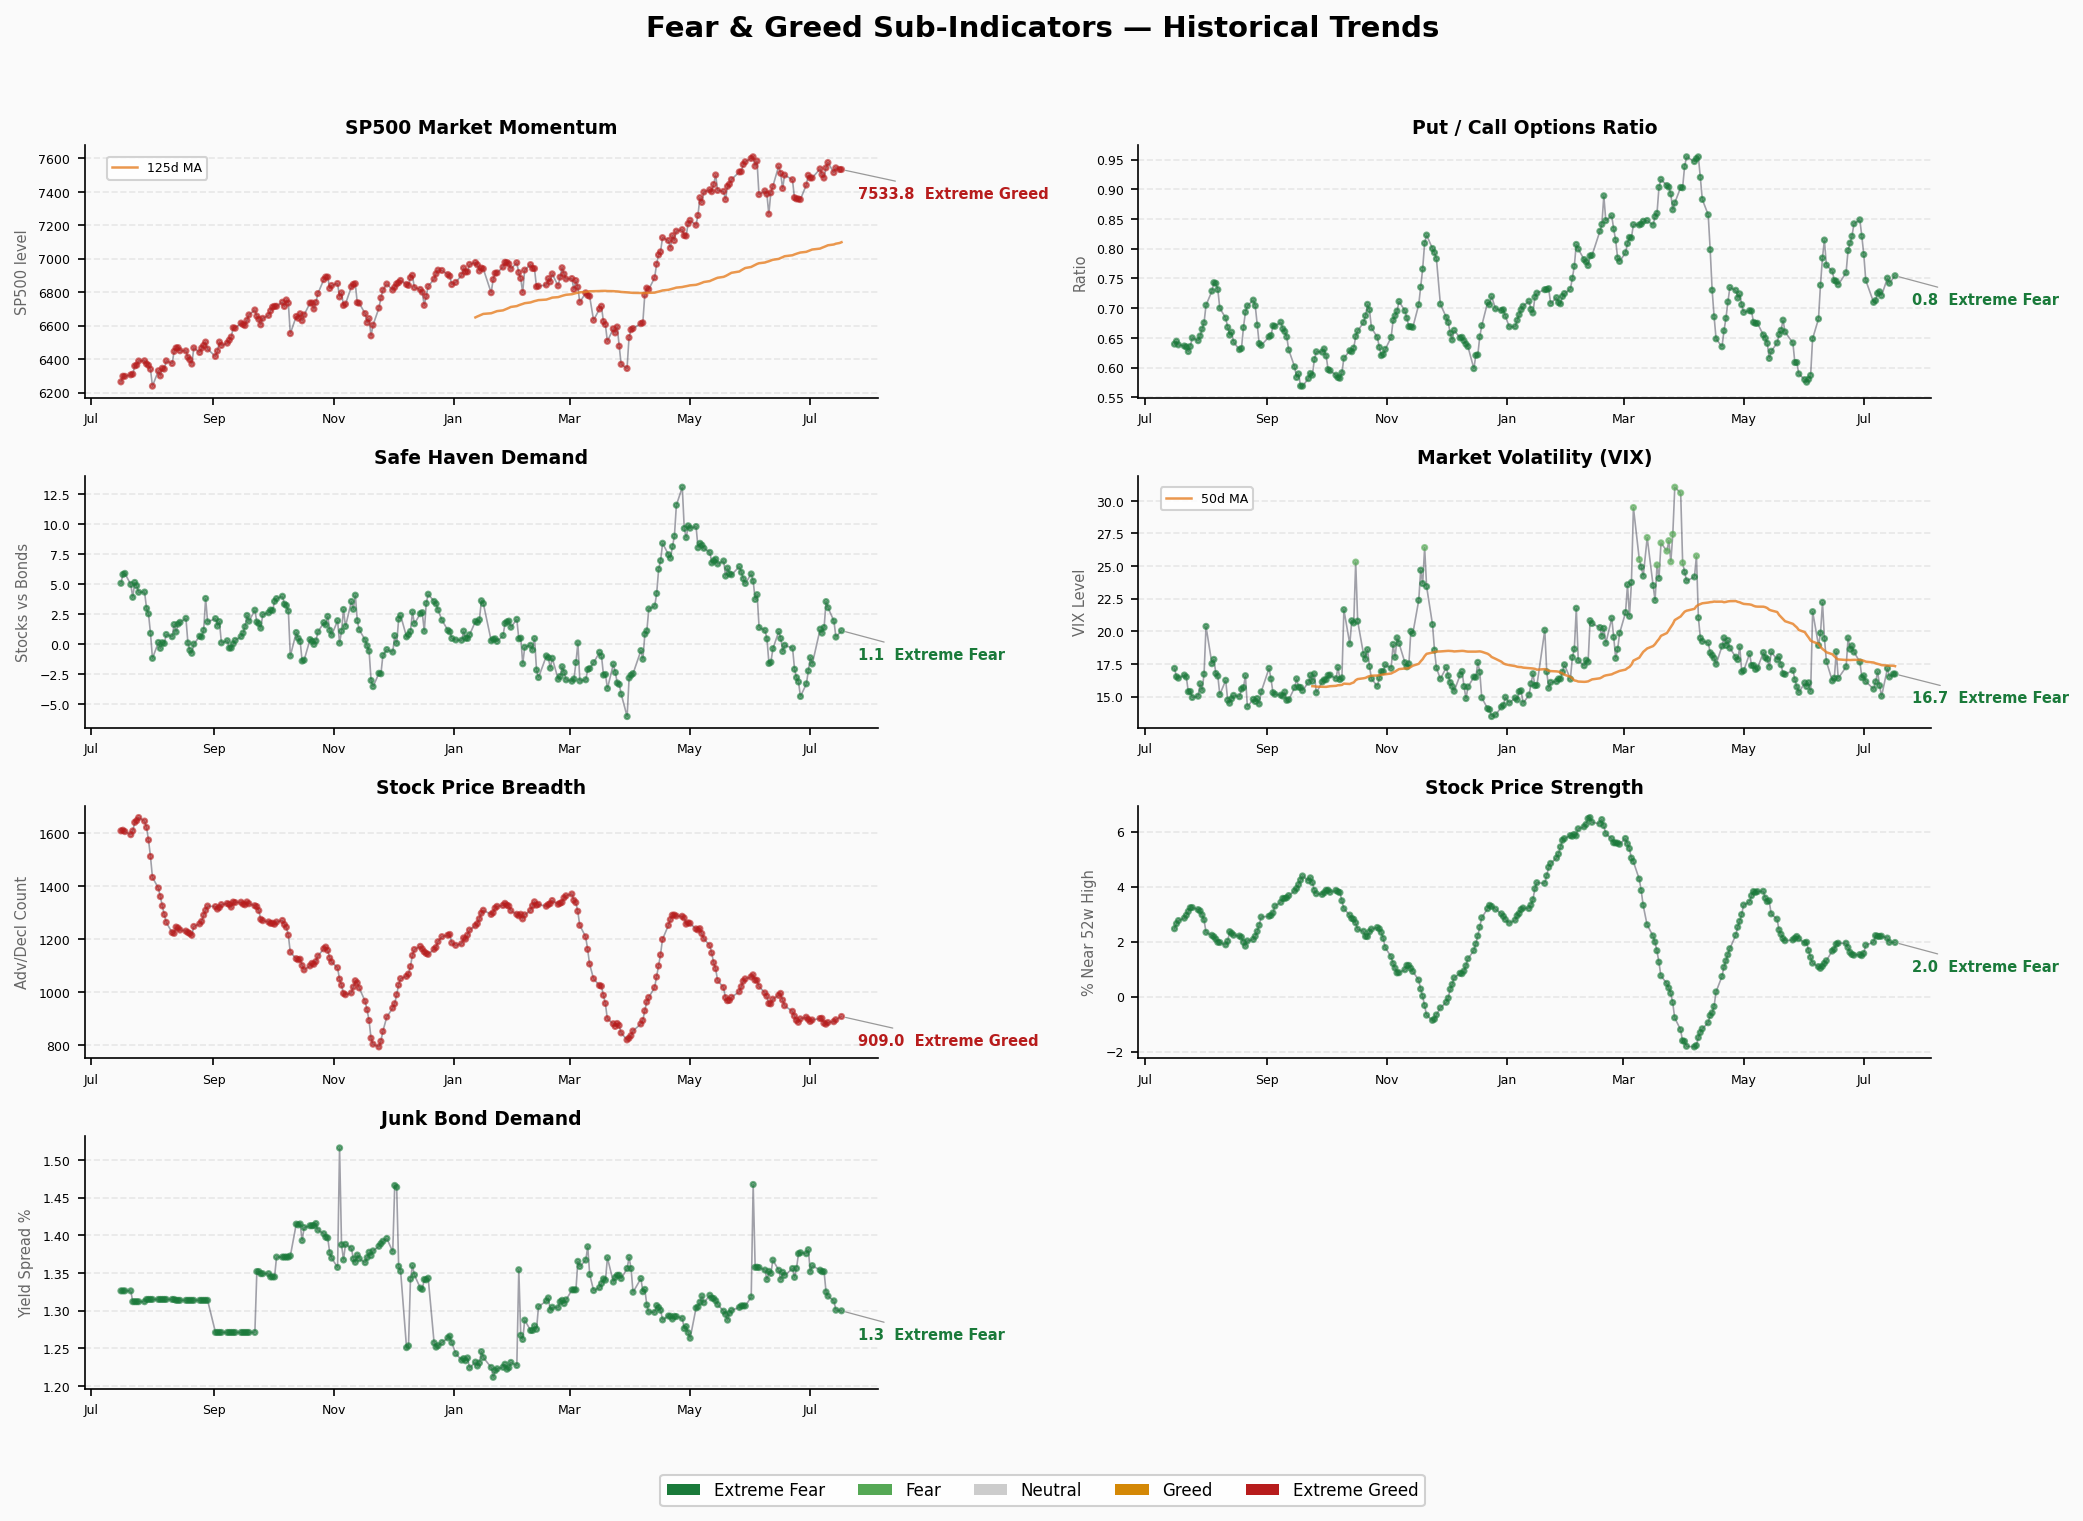
1. Junk Bond Demand — 42.8 | Fear
- Raw Value: HY OAS vs Treasury spread ~1.30%
- Analysis: Credit spreads remain in a normal-to-tight range, indicating fixed-income markets still have appetite for risk assets. Spread narrowed slightly from 1.32% to 1.30% over 5 days — modestly positive.
- Rating Logic: Narrowing spreads = improving risk appetite, but absolute level remains in cautious territory.
2. Market Momentum — 47.2 | Neutral
- Raw Value: S&P 500 ~7,533.77
- Analysis: SPX dipped slightly from 7,575 to 7,534 over 5 days, holding just above its 125-day moving average. Momentum rating just crossed the Neutral threshold.
- Trend: Sideways consolidation, no directional signal.
3. Stock Price Strength — 38.4 | Fear
- Raw Value: 52-week high/low ratio ~1.97
- Analysis: The ratio of NYSE stocks hitting 52-week highs vs lows is narrowing. Declined steadily from 2.19 to 1.97 over 5 days — fewer stocks making new highs.
- Trend: ↓ 5 consecutive days of weakening.
4. Stock Price Breadth — 22.2 | Extreme Fear
- Raw Value: McClellan Volume Summation Index ~908.97
- Analysis: ⚠️ The most dangerous signal. While the absolute index value isn’t extremely low, CNN’s scoring model flags it as Extreme Fear — meaning rally participation is critically narrow. A handful of mega-caps are propping up indices while most stocks are being abandoned.
- Trend: Marginal improvement from 879 to 909 over 5 days, but the score remains extremely low.
5. Put/Call Options — 42.4 | Fear
- Raw Value: Put/Call ratio ~0.75
- Analysis: Put/call ratio in normal-to-elevated range. Options market leaning defensive but not panicked. Steady at 0.72-0.75 over 5 days.
- Trend: → Flat.
6. Market Volatility — 50.0 | Neutral
- Raw Value: VIX ~16.73
- Analysis: VIX oscillating in the low 15-17 range. Expected volatility is subdued. Reading lands exactly at Neutral midpoint.
- Trend: Narrow 15.03-17.16 range over 5 days. No directional signal.
7. Safe Haven Demand — 48.8 | Neutral
- Raw Value: Stock vs bond return spread ~1.15%
- Analysis: Stock outperformance over bonds is shrinking rapidly — from 3.56% a week ago to just 1.15%. Capital is rotating from equities to Treasuries at an accelerating pace.
- Trend: ↓ Sharpest decline among all 7 indicators over 5 days.
🔍 Structural Divergence Analysis
Extreme Value Alerts
- Stock Price Breadth 22.2 (Extreme Fear) — approaching the <20 extreme fear threshold. This is the primary risk signal.
- No indicators in Extreme Greed (>80).
Divergence Signals
| Divergence Pair | Spread | Implication |
|---|---|---|
| Safe Haven (48.8) vs Breadth (22.2) | 26.6 | Largest divergence: bond market calm but equity breadth in extreme fear |
| VIX (50.0) vs Breadth (22.2) | 27.8 | Volatility complacent while internal market structure deteriorates |
Core Contradiction: On the surface — low VIX, tight credit spreads, flat SPX — everything looks calm. But beneath: breadth is in extreme fear, safe haven demand is surging, and fewer stocks are making new highs. This “calm surface, rotting core” pattern is often a precursor to regime change.
Trend Assessment
- Time in Fear Zone: ~14 trading sessions — mid-term fearful regime
- Bullish Trigger: Needs Breadth >30 and Safe Haven decline to reverse for a push into Neutral
- Downside Risk: If Breadth breaks below 20 (extreme fear), could trigger broader selling pressure
🚨 Crisis Precursor Dashboard
1. Credit Spreads
| Metric | Value | Status | Thresholds |
|---|---|---|---|
| HY OAS | 2.71% | 🟢 Normal | <3% Normal / 3-5% Caution / 5-8% Panic / >8% Crisis |
| IG OAS | 0.79% | 🟢 Normal | <1% Normal / 1-2% Caution / >2% Panic |
- Trend: Credit spreads remain low and stable. Bond markets are not signaling any stress. Data as of 2026-07-15.
2. Yield Curve
| Metric | Value | Status |
|---|---|---|
| 10Y-2Y Spread | +41bp | 🟢 Normal (shallow) |
| 10Y Yield | 4.55% | — |
| 2Y Yield | 4.13% | — |
| 30Y Yield | 5.08% | — |
- Trend: Curve remains positively sloped at 41bp, ending a two-year inversion. Normalization is constructive, though 10Y-30Y remains inverted at -53bp — elevated long-end inflation expectations.
3. Margin Debt (FINRA)
- Latest Known: $1.304T (April 2026)
- Status: 🔴 All-Time High Zone
- Analysis: Margin debt at historic peaks signals extreme market leverage. Any correction could trigger a deleveraging feedback loop. FINRA monthly data typically lags 1-2 months.
4. IPO Market
- 2026 YTD: ~73 IPOs (per Renaissance Capital)
- Status: 🔴 Record Inflows
- Analysis: Elevated IPO activity indicates active primary markets and sustained risk appetite. Historically, IPO peaks often coincide with market tops.
5. Fund Flows
- 2026 YTD ETF Net Inflows: ~$856B (record)
- Status: 🔴 Record
- Analysis: Relentless ETF inflows show extreme retail and institutional participation. Record inflows are both a bull market pillar and a contrarian warning — who buys after the last buyer?
Overall Assessment
| Signal | Count | Indicators |
|---|---|---|
| 🟢 Normal | 3 | HY OAS, IG OAS, Yield Curve |
| 🟡 Caution | 0 | — |
| 🔴 Warning | 2 | Margin Debt (ATH), IPO/ETF Flows (Record) |
Bottom Line: Credit markets and the yield curve are normal, but capital flow extremes are concerning. FNG composite hovering in Fear + breadth in extreme fear + margin debt at all-time highs = a classic high-level fragility setup. Not predicting an imminent crash, but the risk/reward ratio is deteriorating.