CNN Fear & Greed Analysis 2026-07-16
Composite index 46.3 (Neutral), +3.0 from previous close. Fifth consecutive day in neutral territory after recovering from fear. Market Momentum (S&P 500) remains in greed, but breadth and stock strength still in fear — significant structural divergence. VIX at 15.67 remains low, credit spreads normal. Safe Haven Demand spike is the biggest warning signal this session.
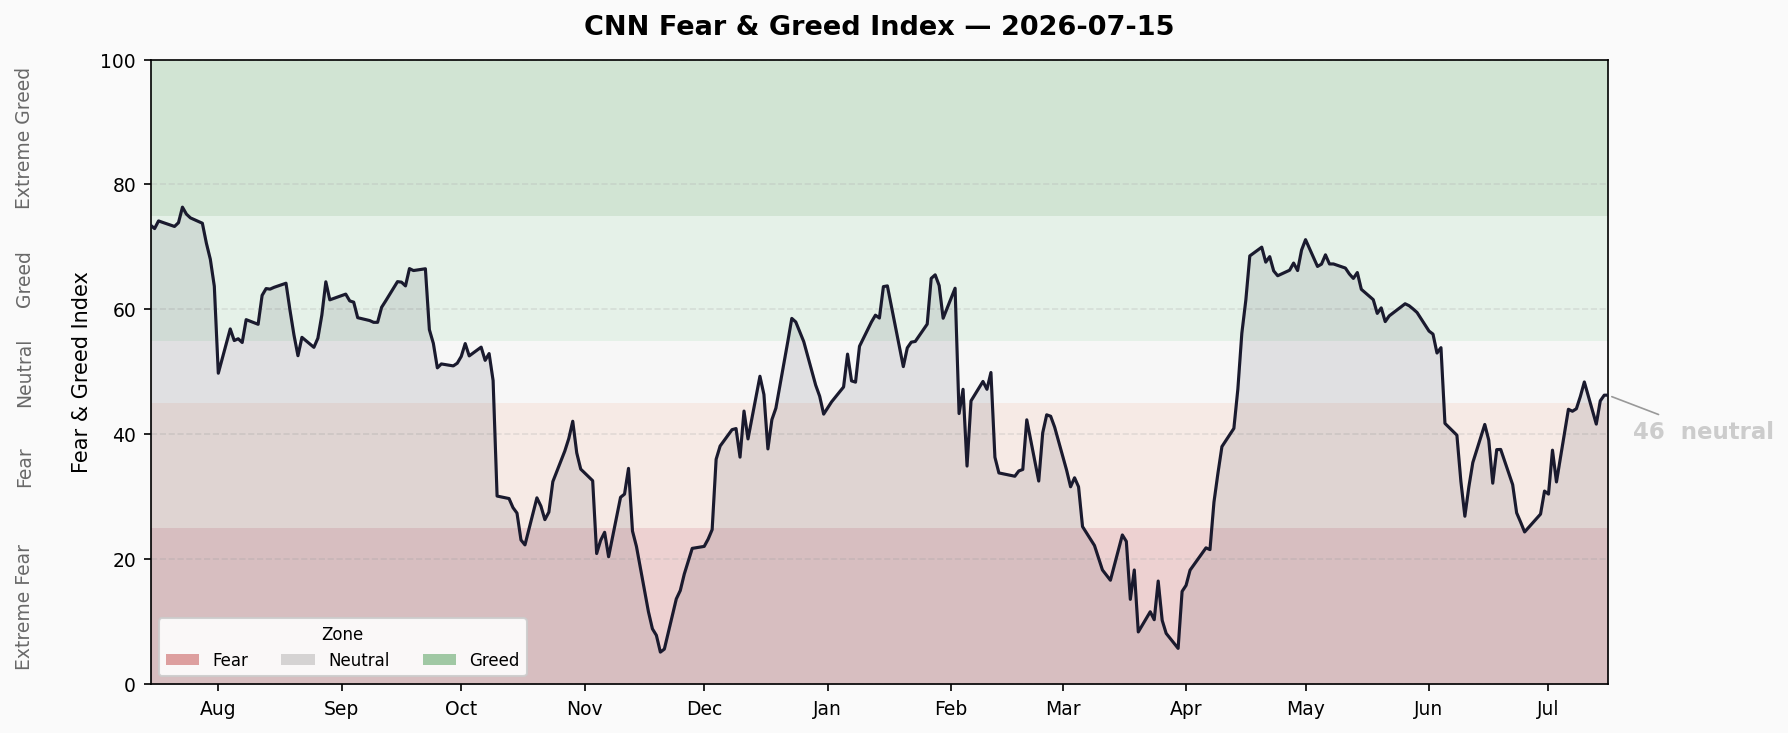
Composite Index Trend
| Metric | Value |
|---|---|
| Latest FNG Composite | 46.3 (Neutral) |
| Previous Close | 43.3 (Fear) |
| Daily Change | +3.0 ↑ |
| 1 Week Ago | 44.1 (Fear) |
| 1 Month Ago | 41.6 (Fear) |
| 1 Year Ago | 73.5 (Greed) |
Last 10-Day Trend: 32.4 → 44.0 → 43.7 → 44.1 → 46.1 → 48.4 → 41.7 → 45.4 → 46.3 → 46.3
Steady recovery from the fear low of 32.4 on July 3. Broke through the neutral line (45) on July 9 and has held neutral for 5 consecutive sessions. A pullback to 41.7 on July 13 shows the recovery isn’t linear. Overall trajectory: fear → neutral repair channel.
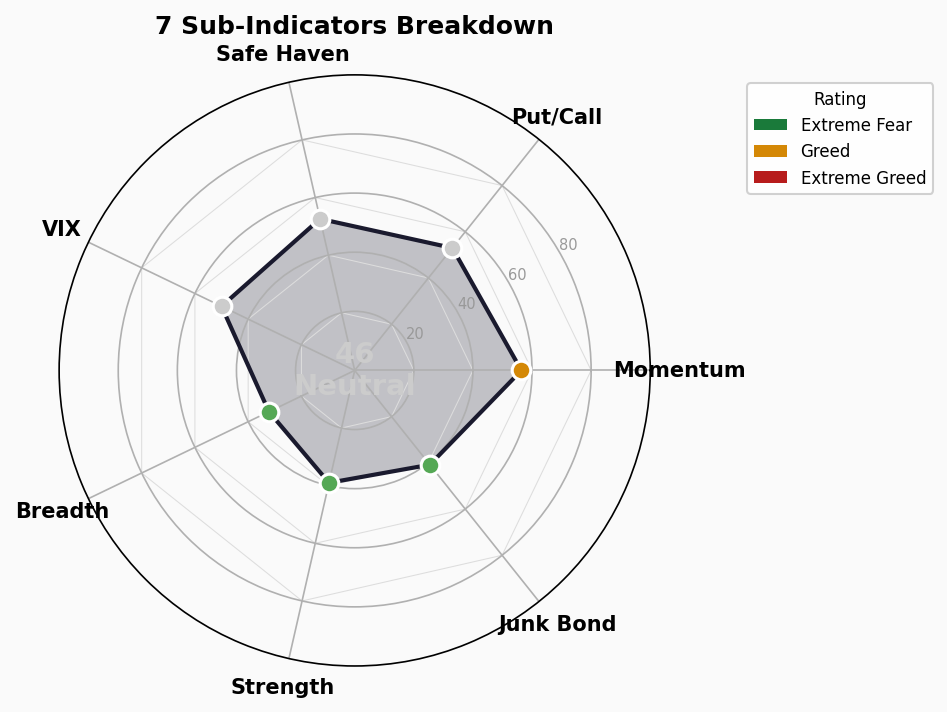
Seven Sub-Indicator Scan
| Sub-Indicator | Score | Rating | Raw Value | Direction |
|---|---|---|---|---|
| Market Momentum (S&P 500) | 56 | Greed | 7572.40 | → Flat |
| Stock Price Strength | 39 | Fear | 1.99 | ↑ Rising |
| Stock Price Breadth | 32 | Fear | 972.59 | ↑ Rising |
| Put/Call Options | 53 | Neutral | 0.7275 | ↓ Falling |
| Market Volatility (VIX) | 50 | Neutral | 15.67 | → Flat |
| Junk Bond Demand | 41 | Fear | 1.30 | ↑ Rising |
| Safe Haven Demand | 53 | Neutral | 1.64 | ↑ Spiked |
Structural Divergence Analysis
⚠️ Core Contradiction: Index Highs vs Internal Deterioration
- Market Momentum (56, Greed) — S&P 500 near all-time high at 7572, surface-level calm
- Stock Price Breadth (32, Fear) — Market breadth in fear territory, indicating gains concentrated in mega-cap heavyweights; small/mid-caps not participating
- Stock Price Strength (39, Fear) — Low percentage of stocks at 52-week highs, confirming the “narrow market” thesis
This “index up, breadth down” combination is a classic late-cycle bull market signature — not a crash signal, but participation is thinning.
🚩 Safe Haven Demand Spike (Key Warning)
Safe Haven Demand jumped from 0.67 to 1.64 — nearly doubling. This means capital is rotating from equities into bonds and safe-haven assets. With VIX at just 15.67, this stealth rotation is worth serious attention — it may signal “smart money” quietly positioning defensively.
✅ Positive Signals
- Put/Call Ratio 0.73 — Below normal, no panic hedging in options market
- VIX 15.67 — Low volatility, sentiment is calm
- Junk Bond Demand slowly recovering — Credit markets not deteriorating
📊 Score Distribution
| Zone | Count | Indicators |
|---|---|---|
| Extreme Greed (>75) | 0 | — |
| Greed (55-75) | 1 | Market Momentum |
| Neutral (45-55) | 3 | Put/Call, VIX, Safe Haven |
| Fear (25-45) | 3 | Price Strength, Breadth, Junk Bond |
| Extreme Fear (<25) | 0 | — |
Trend Assessment
Current State: Fear recovery underway, structure fragile
FNG has recovered from extreme fear (bottom at 5.2 in late November 2025) over ~8 months. Now at mid-neutral (46.3), trending upward.
- Time in zone: Fear zone ~4 weeks (mid-June to early July). Entered neutral on July 9 — only 5 sessions ago.
- Pivot signals: If FNG holds above 50 for 3-5 days, confirms greed transition. If it drops below 43, back to fear.
- Key watchpoints: Can Breadth and Strength follow through? Will Safe Haven Demand remain elevated?
Near-term verdict: Neutral-leaning-cautious. The index is climbing but the internals don’t look as good as the surface. Low VIX + Safe Haven anomaly = potential volatility brewing.
🚨 Crisis Precursor Dashboard
1. Credit Spreads
- HY OAS: 2.72% | 🟢 Normal (<3%)
- IG OAS: 0.79% | 🟢 Normal (<1%)
- Trend: Stable, credit markets not signaling distress
2. Yield Curve
- 10Y-2Y Spread: +42bp | 🟢 Normal-flat (not inverted)
- 10Y: 4.58% | 2Y: 4.18% | 30Y: 5.08%
- 30Y-10Y Spread: +50bp — long-end premium normal
3. Margin Debt (FINRA)
- Latest Known: $1.304T (April 2026) | 🔴 All-time high territory
- Risk: Elevated margin debt amplifies downside; deleveraging pressure in any correction
- Note: FINRA releases monthly; June data not yet available
4. IPO Market
- 2026 YTD: ~73 IPOs (Renaissance Capital estimate) | 🔴 Record inflows
- Context: IPO count not extreme, but ETF net inflows of $856B YTD are record-breaking — retail/passive money pouring in
- Historical: Record ETF inflows typically appear in late-cycle bull markets
5. Fund Flows
- 2026 YTD ETF Net Inflows: ~$856B (record) | 🔴
- Interpretation: Passive inflows remain relentless, but “record inflows” are historically a contrarian overheating signal
Composite Assessment
| Indicator | Status |
|---|---|
| Credit Spreads (HY OAS) | 🟢 Normal |
| Credit Spreads (IG OAS) | 🟢 Normal |
| Yield Curve (10Y-2Y) | 🟢 Normal-flat |
| Margin Debt | 🔴 Record High |
| IPO / ETF Flows | 🔴 Record |
2 🟢 / 0 🟡 / 2 🔴
Overall Assessment: Credit and rates are fully normal — no traditional crash precursors (spike in spreads, curve inversion). However, margin debt and ETF inflows both at record levels reflect extreme optimism — which is itself a risk. The primary concern right now is not systemic crisis but crowded-trade reversal risk.
Sources: CNN Fear & Greed Index, FRED (Federal Reserve), FINRA, Renaissance Capital. Data as of 2026-07-16 06:30 CST