CNN Fear & Greed Analysis 2026-07-15
Composite 43.14 Fear | 3 Fear + 4 Neutral sub-indicators | Crisis Signals Dashboard
CNN Fear & Greed Composite
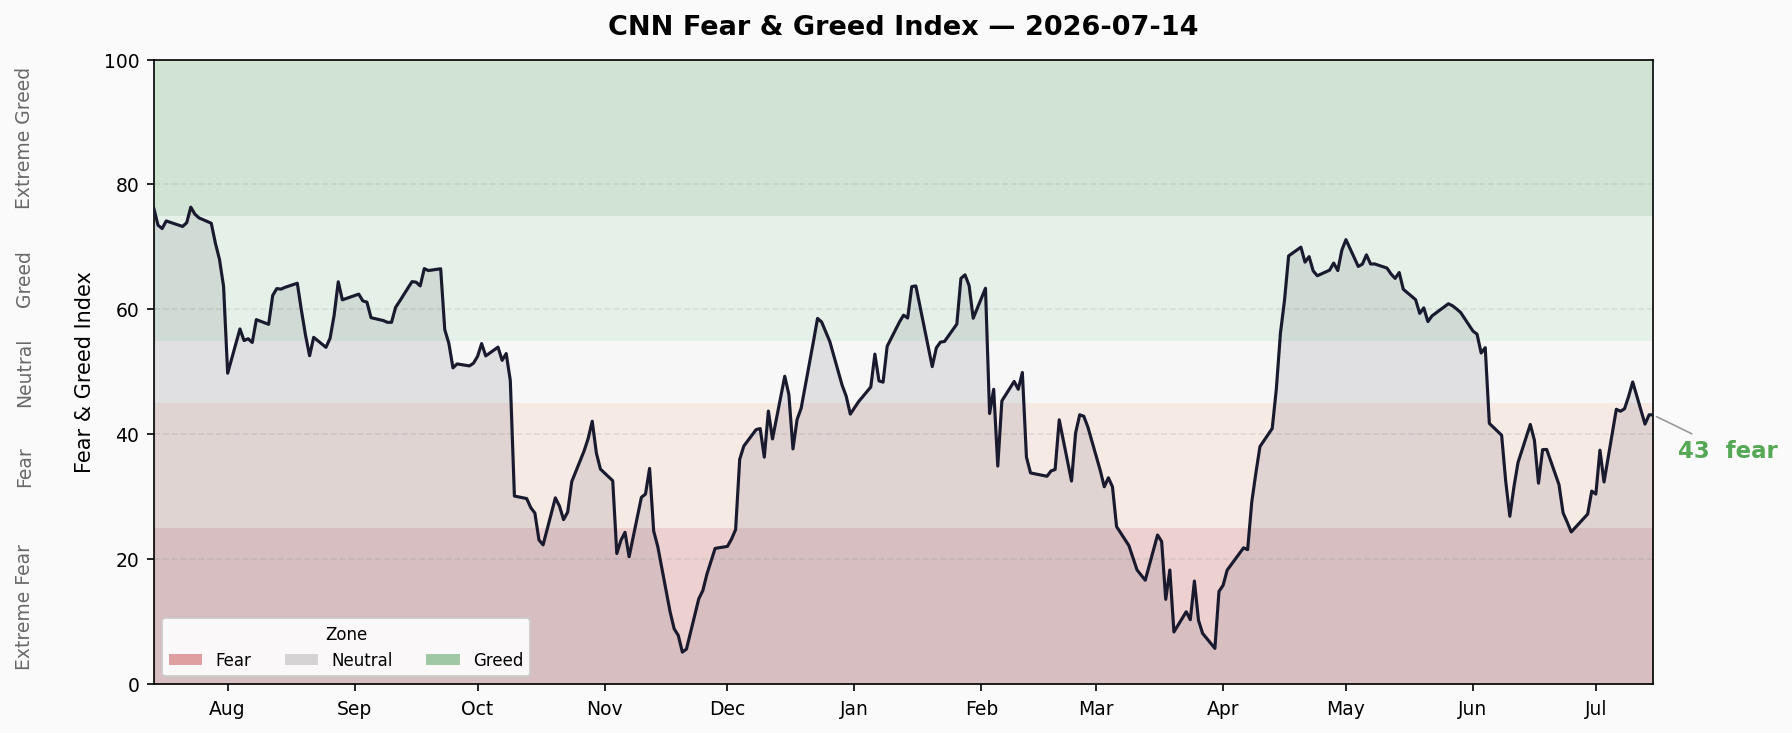
Latest: 43.14 | Rating: Fear
| Comparison | Value | Change |
|---|---|---|
| Previous Close | 43.71 | -0.57 ↓ |
| 1 Week Ago | 43.71 | -0.57 ↓ |
| 1 Month Ago | 35.51 | +7.63 ↑ |
| 1 Year Ago | 76.11 | -32.97 ↓↓ |
The composite has been hovering in the lower Fear zone (40-45) for several sessions. While it has recovered from extreme fear levels a month ago (35.51), it remains far below the extreme greed of a year ago (76.11). Market sentiment is cautious, sitting at the Fear/Neutral boundary.
10-Day Trend: The index climbed from 32-37 (Fear/Extreme Fear) in late June to 46-48 (Neutral) in early July, then retreated to 41-44 (Fear) in the second week of July — a “failed bounce, renewed weakness” pattern. The current 43.14 sits near the low end of the recent two-week range.
Seven Sub-Indicator Scan
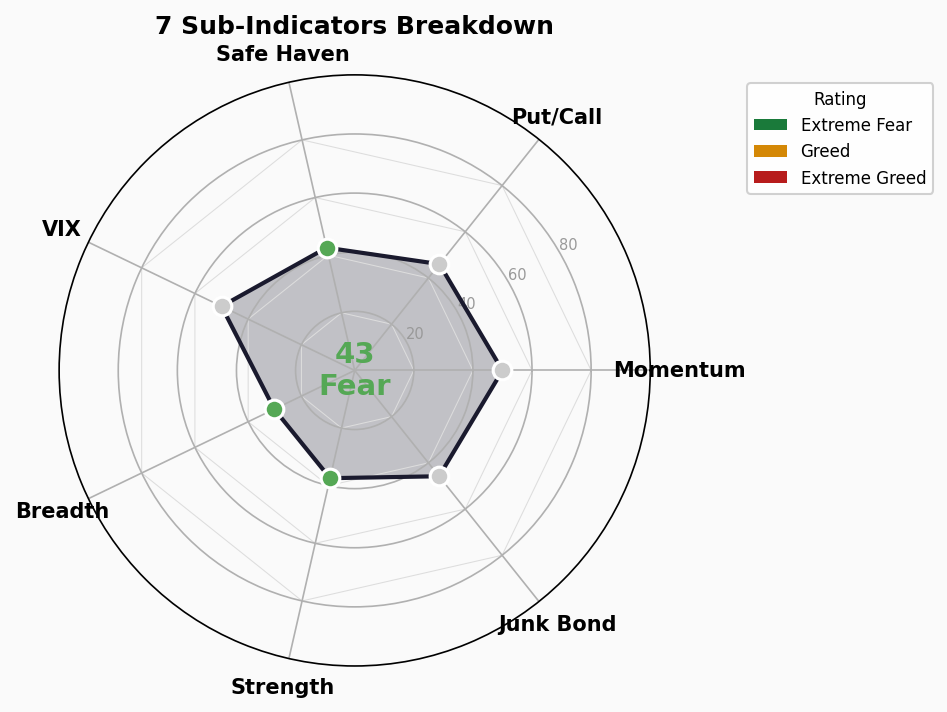
1. Market Momentum — S&P 500 vs 125-Day MA
- Score: 50 | Neutral
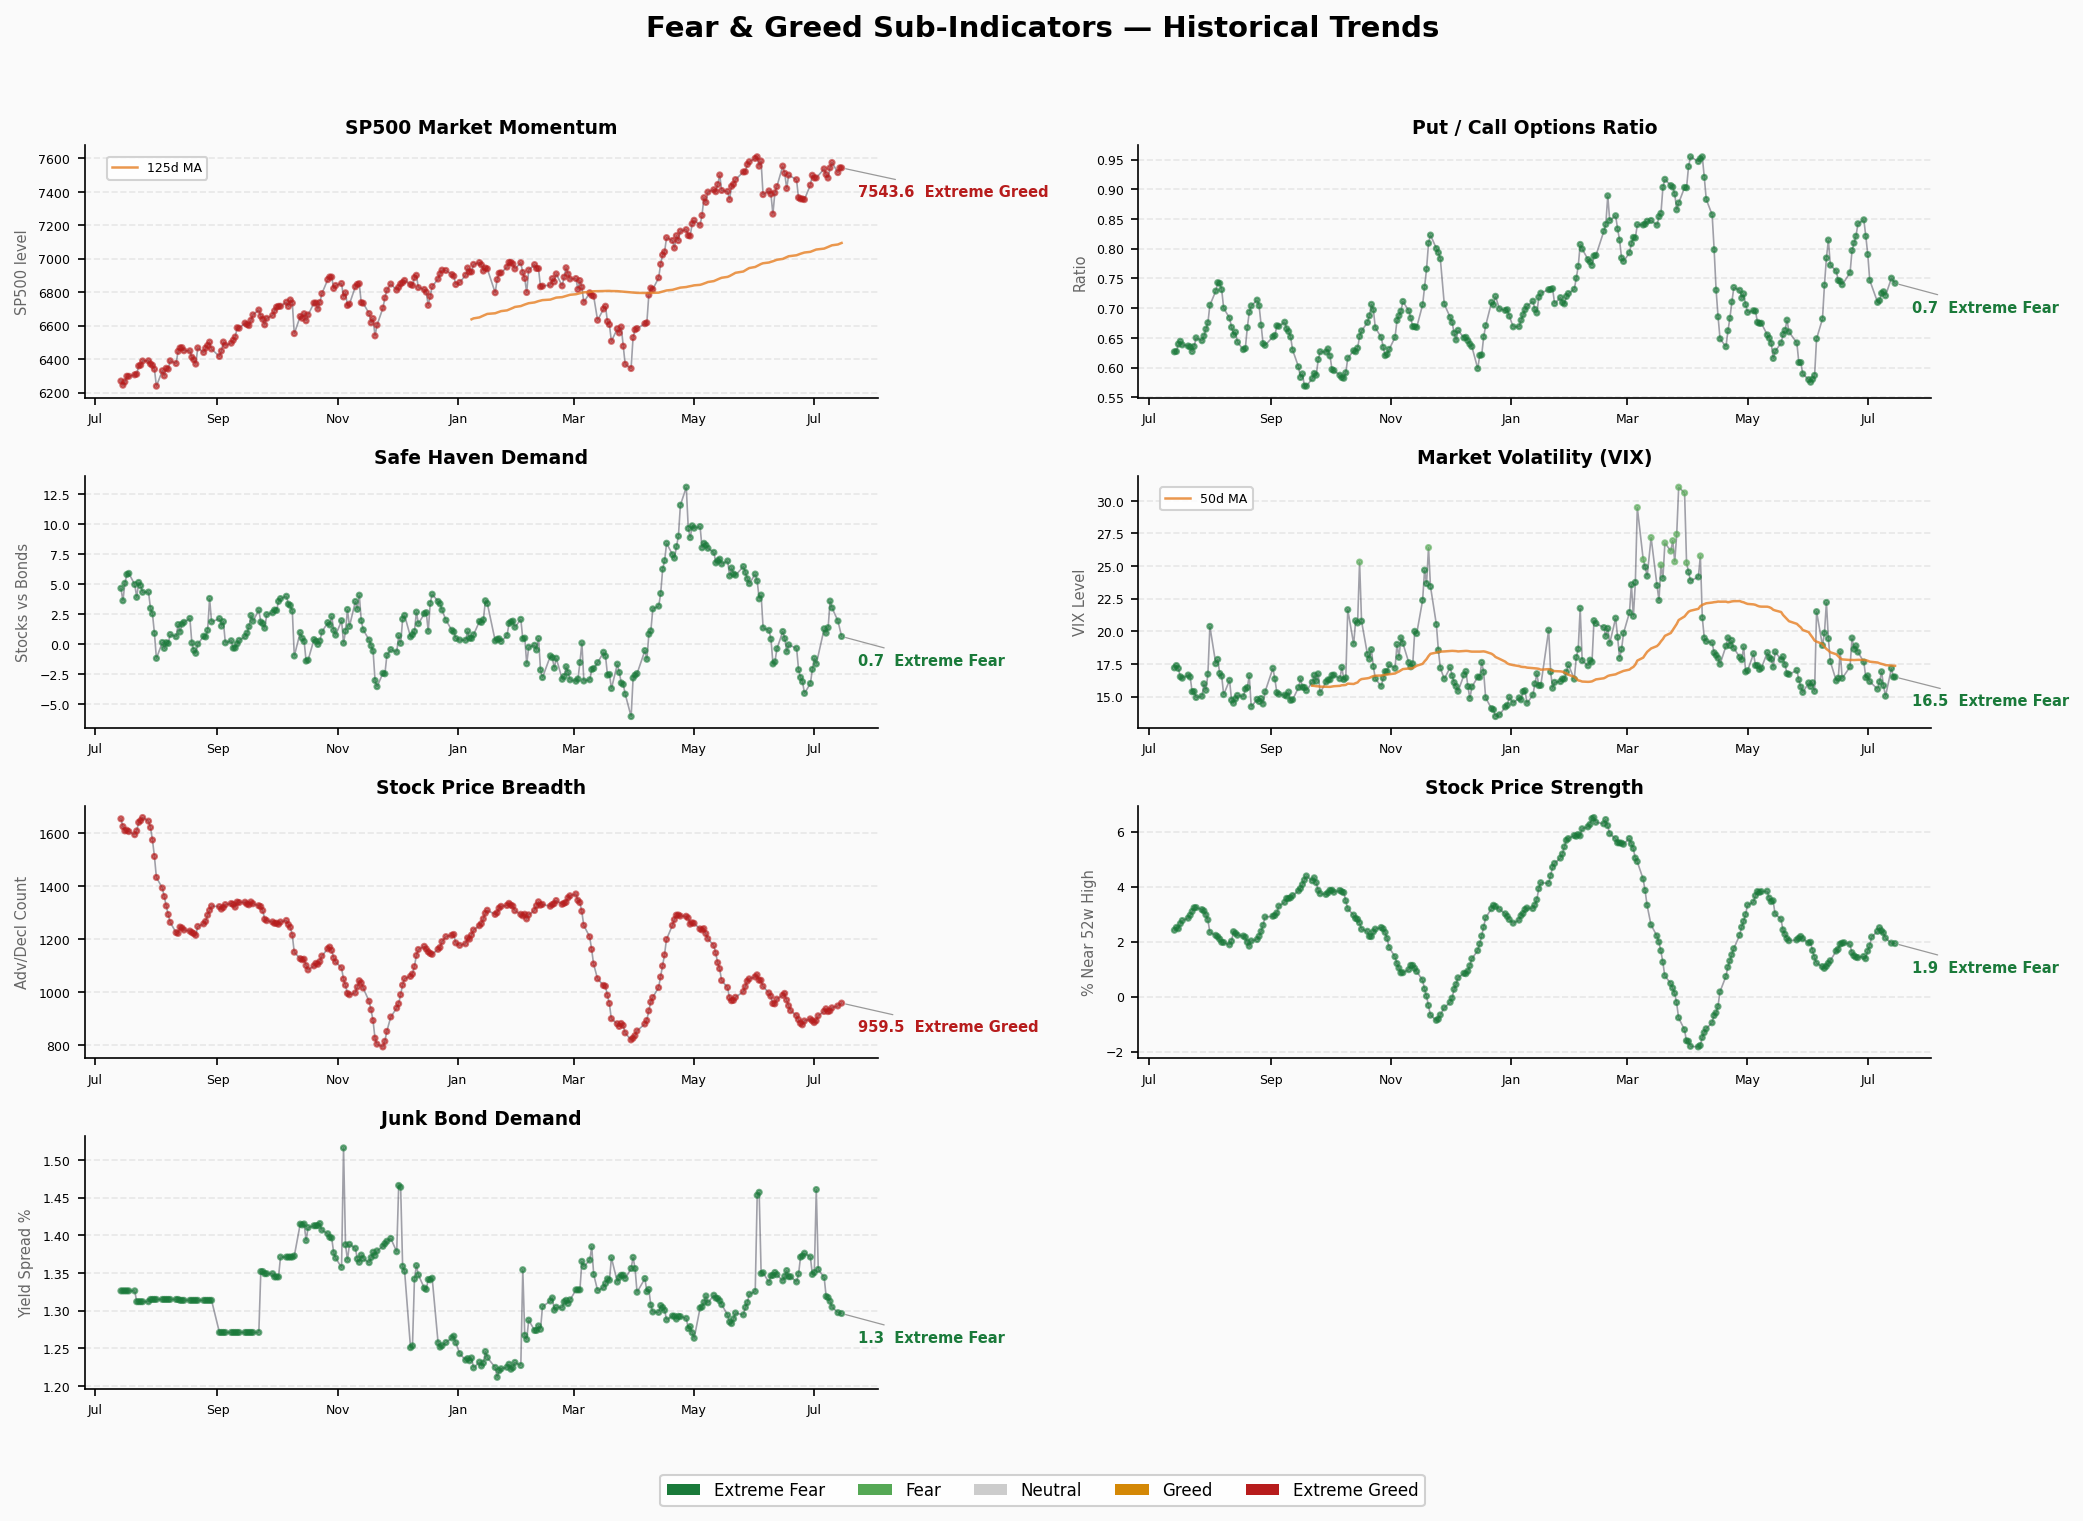
- S&P 500 at ~7,544, trading essentially at its 125-day moving average
- No clear directional signal from momentum
2. Stock Price Strength — 52-Week High/Low Ratio
- Score: 37.4 | Fear
- NYSE 52-week high/low ratio dropped to 1.93
- Fewer stocks making new highs, internal momentum weakening
- Has been declining from ~2.5 over the past month — bearish tilt
3. Stock Price Breadth — McClellan Volume Summation
- Score: 30.2 | Fear
- Volume summation index at ~959, on the lower side
- Advancing/declining volume ratio continues to narrow
- Breadth has been in Fear territory for over 3 weeks
4. Put/Call Ratio
- Score: 46 | Neutral
- Put/Call ratio at ~0.74, within neutral range
- Options market shows no signs of panic hedging or excessive speculation
- Slight decline from 0.75 a week ago — marginally more optimistic
5. Market Volatility (VIX)
- Score: 50 | Neutral
- VIX closed at 16.50, historically low
- VIX 50-day MA at ~17.37, current VIX slightly below
- Low-vol environment typically supportive of risk assets, but complacency risk exists
6. Junk Bond Demand
- Score: 45.8 | Neutral
- Junk bond yield spread narrowed to 1.30%
- Credit markets still showing demand for risk assets at healthy spread levels
- Multiple days of narrowing spreads indicate stable credit sentiment
7. Safe Haven Demand
- Score: 42.6 | Fear
- Stock vs Treasury excess return spread dropped to 0.66%
- Slight tilt toward safe-haven assets, but not at extreme levels
- Sharp decline from 3.61% a week ago suggests improving near-term risk appetite
Structural Contradictions
Current Setup: Weak Breadth + Low Vol + Stable Credit = Classic “Index Propped, Stocks Diverging”
Breadth vs Index Divergence: S&P 500 holds above 7,500 at all-time highs, yet breadth (30.2) and strength (37.4) are both in Fear territory. Mega-caps (especially Magnificent 7) are carrying the index while market participation narrows.
The Low-VIX Trap: VIX at 16.50 is extremely low, but breadth is weakening. Low volatility can breed complacency — when a catalyst arrives, vol can spike rapidly.
Safe Haven vs Credit Spread Tension: Safe haven demand (42.6 Fear) shows money rotating toward Treasuries, yet junk bond spreads (45.8 Neutral) continue to narrow. This inconsistency reflects a market torn between “wanting safety” and “not wanting to miss returns.”
No Extreme Readings: None of the 7 sub-indicators are above 80 (Extreme Greed) or below 20 (Extreme Fear). The market lacks clear extreme signals, consistent with a mid-cycle correction/consolidation phase.
Trend Assessment
- Time in Fear Zone: The composite has been in the Fear (25-45) range for approximately 4 weeks since mid-June, briefly touching Neutral before retreating again
- Key Reversal Signals: If breadth (currently 30.2) rises above 40 and strength breaks 45, sentiment could shift to Neutral. Conversely, if VIX breaks above 20 and breadth falls below 25, Extreme Fear could follow
- Short-Term Outlook: The composite is likely to oscillate in the 40-50 range, with the market awaiting new catalysts (earnings season, Fed signals)
🚨 Crisis Precursor Dashboard
1. Credit Spreads
- High Yield OAS: 2.69% | 🟢 Normal/Greed (<3% normal)
- Investment Grade OAS: 0.78% | 🟢 Normal (<1% normal)
- Data Date: 2026-07-13
- Trend: Stable, credit markets calm
2. Yield Curve
- 10Y-2Y Spread: +40bp | 🟢 Normal but Flat (>0bp normal, <50bp flat)
- 10Y: 4.62% | 2Y: 4.26% | 30Y: 5.10%
- 30Y-10Y Spread: -48bp (long-end inverted)
- Interpretation: 10Y-2Y has turned positive (no longer inverted), but 30Y-10Y remains inverted — long-end structure still abnormal
3. Margin Debt (FINRA)
- Latest Known: $1.304T (April 2026)
- Status: 🔴 All-Time High Range
- Risk: Margin debt at historically extreme levels; a market pullback could trigger forced liquidation feedback loops
- Note: Latest monthly data not yet released (FINRA typically lags 1-2 months); current levels may be higher
4. IPO Market
- 2026 YTD: ~73 IPOs (Renaissance Capital estimate)
- Status: 🟡 Moderately Warm
- Interpretation: IPO pace is moderate — not the excessive frenzy of 2021, but not cold either
5. Fund Flows
- ETF Net Inflows 2026 YTD: ~$856B (record pace)
- Status: 🔴 Record Inflows
- Risk: Massive inflows typically occur in late-cycle bull markets; historically, similar-scale inflows have preceded corrections
- Note: This is YTD cumulative; monthly pace may already be slowing
Overall: 2🟢 / 1🟡 / 2🔴
Core Contradiction: The two most sensitive leading indicators — credit markets (🟢) and yield curve (🟢) — are currently healthy, but margin debt (🔴) and fund flows (🔴) are at extreme levels. This pattern is more consistent with “late-cycle bull market” than “crisis imminent” — systemic risk is low, but correction risk is accumulating.