CNN Fear & Greed Analysis 2026-07-14
Composite 43.71 Fear | Structural divergence: Safe Haven lone Greed, Breadth & Strength declining
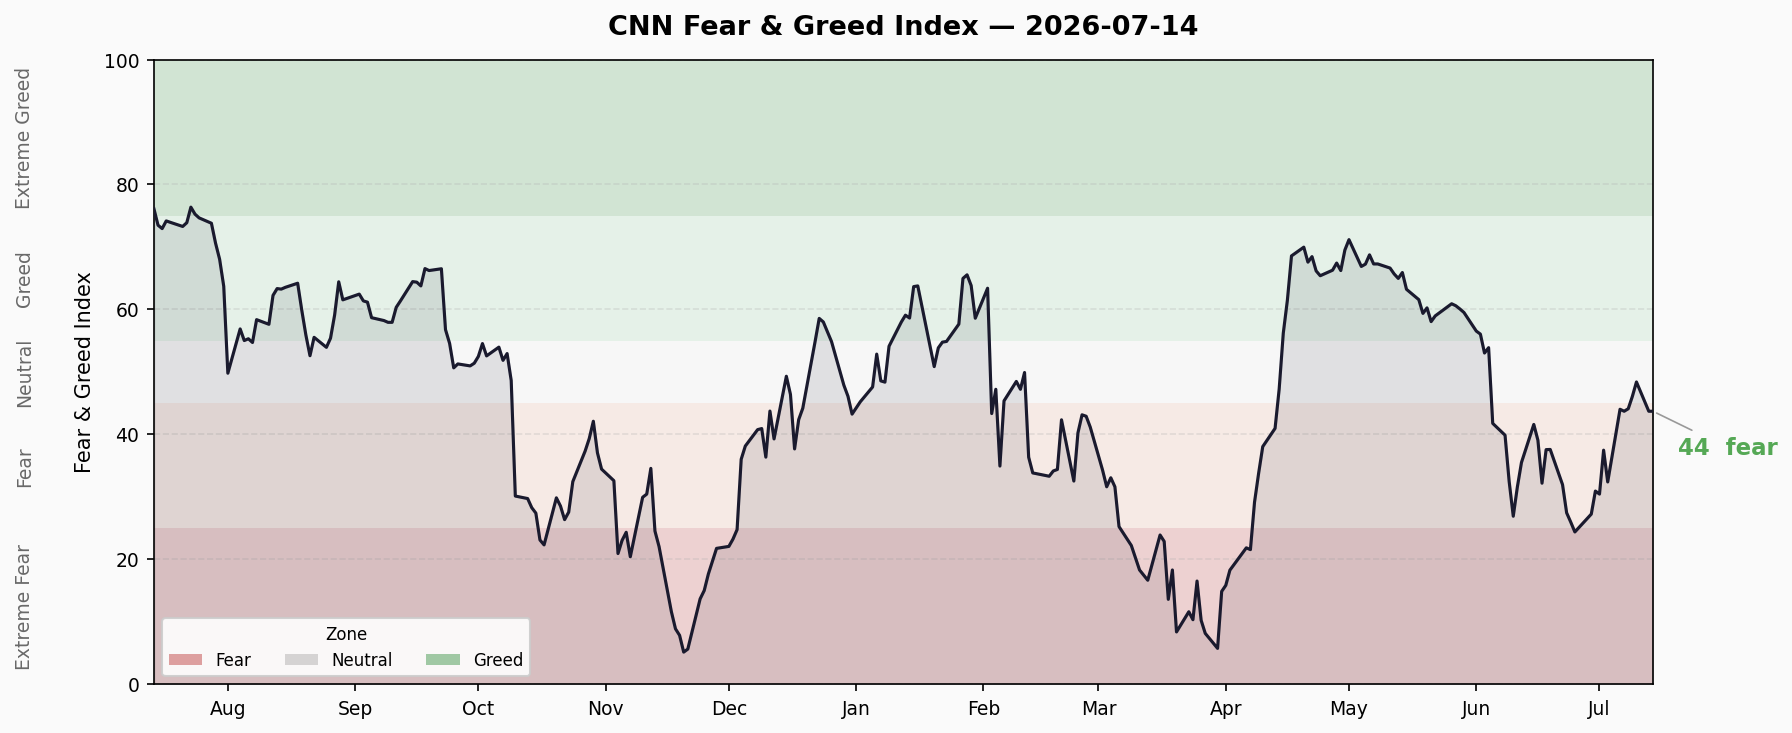
Composite Index Trend
| Metric | Value |
|---|---|
| Current | 43.71 — Fear 😨 |
| Previous Close | 43.71 (unchanged) |
| 1 Week Ago | 43.71 |
| 1 Month Ago | 35.51 — Fear |
| 1 Year Ago | 76.11 — Extreme Greed |
10-Day Trend: 37.5 → 32.4 → 44.0 → 43.7 → 44.1 → 46.1(Neutral) → 48.4(Neutral) → 43.7 → 43.7
Briefly touched Neutral territory on Jul 9-10 (46.1-48.4) before quickly retreating to Fear. The bounce failed to hold.
Key Divergence: S&P 500 rallied ~+20% YoY (6270→7515), while FNG collapsed from Extreme Greed to Fear — new price highs vs sentiment lows, a cautionary divergence. Over the past 30 days, SPX declined from 7580 to 7515, losing momentum.
Sub-Indicator Breakdown
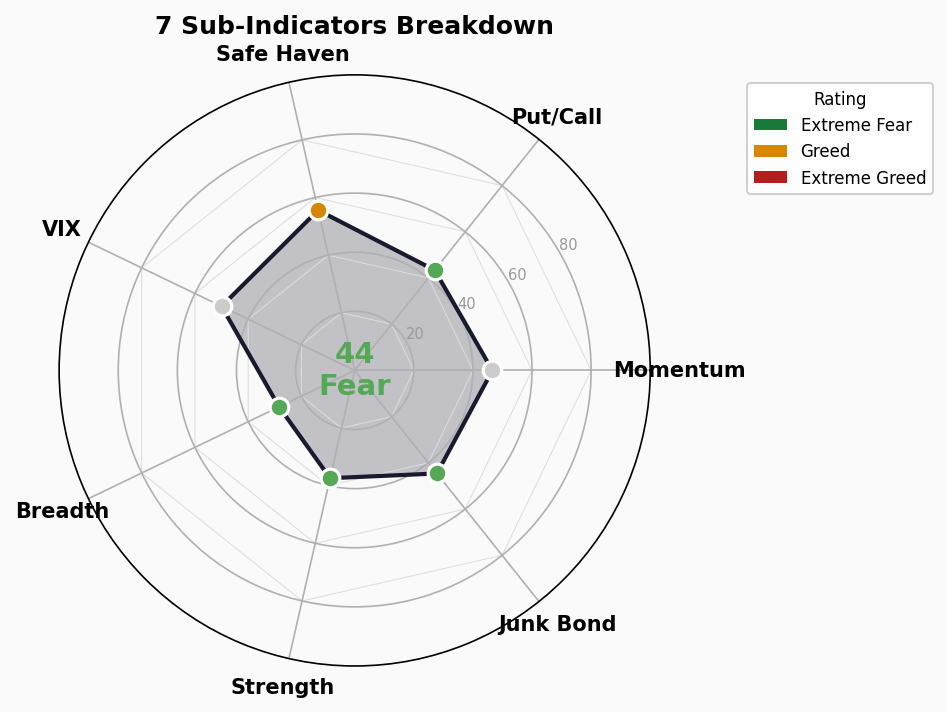
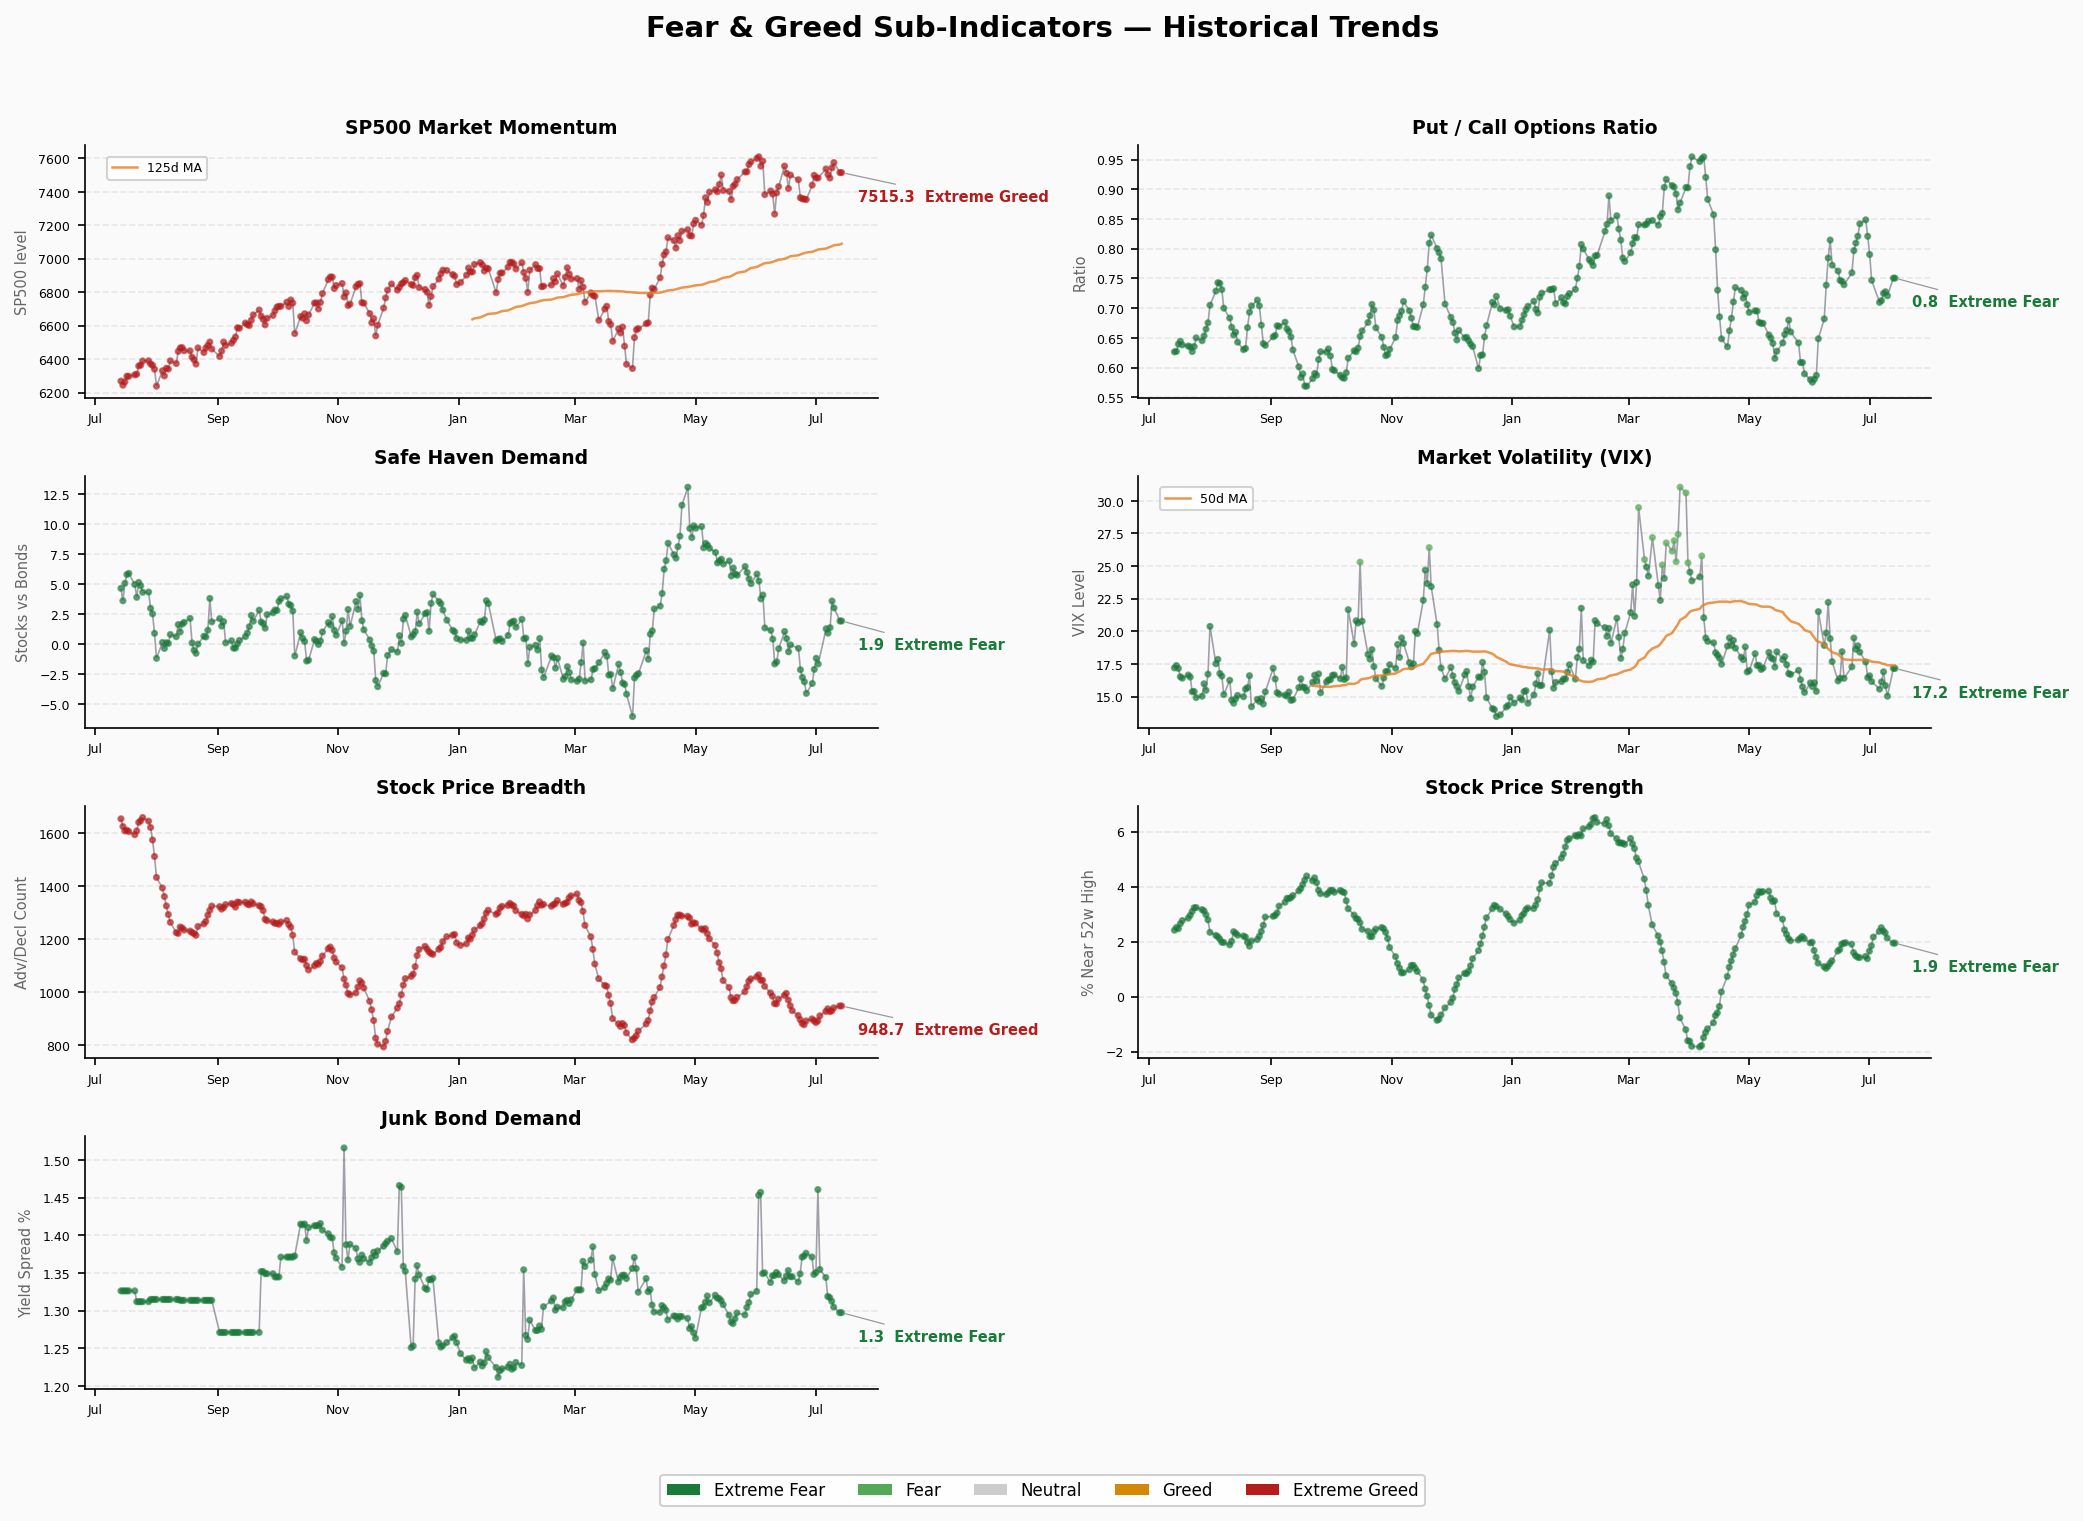
1. Stock Price Breadth — 28.4 😨 Fear
- Raw Value: 948.73
- Δ7d: +37.2 ↑ | Δ30d: -117.2 ↓
- Read: Short-term slight improvement, but medium-term breadth continues deteriorating. Fewer stocks participating in the rally — large caps propping up indices while small/mid caps lag.
2. Market Momentum — 46.6 😐 Neutral
- S&P 500: 7,515.34
- Δ7d: +32.1 ↑ | Δ30d: -64.7 ↓
- Read: Index hovering near its 125-day MA. Weekly bounce but monthly still negative — rally lacks follow-through.
3. Junk Bond Demand — 44.6 😨 Fear
- Spread Ratio: 1.297
- Δ7d: -0.057 ↓ | Δ30d: -0.156 ↓
- Read: Credit markets steadily tightening. Junk bond demand weakening vs investment grade across a full month. Risk appetite fading in fixed income.
4. Put/Call Options — 43.4 😨 Fear
- Ratio: 0.751
- Δ7d: +0.004 ↑ | Δ30d: +0.161 ↑↑
- Read: Put demand rising relative to calls, especially on the monthly timeframe. Options market tilting defensive.
5. Market Volatility (VIX) — 50.0 😐 Neutral
- VIX: 17.16
- Δ7d: +1.01 ↑ | Δ30d: +1.84 ↑
- Read: VIX creeping up from 15.32 to 17.16. Still in normal range (<20), but the upward drift signals accumulating anxiety beneath the surface.
6. Safe Haven Demand — 55.6 😊 Greed
- Ratio: 1.95
- Δ7d: +3.57 ↑↑ | Δ30d: -3.11 ↓
- Read: The lone Greed indicator among the seven. Capital still favors equities over Treasuries, with short-term safe haven demand dropping sharply. But this contradicts deteriorating breadth — money is concentrating in mega-caps, not broad participation.
7. Stock Price Strength — 37.4 😨 Fear
- Value: 1.95
- Δ7d: -0.22 ↓ | Δ30d: -0.03 ↓
- Read: Fewer stocks hitting 52-week highs. Momentum stocks losing steam, with a notable 7-day decline.
Structural Divergence Analysis
Extreme Value Alerts
- Stock Price Breadth 28.4 — approaching extreme fear territory (<25), worst deterioration
- Stock Price Strength 37.4 — also weak, shrinking leadership
Core Divergence
- Safe Haven Demand (55.6 Greed) ↔ Breadth (28.4 Fear): Money still flowing into equities (low safe haven demand) but participation is narrowing. Classic “narrow bull market” → “increasing divergence” signal — capital concentrating in a handful of large caps while most stocks have already weakened.
- VIX (17.16 Neutral) ↔ 5 Fear indicators: VIX hasn’t priced in the anxiety that breadth, credit, options, and strength are already signaling. If VIX catches up and breaks above 20, it could trigger a larger correction.
Rating Distribution
- 😊 Greed: 1 (Safe Haven Demand)
- 😐 Neutral: 2 (Market Momentum, VIX)
- 😨 Fear: 4 (Breadth, Junk Bond, Put/Call, Strength)
Asymmetric bearish tilt.
Trend Outlook
- Time in Fear Zone: ~6 weeks since early June. Only briefly touched Neutral on Jul 9-10 before falling back.
- Reversal Conditions: FNG needs to break above 50 with synchronous improvement in breadth. Current breadth and strength still deteriorating — low probability of V-shaped reversal.
- Base Case: Fear zone oscillation (35-48), awaiting breadth repair or VIX breakout for directional confirmation.
🚨 Crash Precursor Dashboard
1. Credit Spreads — 🟢 Normal
- HY OAS: 2.69% (2026-07-10) | 🟢 Normal
- IG OAS: 0.77% (2026-07-10) | 🟢 Normal
- Thresholds: HY <3% normal / 3-5% caution / 5-8% panic / >8% crisis; IG <1% normal / 1-2% caution / >2% panic
- Trend: Credit spreads at historically low levels — no alarm from credit markets
2. Yield Curve — 🟢 Normal / Flattening
- 10Y-2Y Spread: +36bp | 🟢 Normal
- 10Y-30Y Spread: -50bp (long-end inversion)
- 10Y: 4.56% | 2Y: 4.21% | 30Y: 5.06%
- Read: Short-end no longer inverted, but 30Y above 10Y signals persistent long-end inflation premium. Curve shape pricing “soft landing” but long-end premium is anomalous.
3. Margin Debt — 🔴 All-Time High Territory
- FINRA Margin Debt: $1.304T (April 2026, latest available)
- Status: 🔴 All-time high territory
- Read: Extreme leverage levels mean high vulnerability. A significant drawdown could trigger amplified selling via deleveraging. May-July updates need monitoring.
4. IPO & Fund Flows — 🔴 Record Inflows
- 2026 YTD IPOs: ~73 (Renaissance Capital estimate)
- 2026 YTD ETF Net Inflows: ~$856B (record pace)
- Status: 🔴 Record inflows
- Read: ETF money pouring in at unprecedented speed suggests retail/institutional still chasing. Historically, massive inflows tend to appear in mid-to-late cycle, not at the beginning.
5. Composite Assessment
| Indicator | Status |
|---|---|
| Credit Spreads (HY OAS) | 🟢 Normal |
| Credit Spreads (IG OAS) | 🟢 Normal |
| Yield Curve (10Y-2Y) | 🟢 Normal |
| Margin Debt | 🔴 All-Time High |
| Fund Flows (ETF/IPO) | 🔴 Record |
Summary: 3🟢 / 0🟡 / 2🔴
Credit and yield curve are normal, but leverage and inflow levels indicate “late-cycle exuberance.” This is not an imminent crash signal, but fragility is accumulating — high leverage + elevated valuations + weakening sentiment (FNG Fear) = amplified volatility when a correction arrives.