CNN Fear & Greed Analysis 2026-07-13
Composite 49.49 Neutral, recovering from Fear territory. Momentum Greed vs Breadth Fear divergence widens. Credit spreads normal but margin debt at record highs.
Composite Index
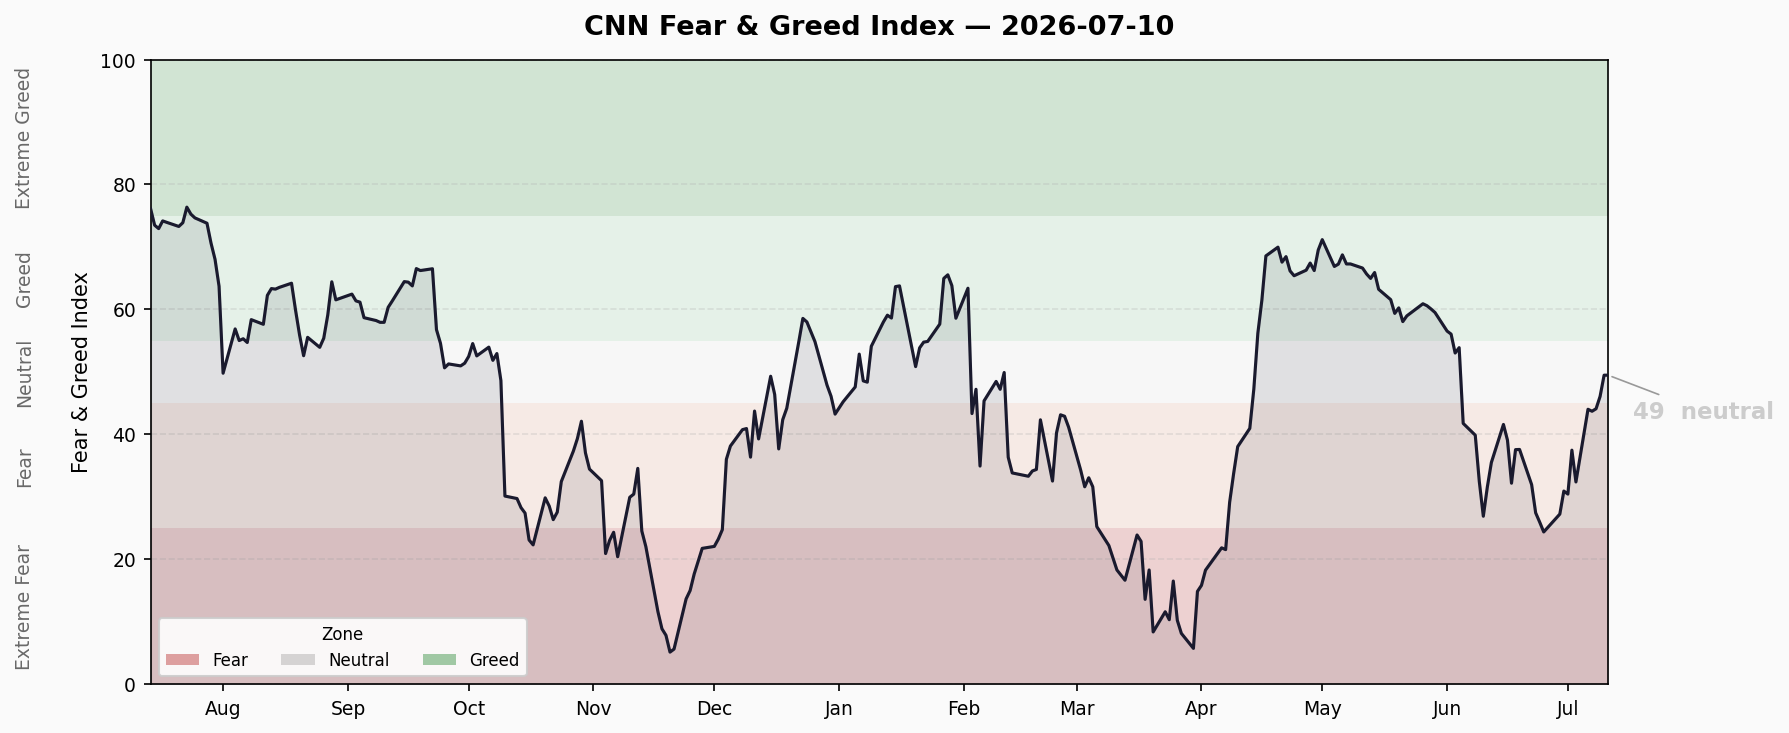
- Latest: 49.49 — Neutral
- Previous Close: 47.29 (+2.20)
- 1 Week Ago: 32.40 (+17.09, Fear → Neutral)
- 1 Month Ago: 26.91 (+22.58, Fear → Neutral)
- 1 Year Ago: 76.97 (Extreme Greed)
Trend Analysis
The composite index has rebounded 81% over 11 trading sessions since hitting a low of 27.26 on June 29. It now sits in the lower-middle of the Neutral zone (44-56). The full cycle from early June’s 60+ Greed readings to late June’s Extreme Fear (bottom at 22.33) and back to 49.49 took roughly 5 weeks.
Key assessment: At 49.49, the index is in the lower portion of Neutral, about 6.5 points from the Greed threshold (56). Momentum remains upward but the pace has decelerated from the +3-5 points/day seen earlier. Near-term direction hinges on this week’s CPI release (Wednesday) and the start of Q2 earnings season.
7 Sub-Indicator Scan
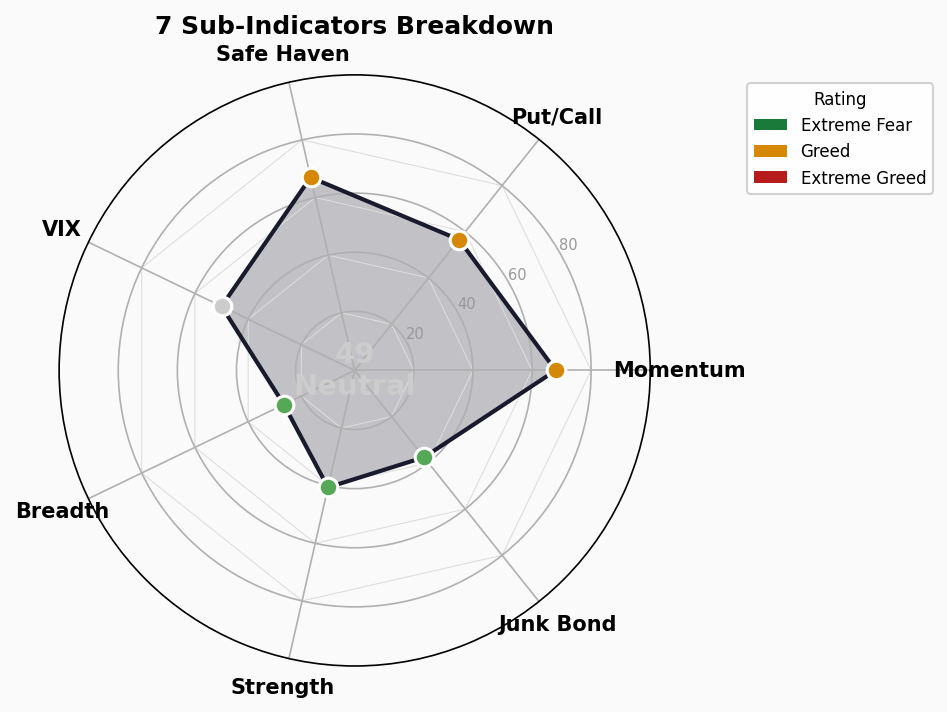
| Indicator | Score | Rating | Raw Value | Direction |
|---|---|---|---|---|
| Market Momentum (SPX) | 68 | Greed 🟢 | SPX 7,575 | Near highs |
| Stock Price Strength | 40.6 | Fear 🔴 | 52W High/Low ratio | Weak |
| Stock Price Breadth | 26.6 | Fear 🔴 | Advancing volume | Notably weak |
| Put/Call Options | 56.6 | Greed 🟢 | P/C Ratio 0.72 | Optimistic |
| Market Volatility | 50 | Neutral ⚪ | VIX 15.03 | Calm |
| Junk Bond Demand | 37.6 | Fear 🔴 | Spread widening | Risk-off |
| Safe Haven Demand | 67 | Greed 🟢 | Stock-Bond yield gap | Pro-equity |
Sub-Indicator Commentary
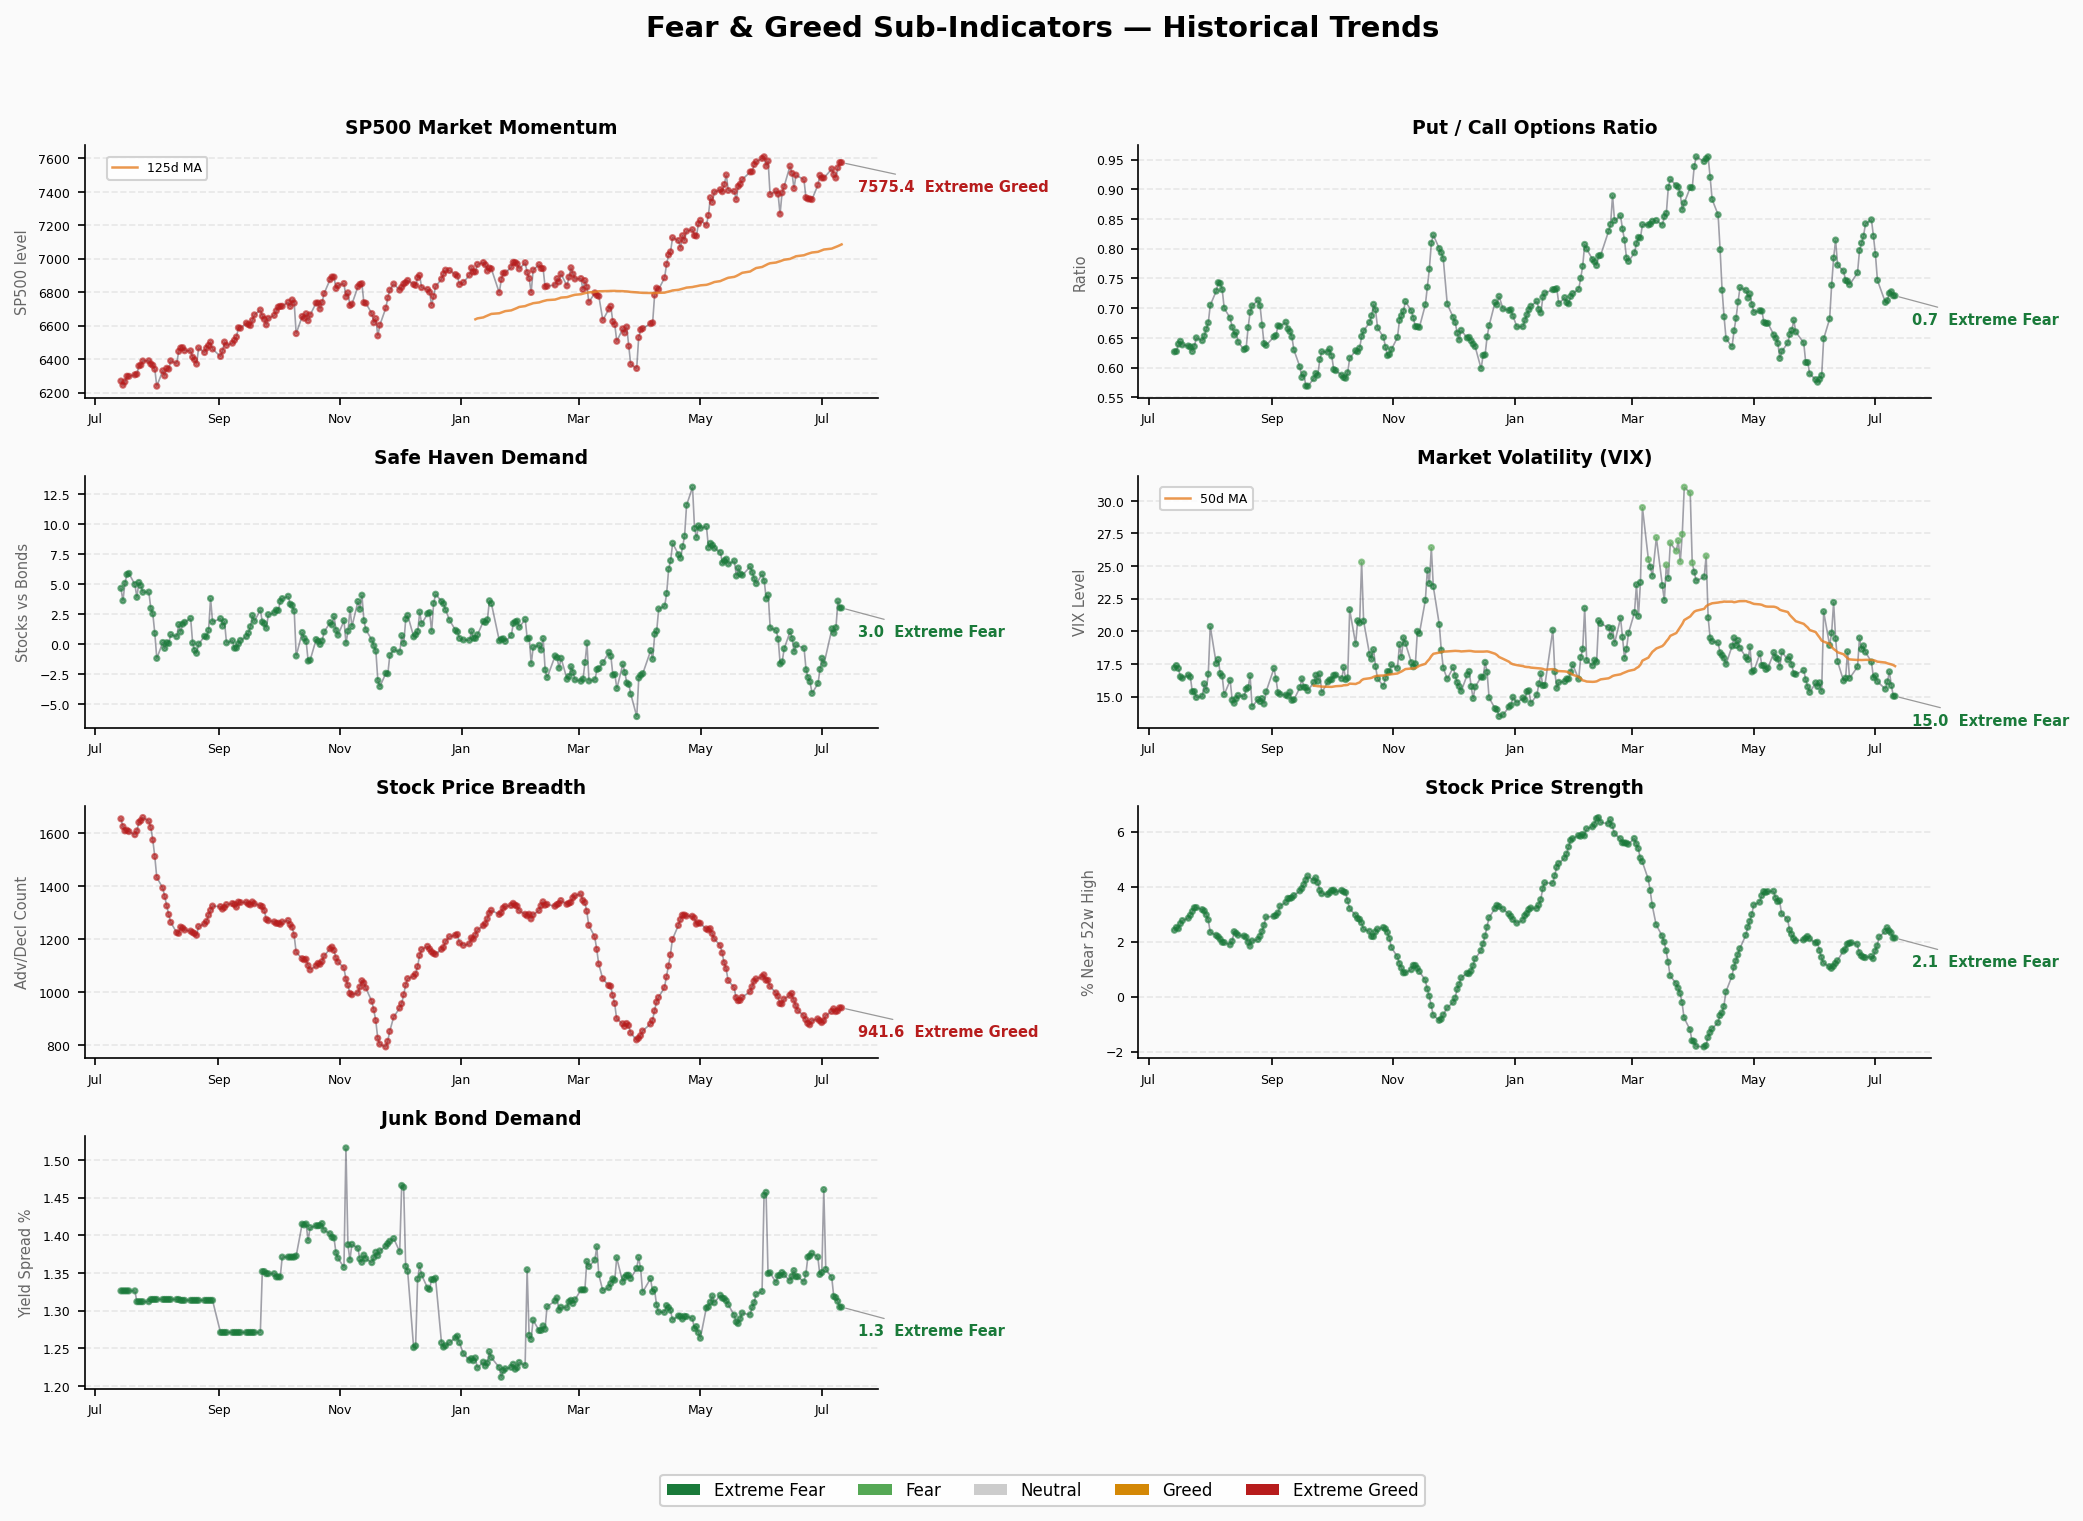
- Market Momentum (68 Greed): SPX at ~7,575, comfortably above its 125-day moving average. This is the primary pillar propping up the composite.
- Stock Price Strength (40.6 Fear): Fewer stocks hitting 52-week highs. The index is rising but individual stock participation is thinning — classic large-cap-driven rally.
- Stock Price Breadth (26.6 Fear): Advancing volume share is notably weak. Breadth deterioration is the weakest sub-indicator and the biggest concern — the index is climbing but most stocks aren’t following.
- Put/Call Options (56.6 Greed): P/C ratio at 0.72 is on the lower side, reflecting options market optimism. However, 56.6 is only “mild Greed,” not extreme.
- Market Volatility (50 Neutral): VIX at 15.03, in historically low territory. Low volatility is a double-edged sword — signaling both stability and complacency.
- Junk Bond Demand (37.6 Fear): Credit spreads marginally widening, reduced appetite for high-yield. Contrasts with FRED data showing HY OAS at 2.70% — the CNN indicator captures marginal changes, not absolute levels.
- Safe Haven Demand (67 Greed): Equities still offer a yield advantage over bonds; capital continues to favor risk assets.
Structural Divergence Analysis
Core Divergence: Momentum vs Breadth
The composite at 49.49 appears benign, but the internal structure is severely split:
- Momentum 68 vs Breadth 26.6: A 41.4-point gap, one of the widest in recent months. The SPX is making new highs on the back of a handful of mega-cap tech names while most stocks lag.
- This “index up, stocks flat” structure appeared in Q3 2025, preceding a ~10% correction in October.
Extreme Value Scan
- Breadth 26.6: Approaching “Extreme Fear” threshold (<25). If breadth continues to deteriorate this week, the composite could face renewed pressure.
- Momentum 68: Still below “Extreme Greed” (>75), not overheated.
- No other indicators at extremes (<20 or >80). The current story is structural divergence, not single-indicator extremes.
Directional Outlook
- Near-term (1-2 weeks): Cautiously bullish. Composite in uptrend, VIX low, options optimistic. But breadth issues may cap upside.
- Medium-term (1-3 months): Watchful. If breadth doesn’t improve (i.e., more stocks joining the rally), the current mega-cap tech-driven bounce is unsustainable. This week’s earnings season kickoff is key — can it catalyze small/mid-cap catch-up?
🚨 Crisis Precursor Dashboard
1. Credit Spreads
- HY OAS: 2.70% | 🟢 Normal
- IG OAS: 0.76% | 🟢 Normal
- Trend: Stable, no notable week-over-week change
- Analysis: Credit markets are pricing rationally with no systemic stress signals. HY OAS <3% indicates junk bond investors are pricing default risk modestly.
2. Yield Curve
- 10Y-2Y Spread: +35bp | 🟢 Normal/Flat
- 10Y: 4.54% | 2Y: 4.16% | 30Y: 5.05%
- Trend: Curve has normalized from deep inversion to slightly positive; reflation narrative pushing long-end yields higher
- Analysis: Curve normalization (no longer inverted) is positive, but the 30Y-10Y inversion (-51bp) deserves attention — markets lack confidence in long-term growth. The +35bp spread remains narrow, hinting the Fed may cut rates this year.
3. Margin Debt
- Latest: $1.304T (Apr 2026, FINRA monthly)
- YoY Change: Near all-time high ($1.31T in late 2025)
- Status: 🔴 Record territory
- Analysis: Margin debt at extreme levels reflects elevated retail leverage. Historically, margin debt peaks have led market corrections by 1-3 months. However, high leverage alone is not a sell signal — in a low-rate environment, elevated leverage can persist longer.
4. IPO Activity
- 2026 YTD: ~73 IPOs (Renaissance Capital)
- vs Same Period Last Year: Moderate increase
- Status: 🟡 Moderate
- Analysis: IPO activity is healthy, not showing 2021-style excess. However, the high proportion of tech IPOs is notable — if AI-related IPO valuations continue inflating, risks could build.
5. Fund Flows
- 2026 YTD ETF Net Inflows: $856B (record pace)
- Record?: Yes, surpassing 2025’s same-period total
- Status: 🔴 Euphoric
- Analysis: ETF inflows at record velocity, driven by passive investing and AI-themed ETFs. Massive inflows are normal in a bull market, but record inflows also mean “everyone is on board” — once sentiment shifts, redemption pressure could be unprecedented.
Overall Assessment
| Signal | Status | Risk Level |
|---|---|---|
| Credit Spreads (HY OAS) | 🟢 Normal | Low |
| Yield Curve (10Y-2Y) | 🟢 Normal/Flat | Low |
| Margin Debt | 🔴 Record High | Medium-High |
| IPO Activity | 🟡 Moderate | Low |
| ETF Fund Flows | 🔴 Record Pace | Medium |
Overall: 2🟢 / 1🟡 / 2🔴 — Current risk level: Moderate-High. Credit markets and the yield curve are not flashing warnings, but margin debt and ETF inflows are both at extremes, reflecting deep retail and passive participation. This is not an imminent crash signal, but it means the market is “crowded” — once a catalyst emerges (inflation surprise, AI earnings miss, geopolitical event), the correction magnitude could exceed expectations. Watch whether breadth improves and whether this week’s CPI data shifts rate expectations.