CNN Fear & Greed Analysis 2026-07-09
Composite at 42.2 in Fear territory; Breadth at Extreme Fear 23.2; Junk bond demand weak; Momentum dominates, tech crowding at dangerous levels; Credit spreads normal but margin debt and ETF inflows at record highs
📊 Composite Index
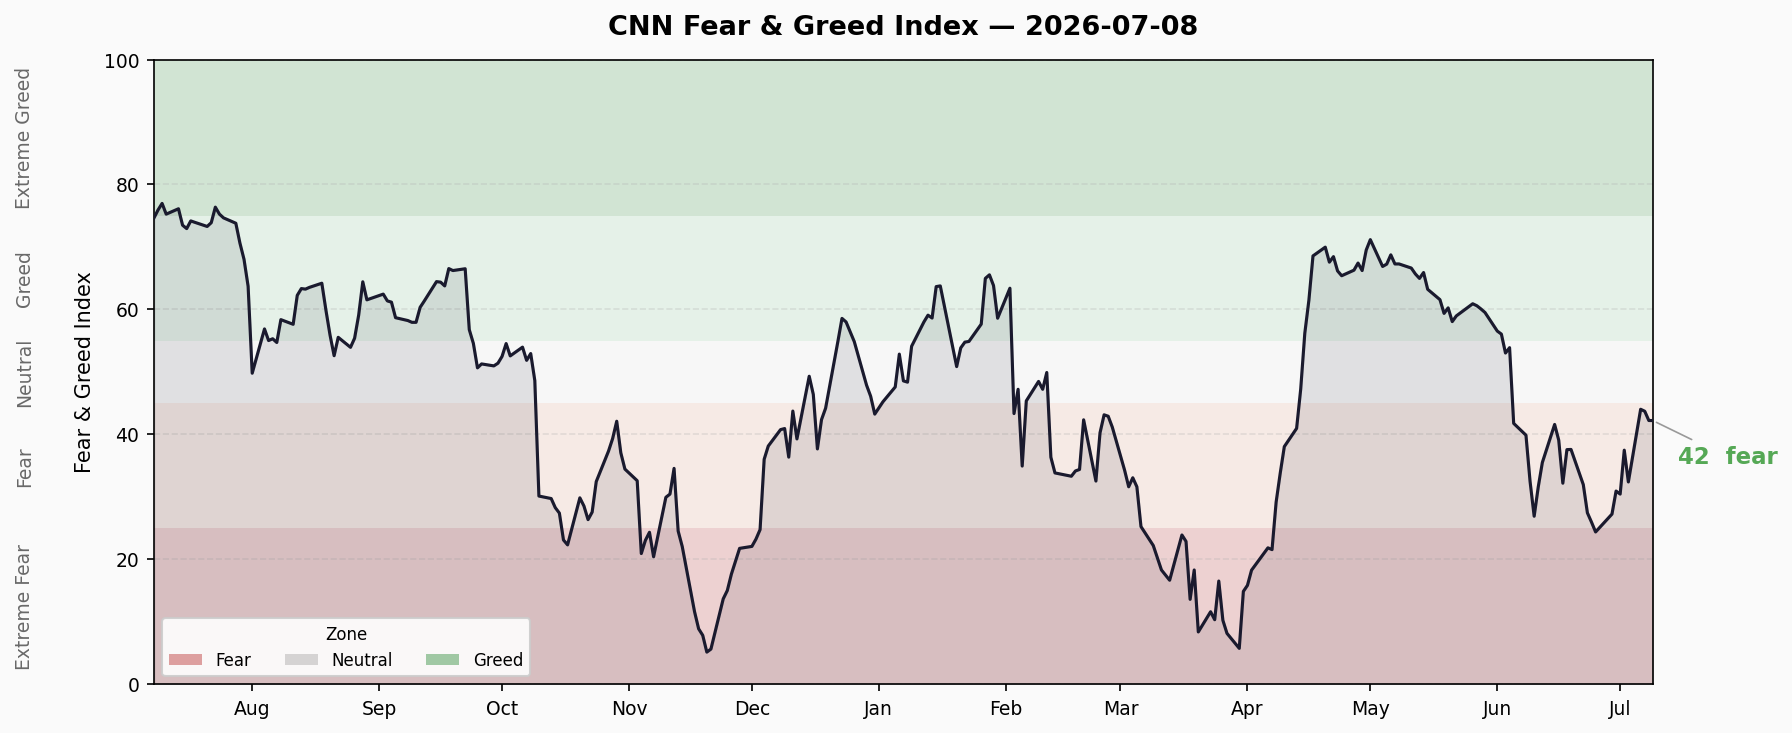
Today’s Fear & Greed Index: 42.2 — 😨 Fear
| Comparison | Value | Change |
|---|---|---|
| Previous Close | 43.0 | -0.8 |
| 1 Week Ago | 30.5 | +11.8 |
| 1 Month Ago | 39.9 | +2.3 |
| 1 Year Ago | 74.6 | -32.4 |
The composite remains in Fear territory (40-45) for a second consecutive day. Compared to one week ago (30.5, lower Fear boundary), there has been a notable recovery, but still ~3 points shy of the Neutral threshold (45). Versus one year ago at 74.6 (Greed), market sentiment has undergone a significant cooling.
10-day trend: oscillating narrowly within the Fear range from 44.3 on June 30 to the current 42.2, with no directional breakout.
🔬 Sub-Indicator Analysis
| Indicator | Score | Rating | Key Value | Direction |
|---|---|---|---|---|
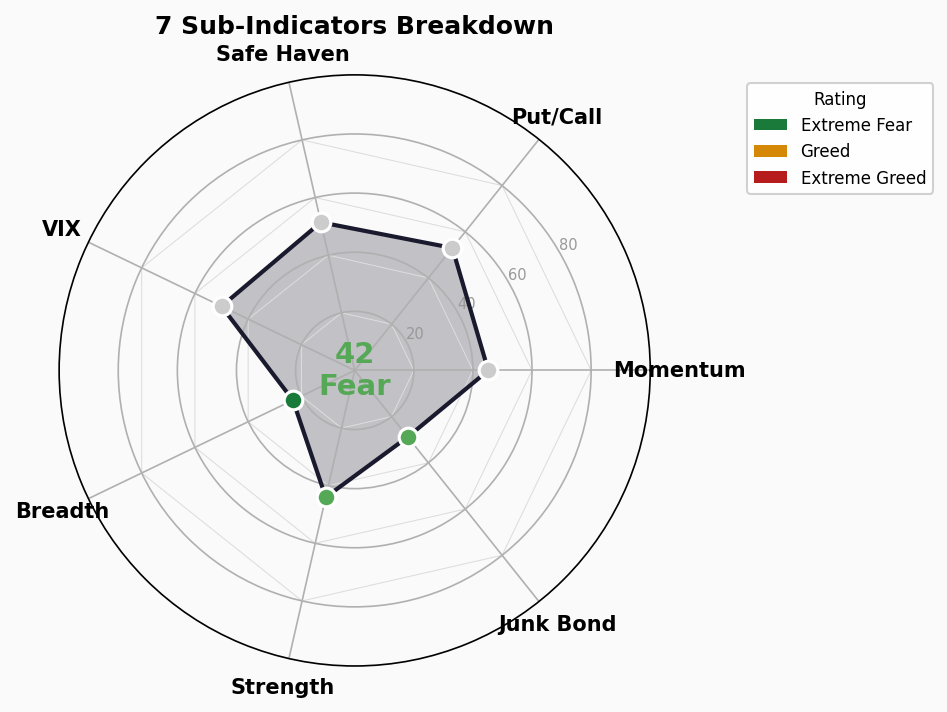
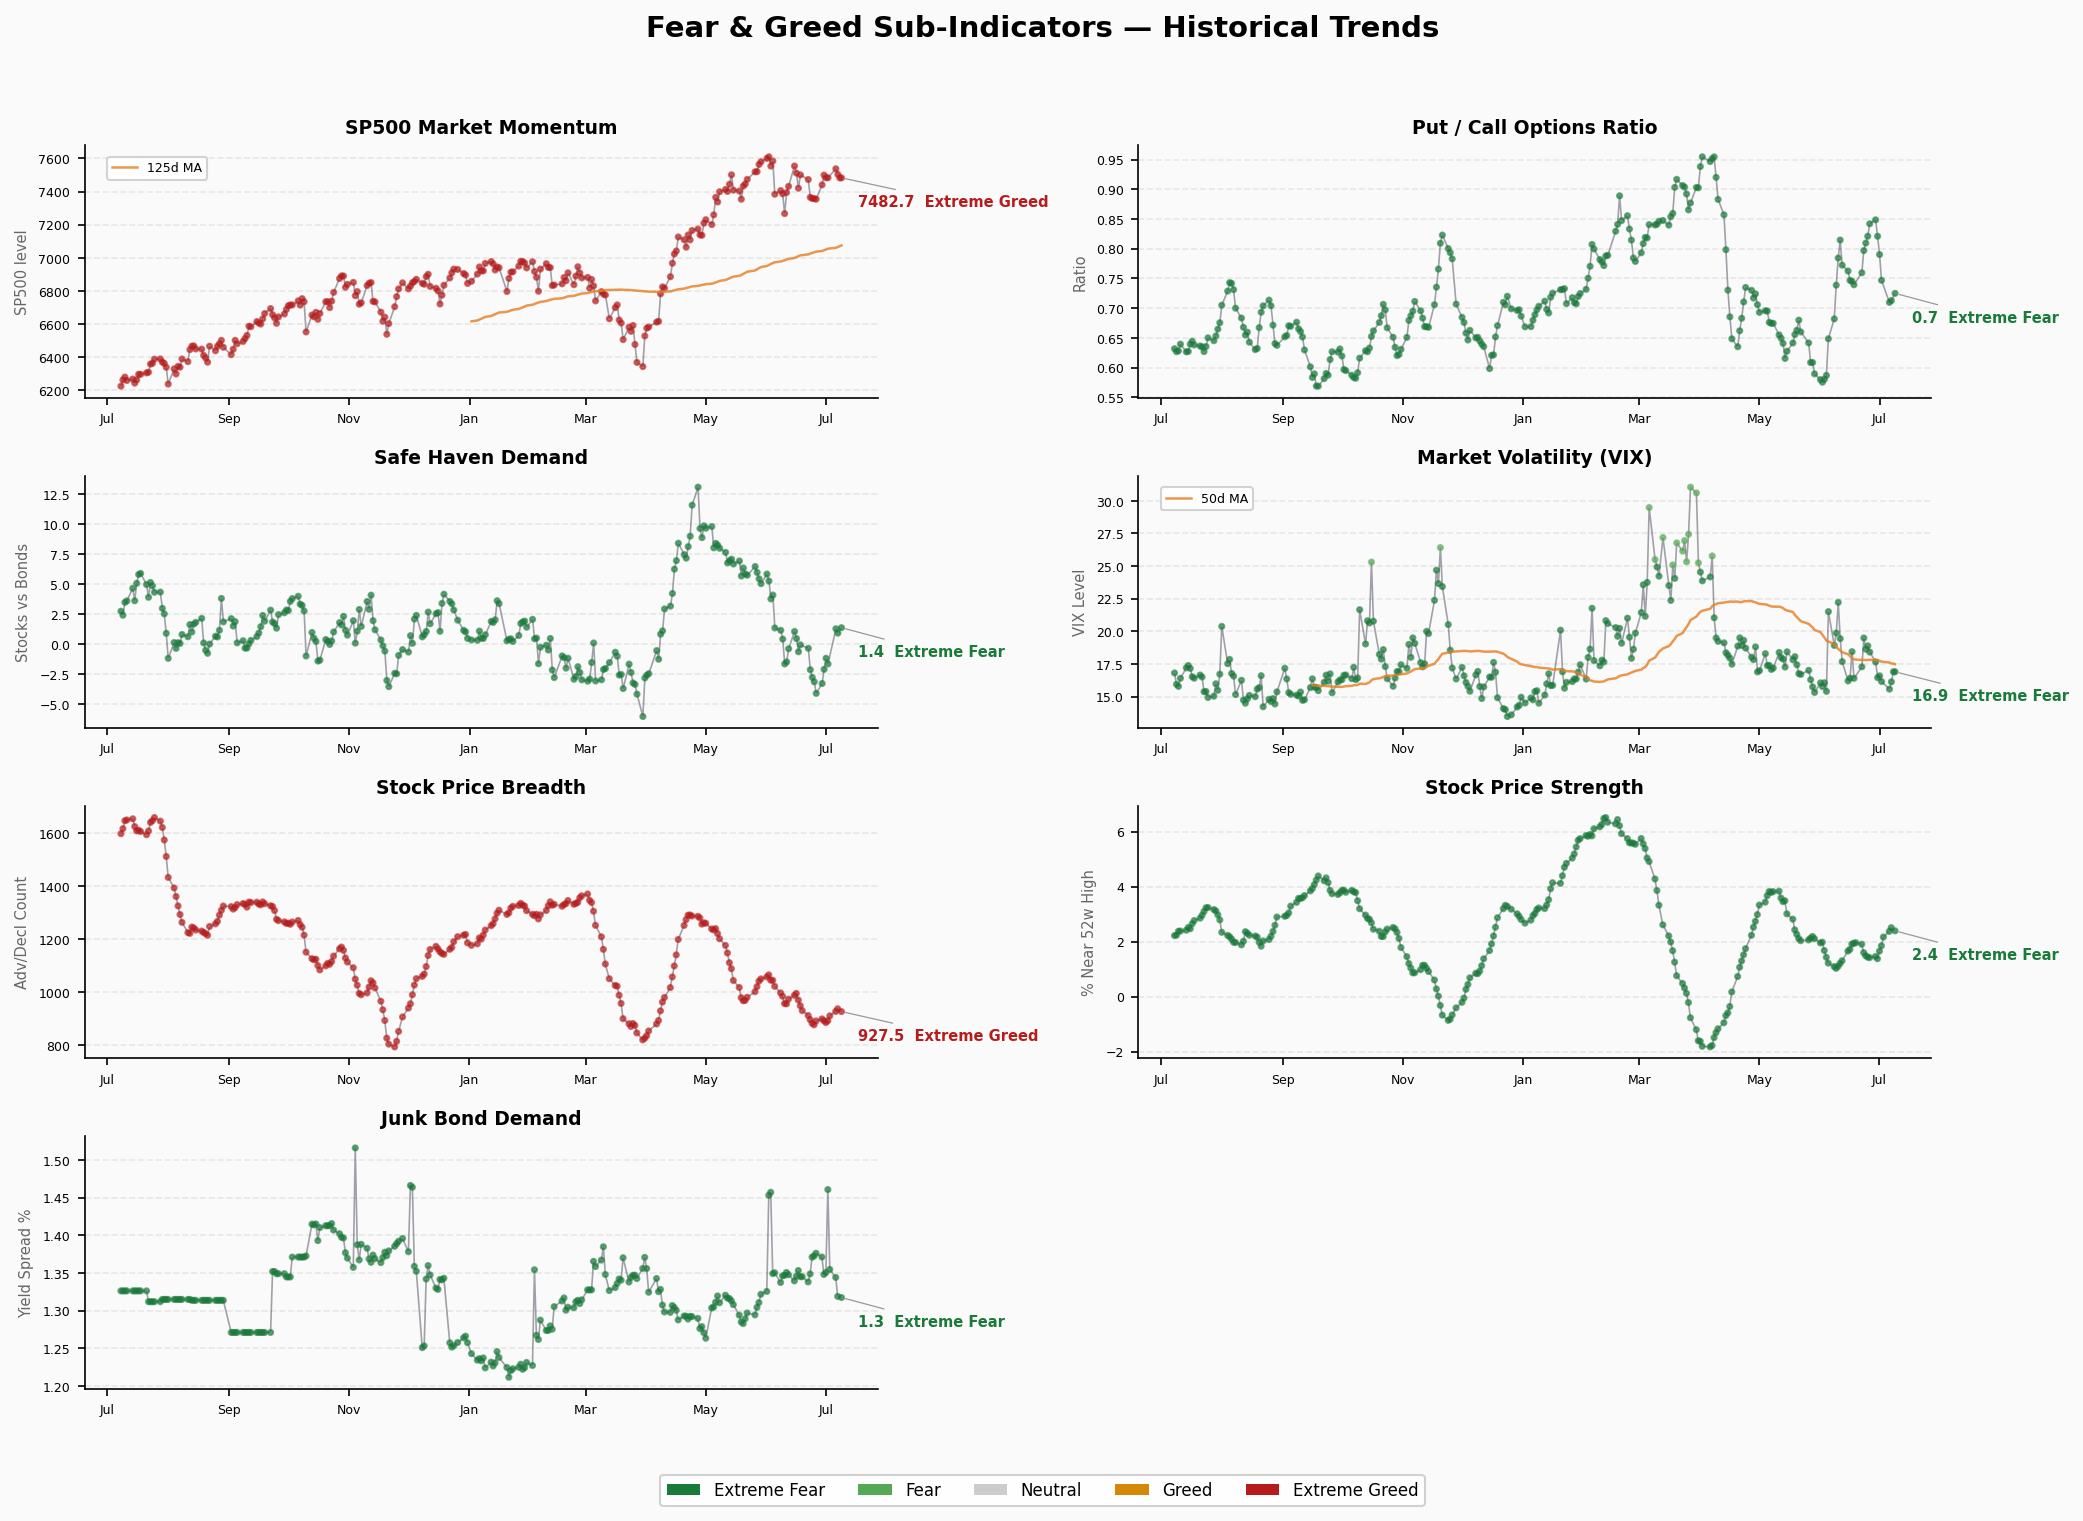
| Market Momentum (S&P500) | 45.2 | Neutral | SPX ~7483 | → |
| Stock Price Strength | 44.0 | Fear | 52W H/L Ratio 2.40 | ↓ |
| Stock Price Breadth | 23.2 | Extreme Fear | McClellan Osc ~927 | ↓ |
| Put/Call Ratio | 53.0 | Neutral | P/C 0.73 | → |
| Market Volatility (VIX) | 50.0 | Neutral | VIX 16.9 | → |
| Junk Bond Demand | 28.8 | Fear | Junk-Treasury Spread 1.32% | ↓ |
| Safe Haven Demand | 51.4 | Neutral | Stock-Bond Yield Gap 1.39% | → |
Key Signals:
- Breadth at 23.2 (Extreme Fear): The most extreme of all 7 sub-indicators. McClellan Oscillator reading is positive but low, meaning while the index level is rising, participation is narrow. A handful of mega-cap tech stocks are carrying the index while most individual names are struggling.
- Junk Bond Demand 28.8 (Fear): Credit markets are pricing risk cautiously. The junk-Treasury spread hasn’t reached warning levels, but the demand-side signal is weak, suggesting fixed-income investors are reducing risk appetite.
- VIX at 50 (Neutral): At 16.9, VIX sits in the lower-middle of its historical range, with the market not pricing in tail risk. However, this reading appears “too calm” against the backdrop of extreme fear in breadth — a divergence worth monitoring.
⚡ Structural Contradictions
Extreme Values (>80 or <20)
- None at extremes. All indicators remain within 20-80, though Breadth at 23.2 is approaching the Extreme Fear lower boundary.
Divergence Signals
- Breadth vs Index: S&P500 Momentum at Neutral (45.2), yet Breadth at Extreme Fear (23.2). This is the classic “stealth bear market” — the index is propped up by a few mega-caps while most stocks have already weakened. Historically, the longer this divergence persists, the more violent the eventual correction.
- VIX vs Breadth: VIX in Neutral, Breadth in Extreme Fear. The surface is calm (low volatility), but there are currents beneath (deteriorating breadth). This combination often precedes stormy conditions.
- Momentum Factor vs Value Factors: Factor Lab shows momentum ICIR at 2.70 (extreme strength) while value factors are systematically inverted. The market is completely driven by trends and flows, disconnected from fundamentals.
📈 Trend Assessment
- Time in Fear territory: 3rd consecutive trading day since dropping into Fear on July 7, after briefly touching the Neutral lower boundary in late June before retreating
- Direction: Short-term sideways with a slight downward bias; the medium-term Greed→Fear downtrend has not yet reversed
- Key levels: A break above 45 (Neutral) would signal sentiment repair; a drop below 35 (Fear lower bound) would trigger Extreme Fear warning
🚨 Crisis Precursor Dashboard
1. Credit Spreads
- HY OAS: 2.67% | 🟢 Normal
- IG OAS: 0.76% | 🟢 Normal
- Trend: Stable, narrow range of 2.5-2.7% over the past month
- Analysis: Credit markets are calm. Corporate default risk pricing remains in a healthy range. This is the most important “green light” on the dashboard — historically, HY OAS widened above 5% before every major drawdown.
2. Yield Curve
- 10Y-2Y Spread: +35bp | 🟢 Normal (mildly flat)
- 10Y: 4.55% | 2Y: 4.19% | 30Y: 5.05%
- Trend: Positive slope but modest; 10Y-30Y inverted by 50bp
- Analysis: The short-end curve has normalized (no longer inverted), but the 10Y-30Y inversion signals skepticism about long-term growth. The curve exhibits a “bear steepener” character — higher long-end rates reflecting inflation expectations and fiscal deficit concerns.
3. Margin Debt
- Latest: $1.304T (Apr 2026, FINRA monthly)
- YoY Change: At historical peak territory
- Status: 🔴 Record High
- Analysis: FINRA margin debt has been climbing steadily since 2024, currently holding above $1.3T. High leverage increases market vulnerability to corrections — forced liquidations amplify selling pressure. However, elevated margin debt alone is not a sell signal; new highs in margin debt are common during bull markets.
4. IPO Activity
- 2026 YTD: ~73 IPOs (Renaissance Capital)
- vs Same Period Last Year: Moderate increase
- Status: 🟡 Moderately Warm
- Analysis: IPO pace is steady but not at frenzy levels. Compared to the 2021 SPAC mania (1,000+ IPOs), the current market is relatively rational. However, watch the tech IPO mix — if a wave of unprofitable tech companies floods the market, caution is warranted.
5. Fund Flows
- 2026 YTD ETF Net Inflows: ~$856B (record pace)
- Record Status: Yes, exceeding 2024-2025 comparable periods
- Status: 🔴 Frenzy
- Analysis: ETF inflows are surging at an unprecedented rate. The self-reinforcing passive investing loop — inflows → push up index heavyweights → indices rise → attract more inflows. When this positive feedback loop reverses, the damage can be severe.
Overall Assessment
| Signal | Status | Risk Level |
|---|---|---|
| Credit Spreads (HY OAS) | 🟢 Normal | Low |
| Credit Spreads (IG OAS) | 🟢 Normal | Low |
| Yield Curve (10Y-2Y) | 🟢 Mildly Flat | Low |
| Margin Debt | 🔴 Record High | Medium |
| IPO Activity | 🟡 Moderately Warm | Low |
| ETF Inflows | 🔴 Record Pace | Medium-High |
Overall: 3 🟢 / 1 🟡 / 2 🔴 — Credit markets and the yield curve are not sounding alarms, but the extreme optimism in fund flows (record margin debt + record ETF inflows) warrants vigilance. This is not a “crash tomorrow” signal, but rather a warning that if a catalyst emerges, the correction will likely be deeper than normal. The primary risk today is not deteriorating fundamentals but the reversal of crowded trades — when everyone is sitting on the same side, the exits are narrow.