CNN Fear & Greed Analysis 2026-07-08
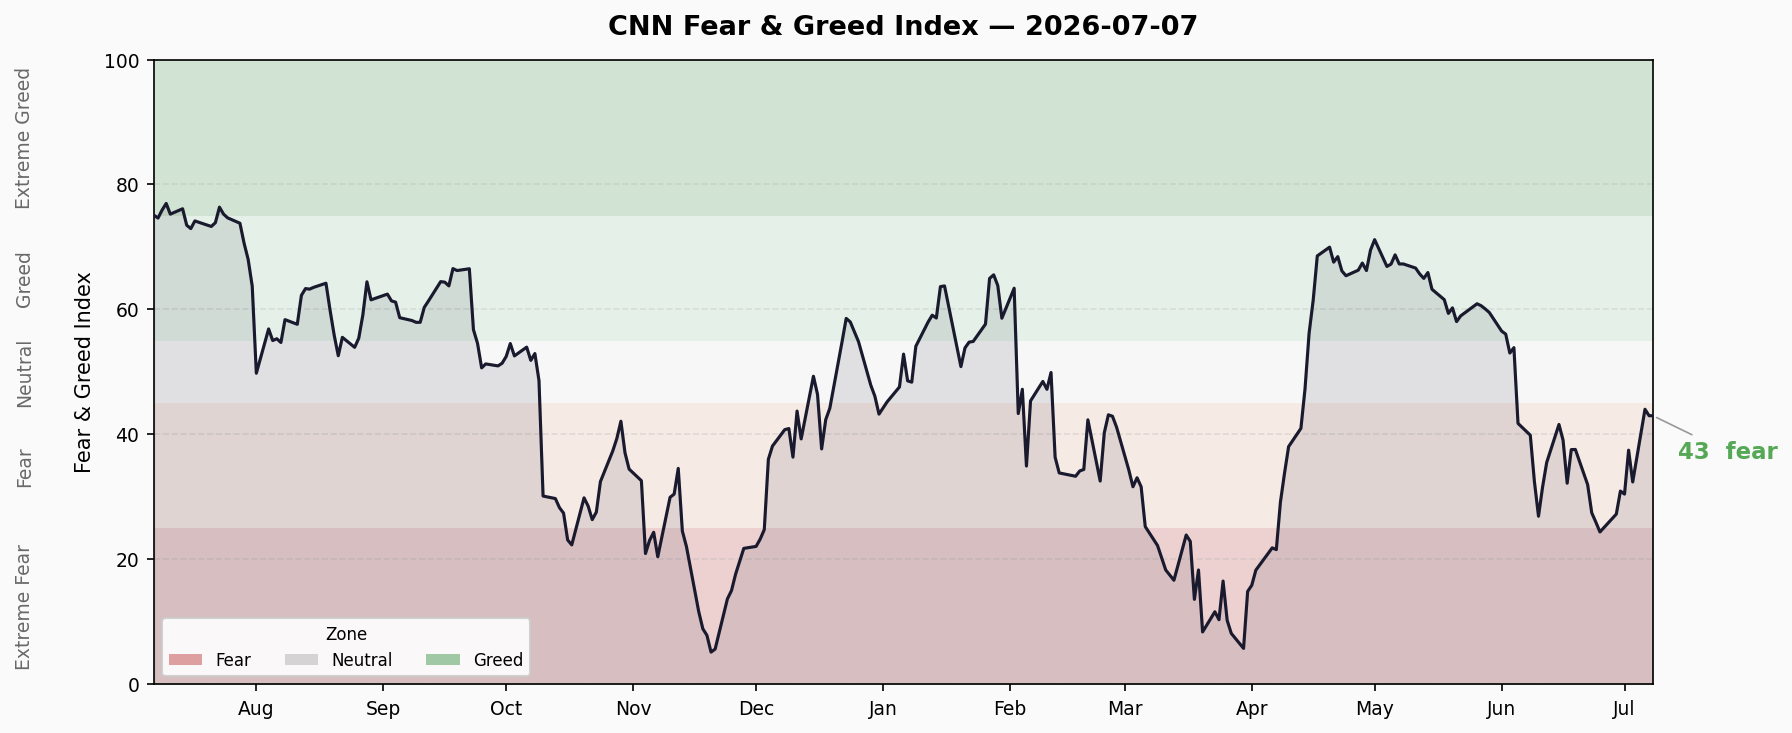
Composite 43 (Fear), structural divergence between Extreme Fear breadth (25) and Greedy options (59); credit spreads normal but margin debt and ETF inflows at record highs
Composite Index
| Metric | Value |
|---|---|
| Latest Score | 43 — Fear |
| Previous Close | 43.94 (nearly flat) |
| 1 Week Ago | 30.94 (Fear → significant recovery) |
| 1 Month Ago | 41.77 (Fear → slight improvement) |
| 1 Year Ago | 75.09 (Extreme Greed → massive pullback) |
Composite at 43, sitting in the middle of Fear territory. A significant recovery from 30.94 one week ago (+12 pts), but largely unchanged from 41.77 a month ago — sentiment has been consolidating in mid-Fear over the past month.
Looking at the two-month trajectory: the index climbed from ~30 in early June to the current ~43, slow but steady. A year ago the index was at 75 (Extreme Greed) — sentiment has undergone substantial de-frothing.
Seven Sub-Indicators
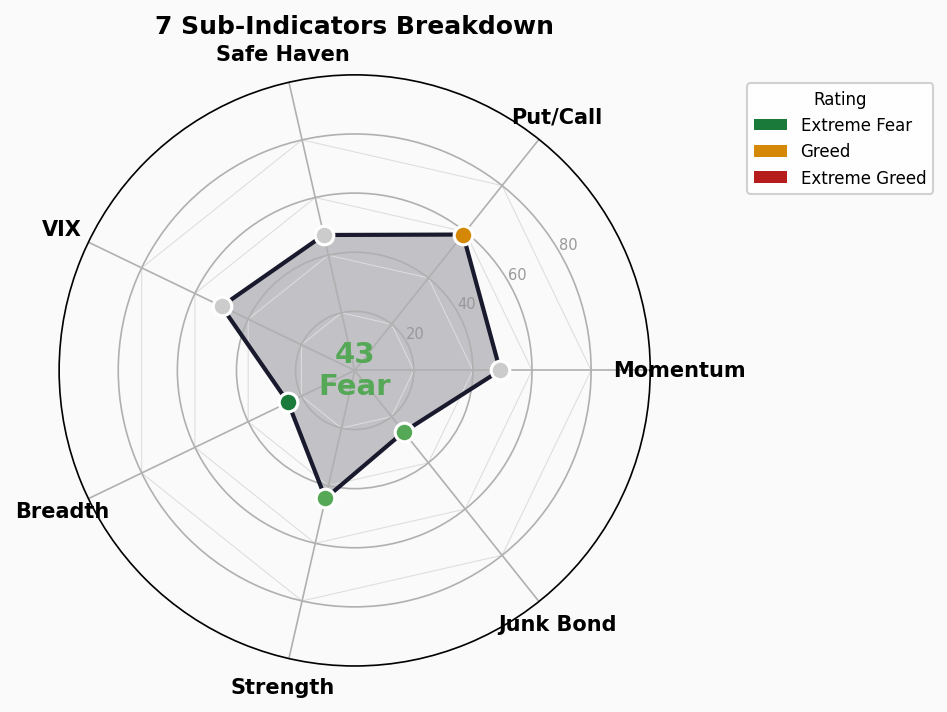
| # | Indicator | Score | Rating | Direction |
|---|---|---|---|---|
| 1 | Stock Price Breadth | 25 | 🔵 Extreme Fear | ↓ Very narrow breadth |
| 2 | Junk Bond Demand | 26.6 | 🔵 Fear | ↓ Weak junk demand |
| 3 | Stock Price Strength | 44.4 | 🔵 Fear | → Below-average strength |
| 4 | Safe Haven Demand | 47 | ⚪ Neutral | → Neutral haven demand |
| 5 | Market Momentum (S&P 500) | 49.2 | ⚪ Neutral | → Neutral momentum |
| 6 | Market Volatility (VIX) | 50 | ⚪ Neutral | → Neutral VIX |
| 7 | Put/Call Options | 58.8 | 🟢 Greed | ↑ Options traders bullish |
Indicator Details
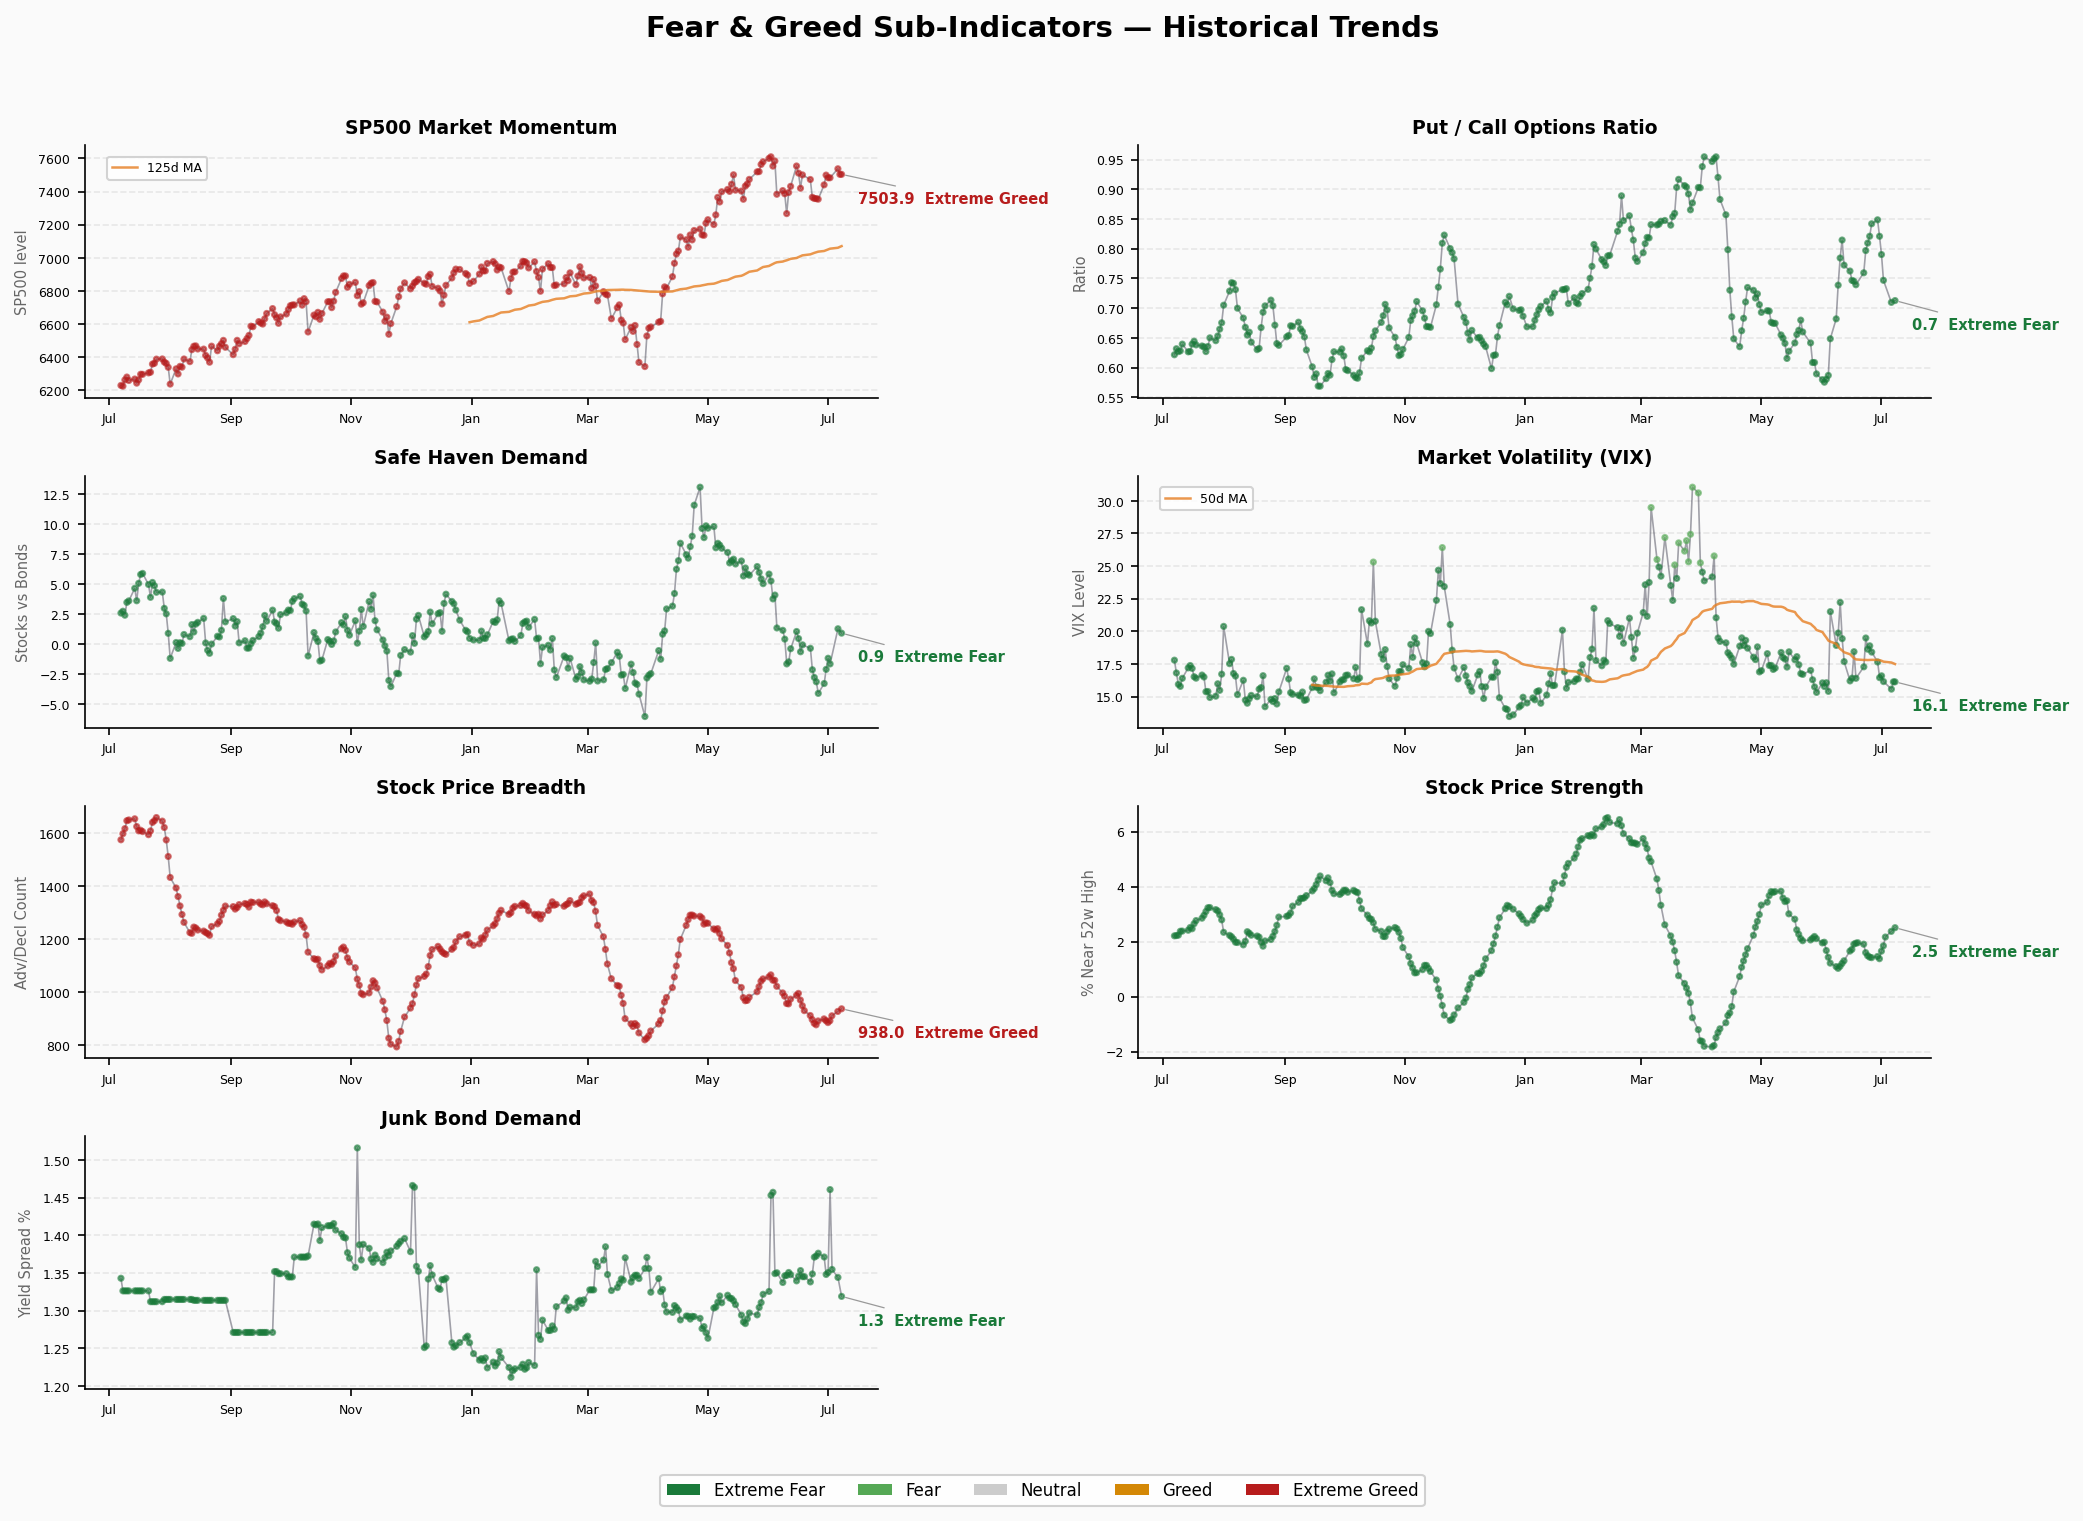
Stock Price Breadth (25, Extreme Fear): Market breadth at extreme fear levels — most stocks are not participating in the rally. NYSE 52-week high/low ratios remain very low, with many individual stocks still basing or declining.
Junk Bond Demand (26.6, Fear): Spreads between high-yield and investment-grade bonds are widening. The yield premium on junk bonds vs Treasuries is elevated, indicating low risk appetite in credit markets — consistent with equity breadth fear.
Stock Price Strength (44.4, Fear): Measures individual stock positions relative to 52-week highs. At 44.4, near the lower end of Fear, most stocks remain significantly below their 52-week highs.
Safe Haven Demand (47, Neutral): Neutral — stock vs Treasury performance shows no extreme divergence. Capital is neither panic-buying Treasuries nor aggressively chasing stocks.
Market Momentum (49.2, Neutral): S&P 500 momentum at neutral. SPX at ~7504, deviation from 125-day moving average within normal range.
Market Volatility (50, Neutral): VIX at ~16.13, neutral-low. Options markets are pricing modest implied volatility — no panic premium.
Put/Call Options (58.8, Greed): The sole Greed signal. Put/call ratio at 0.71, options traders favoring calls over puts — speculative optimism.
Structural Divergence Analysis
Extreme Values
- Stock Price Breadth @ 25: The only Extreme Fear reading. Breadth is extremely narrow, with gains concentrated in few names.
- No indicators in Extreme Greed (>80).
Divergence Signals
- Breadth (25) vs Put/Call (59): Extreme fear in breadth vs greed in options — a 34-point gap. Classic “index held up by heavyweights while options traders only look at the index, not breadth.”
- Junk Bond (26.6) vs VIX (50): Credit market fear vs volatility neutrality. Junk bond investors are hedging while equity options markets show no concern.
Overall Structure
Among seven sub-indicators: 1 Extreme Fear, 2 Fear, 3 Neutral, 1 Greed. The structure reveals “underlying fear, surface neutrality” — breadth and junk bonds are fearful, while VIX and momentum maintain neutral appearances.
Trend Assessment
The composite has been steadily recovering since bottoming in Extreme Fear in late May (as low as 5-8). After entering mid-Fear in late June, it has been consolidating. At 43, it sits near the upper boundary of Fear (25-45), just 2 points from Neutral.
A breakout above 45 into Neutral would confirm sentiment repair entering a new phase. However, Breadth and Junk Bond Demand remain depressed, suggesting the recovery foundation is not yet solid.
Key watchpoint: Whether Breadth can recover from Extreme Fear (25) into Fear territory (>25) will be the critical short-term sentiment signal. If breadth remains stuck in Extreme Fear while the index consolidates, watch for intensifying divergence — “index flat, stocks falling.”
🚨 Crisis Precursor Dashboard
1. Credit Spreads
- HY OAS: 2.72% | 🟢 Normal
- IG OAS: 0.75%
- Trend: Stable within normal range
- Analysis: Credit spreads at healthy levels. HY OAS 2.72% well below the 3% warning threshold, IG OAS 0.75% well below 1%. Credit markets are pricing extremely low default risk, contrasting with the Fear reading in Junk Bond Demand — the latter reflects relative preference rather than absolute spread levels.
2. Yield Curve
- 10Y-2Y Spread: +36bp | 🟢 Normal/Flat
- 10Y: 4.48% | 2Y: 4.13% | 30Y: 4.99%
- Trend: Positively sloped but flat
- Analysis: 10Y-2Y spread at +36bp is in normal territory, having recovered from prior inversion. But +36bp is still narrow, reflecting cautious long-term growth expectations. 30Y-10Y spread at +51bp shows term premium at the long end.
3. Margin Debt
- Latest: $1.304T (Apr 2026)
- YoY Change: All-time high territory
- Status: 🔴 All-time high territory
- Analysis: FINRA margin debt at $1.304T is in record territory, indicating elevated leverage across retail and institutional accounts. High margin debt itself is not a crash signal, but forced liquidations would amplify downside if the market turns. One of the most noteworthy caution signals.
4. IPO Activity
- 2026 YTD: ~73 (per Renaissance Capital)
- vs Prior Year: Moderate pace
- Status: 🟡 Moderate
- Analysis: ~73 IPOs YTD, not aggressive compared to 2025’s full-year 347. The IPO market shows none of the 2021 frenzy (1,035 IPOs). Many listings are SPACs, suggesting primary markets remain rational.
5. Fund Inflows
- 2026 YTD ETF Net Inflows: $856B (record)
- Record Pace: Yes
- Status: 🔴 Record inflows
- Analysis: H1 2026 ETF net inflows of $856B set an all-time record. Money is pouring into passive vehicles at unprecedented speed. This explains index resilience despite poor breadth, but also means capital is highly concentrated in a small number of large-cap ETF constituents. A redemption wave could create non-trivial liquidity shocks.
Overall Assessment
| Signal | Status | Risk Level |
|---|---|---|
| Credit Spreads (HY OAS) | 🟢 Normal | Low |
| Yield Curve (10Y-2Y) | 🟢 Normal/Flat | Low |
| Margin Debt | 🔴 Record High | Medium-High |
| IPO Activity | 🟡 Moderate | Low |
| ETF Inflows | 🔴 Record | Medium-High |
Overall: 2 🟢 / 1 🟡 / 2 🔴 — Credit and rates are safe, but capital structure has two red flags. Record margin debt + record ETF inflows mean both leverage and passive concentration are at extremes. This is not a traditional “imminent crash” signal (credit spreads remain healthy), but if a correction triggers, the deleveraging + passive redemption feedback loop could amplify the drawdown.