CNN Fear & Greed Analysis 2026-07-06
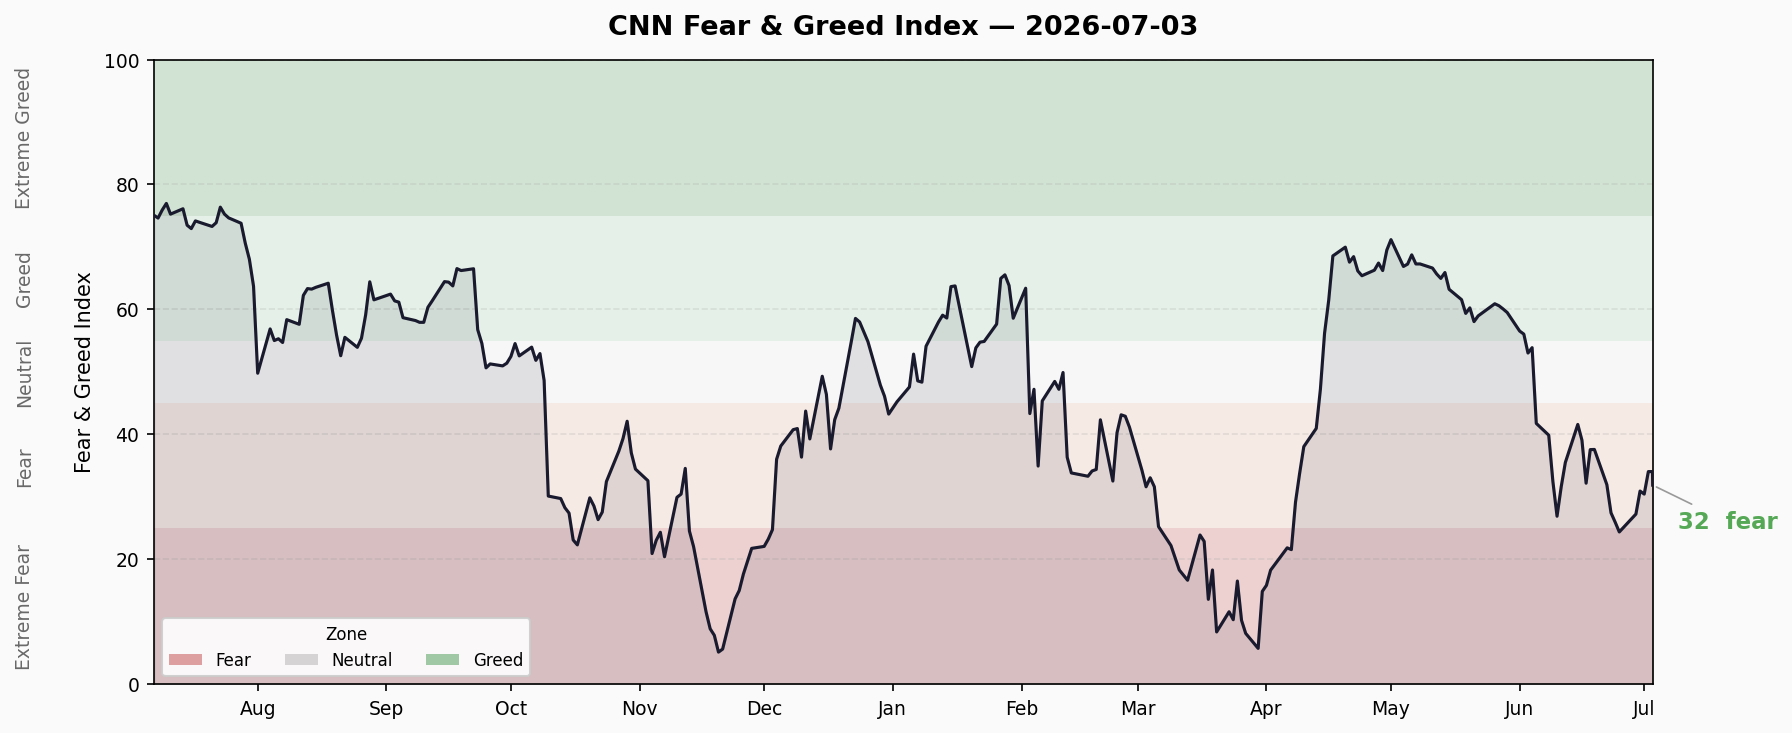
Composite score 31.9, 11th day in Fear zone; Junk Bond Demand hits floor at 0.8, Market Breadth at 19.4 Extreme Fear; credit spreads normal but margin debt & ETF inflows at record highs
Composite Index
| Metric | Value |
|---|---|
| Latest Score | 31.9 |
| Rating | 😨 Fear |
| Previous Close | 31.4 |
| 1 Week Ago | 25.1 (Fear) |
| 1 Month Ago | 53.0 (Neutral) |
| 1 Year Ago | 77.6 (Extreme Greed) |
Trend: The composite has now spent 11 consecutive days in the Fear zone (Jun 23 – Jul 3), briefly touching Extreme Fear at 24.4 on Jun 25 before recovering to 31.9. Compared to Neutral territory (53.0) a month ago and Extreme Greed (77.6) a year ago, the sentiment shift is dramatic.
7 Sub-Indicator Breakdown
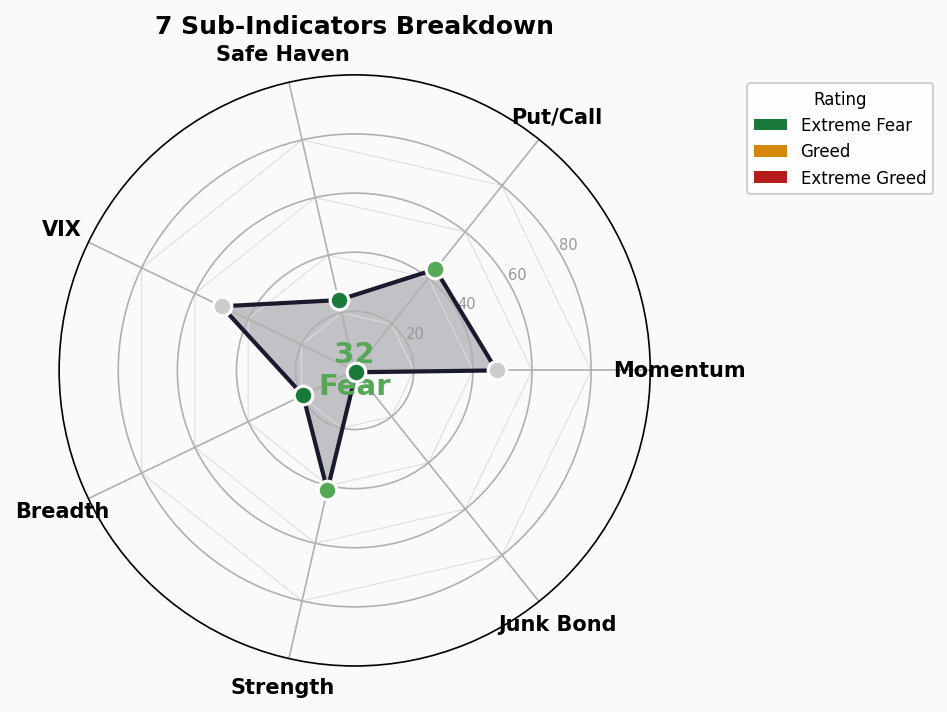
| Indicator | Score | Rating | Raw Value | Note |
|---|---|---|---|---|
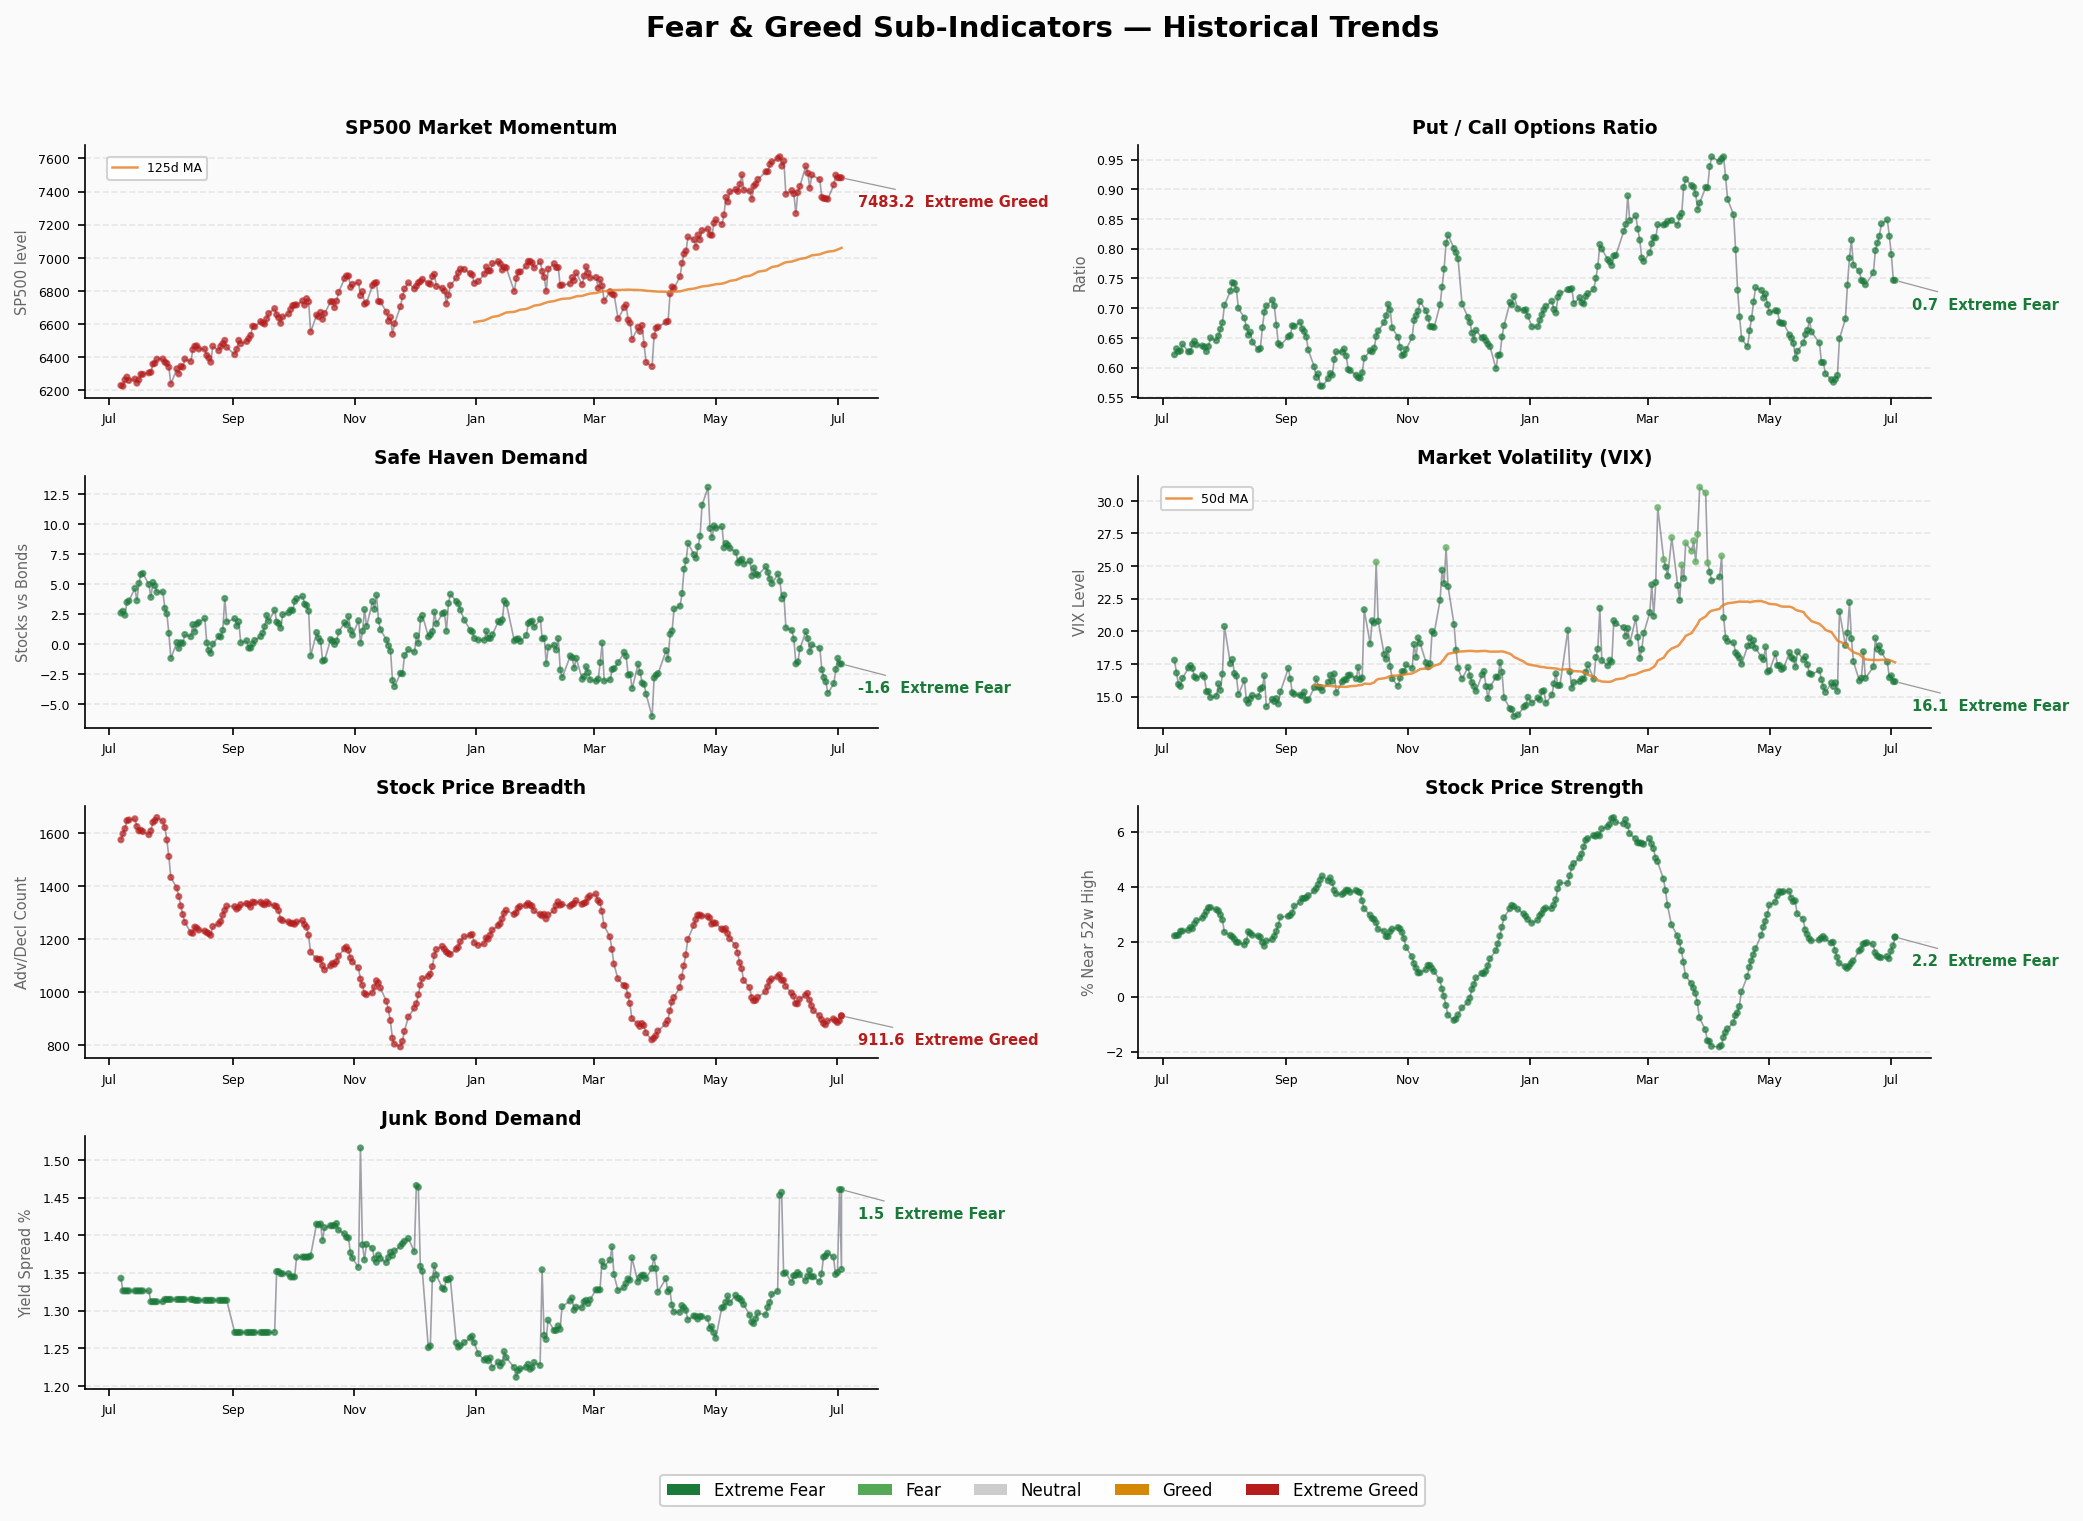
| Market Momentum (SP500) | 48 | Neutral | S&P 7483 | Index near highs, momentum neutral |
| Market Momentum (SP125) | 48 | Neutral | SP125 7055 | Same as SP500 |
| Stock Price Strength | 41.6 | Fear | 52W High/Low Ratio | Individual stock strength diverging |
| Stock Price Breadth | 19.4 | Extreme Fear | McClellan | 🔴 Decliners far outnumber advancers |
| Put/Call Options | 43.8 | Fear | P/C 0.75 | Defensive positioning |
| VIX Volatility | 50 | Neutral | VIX 16.15 | Moderate, no panic |
| VIX 50-Day MA | 50 | Neutral | VIX MA50 17.68 | VIX below its MA, manageable |
| Junk Bond Demand | 0.8 | Extreme Fear | Credit spread widening | 🔴 Extreme sell-off in junk bonds |
| Safe Haven Demand | 24.4 | Extreme Fear | Stocks vs Treasuries | 🔴 No flight to safety |
Structural Divergence Analysis
🔴 Extreme Values (>80 or <20)
- Junk Bond Demand 0.8 — The most glaring number on the dashboard. Extreme selling in high-yield credit signals the credit market is pricing in risk. The last time we saw readings at this level was the 2022 bear market bottom.
- Market Breadth 19.4 — Extreme Fear. The number of advancing stocks is far below decliners. The S&P 500 remains elevated at 7483, but this is a hollow rally propped up by a handful of mega-caps.
- Safe Haven Demand 24.4 — Money is not fleeing to Treasuries, suggesting this isn’t classic “risk-off” but rather “risk-rotation” between sectors.
⚠️ Divergence Signals
- Index Highs vs Junk Bond Floor — S&P 500 near 7483 while junk bond demand collapses to 0.8. This is the most dangerous divergence: equity markets haven’t yet priced in what the credit market is signaling.
- VIX Neutral vs Breadth Extreme Fear — VIX at 16.15 looks calm, but market breadth has severely deteriorated. VIX reflects mega-cap implied vol; breadth reflects total market participation. Mega-caps are holding up the index while most stocks are declining.
- Momentum Neutral vs Sentiment Fear — Momentum indicators (48/48) show neutrality, but sentiment indicators (breadth 19.4, junk bonds 0.8) are in panic territory. Momentum is a lagging indicator; sentiment leads.
Trend Outlook
- Duration in zone: Fear for 11 consecutive days, briefly touching Extreme Fear (24.4). Historically, Fear zone stays beyond two weeks often precede directional market moves.
- Key pivot: The critical variable is whether junk bond demand recovers. If it rebounds from 0.8, credit market confidence is returning and Fear may ease. If it stays in single digits or worsens, watch for credit events transmitting to equities.
- Near-term: The composite recovering from 24.4 to 31.9 shows marginal improvement. But structural divergences (index highs vs deteriorating breadth/junk bonds) remain unresolved. Maintain Fear assessment; a retest of Extreme Fear cannot be ruled out.
🚨 Crisis Precursor Dashboard
1. Credit Spreads
- HY OAS: 2.75% | 🟢 Normal
- IG OAS: 0.75% | 🟢 Normal
- Trend: Stable, no recent spike
- Analysis: Credit spreads remain in healthy territory. HY OAS <3% suggests the high-yield market isn’t pricing systemic risk. However, note the contradiction with CNN’s Junk Bond Demand at 0.8 — the CNN indicator measures relative momentum while OAS measures absolute spread levels. Momentum shifts before levels do.
2. Yield Curve
- 10Y-2Y Spread: +35bp | 🟢 Normal/Flat
- 10Y: 4.48% | 2Y: 4.17% | 30Y: 4.97%
- Trend: Curve maintaining positive but shallow spread
- Analysis: 10Y-2Y has exited inversion and remains in shallow positive territory. 10Y-30Y at -49bp (long-end inversion). The curve is pricing “high short rates + cautious long-term growth.” Not a crisis signal, but not expansionary either.
3. Margin Debt
- Latest: $1.304T (Apr 2026)
- YoY Change: All-time high territory
- Status: 🔴 Record High
- Analysis: FINRA margin debt has breached $1.3T, at the highest level in history. Elevated margin debt means high market leverage — if the market turns, forced deleveraging could amplify downside. This is one of the most concerning systemic risk indicators.
4. IPO Count
- 2026 YTD: ~192 IPOs (as of Jul 2)
- vs Last Year: 2025 full year 347; 2026 H1 192 annualizes to ~380, slightly ahead of last year’s pace
- Status: 🟡 Elevated
- Analysis: IPO activity remains active but not euphoric. Notably, SPAC blank-check companies account for a large share; high-quality operating company IPOs remain limited. SpaceX (SPCX) listing on Jun 12 was the quarter’s highlight.
5. Fund Flows
- 2026 YTD ETF Net Inflows: $856B (record)
- All-Time Record: Yes
- Status: 🔴 Euphoric
- Analysis: ETF inflows are surging at a record pace — H1 2026 inflows already exceed prior full-year totals. This is a flow-driven rally, which means if flows reverse, the market loses its most important marginal buyer.
Overall Assessment
| Signal | Status | Danger Level |
|---|---|---|
| Credit Spreads (HY OAS) | 🟢 Normal | Low |
| Credit Spreads (IG OAS) | 🟢 Normal | Low |
| Yield Curve (10Y-2Y) | 🟢 Normal/Flat | Low |
| Margin Debt | 🔴 Record High | High |
| IPO Pace | 🟡 Elevated | Medium |
| ETF Inflows | 🔴 Record | High |
| FNG Junk Bond Demand | 🔴 0.8 Floor | High |
| FNG Market Breadth | 🔴 19.4 Extreme Fear | High |
Composite: 2🟢 / 1🟡 / 5🔴 — Calm surface, turbulent undercurrents.
Hard indicators like credit spreads and yield curve remain healthy, but heat indicators like margin debt and ETF inflows are at extremes. Combined with deteriorating FNG sentiment in junk bonds and breadth, the market exhibits classic “late-cycle bull” characteristics: elevated indices, deteriorating internals, high leverage, fragile sentiment. This isn’t a 2008-style credit crisis precursor — it’s more like the 2022-style high-valuation deleveraging risk buildup.