CNN Fear & Greed Sentiment Analysis 2026-07-05
Composite 31.89 Fear, 10th consecutive day in fear territory; Junk Bond Demand 0.8 Extreme Fear, Stock Price Breadth 19.4 Extreme Fear; credit spreads normal but margin debt at all-time highs
Composite Index
| Metric | Value |
|---|---|
| Latest Score | 31.89 |
| Rating | 🔴 Fear |
| Previous Close | 31.43 |
| 1 Week Ago | 25.11 (Extreme Fear) |
| 1 Month Ago | 53.03 (Neutral) |
| 1 Year Ago | 77.63 (Extreme Greed) |
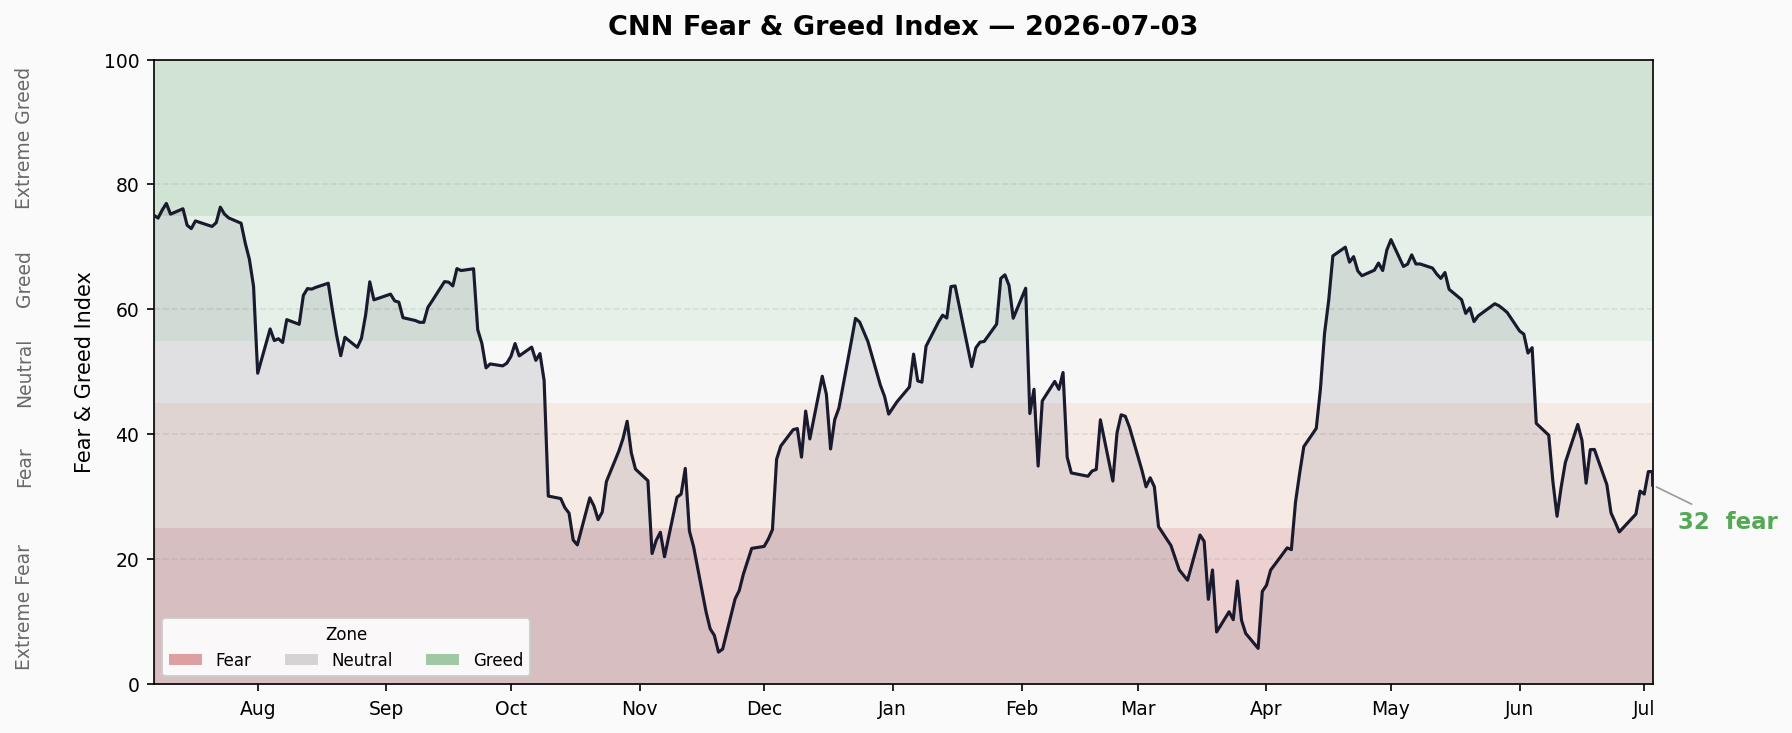
The composite index sits at 31.89, marking the 10th consecutive trading day in Fear territory (25-45). Over the past 10 days, the index dipped as low as 24.4 (Extreme Fear) before rebounding weakly to ~32, still firmly in the mid-Fear range. Compared to one month ago at 53 (Neutral/Greed) and one year ago at 78 (Extreme Greed), market sentiment has deteriorated dramatically in a single month.
Last 10 trading days: 24.4 → 25.1 → 27.3 → 30.9 → 30.5 → 34.1 → 34.1 → 31.9. Pattern shows a “V-bottom bounce” that is losing momentum, failing to break out of the Fear zone.
Seven Sub-Indicator Breakdown
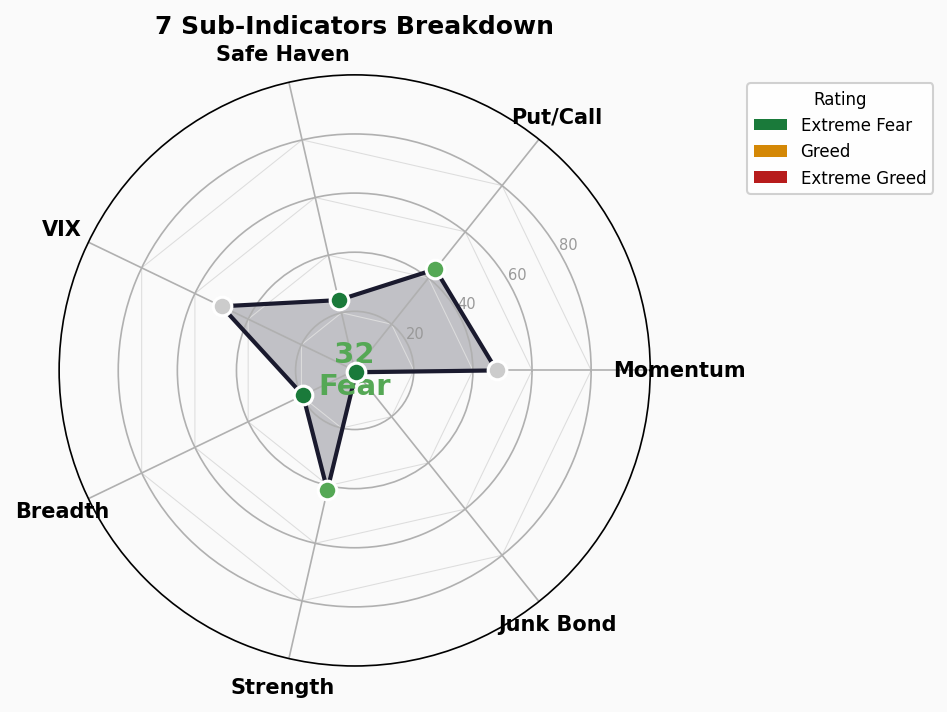
1. Market Momentum — S&P 500 vs 125-day MA
- Score: 48 | Rating: Neutral
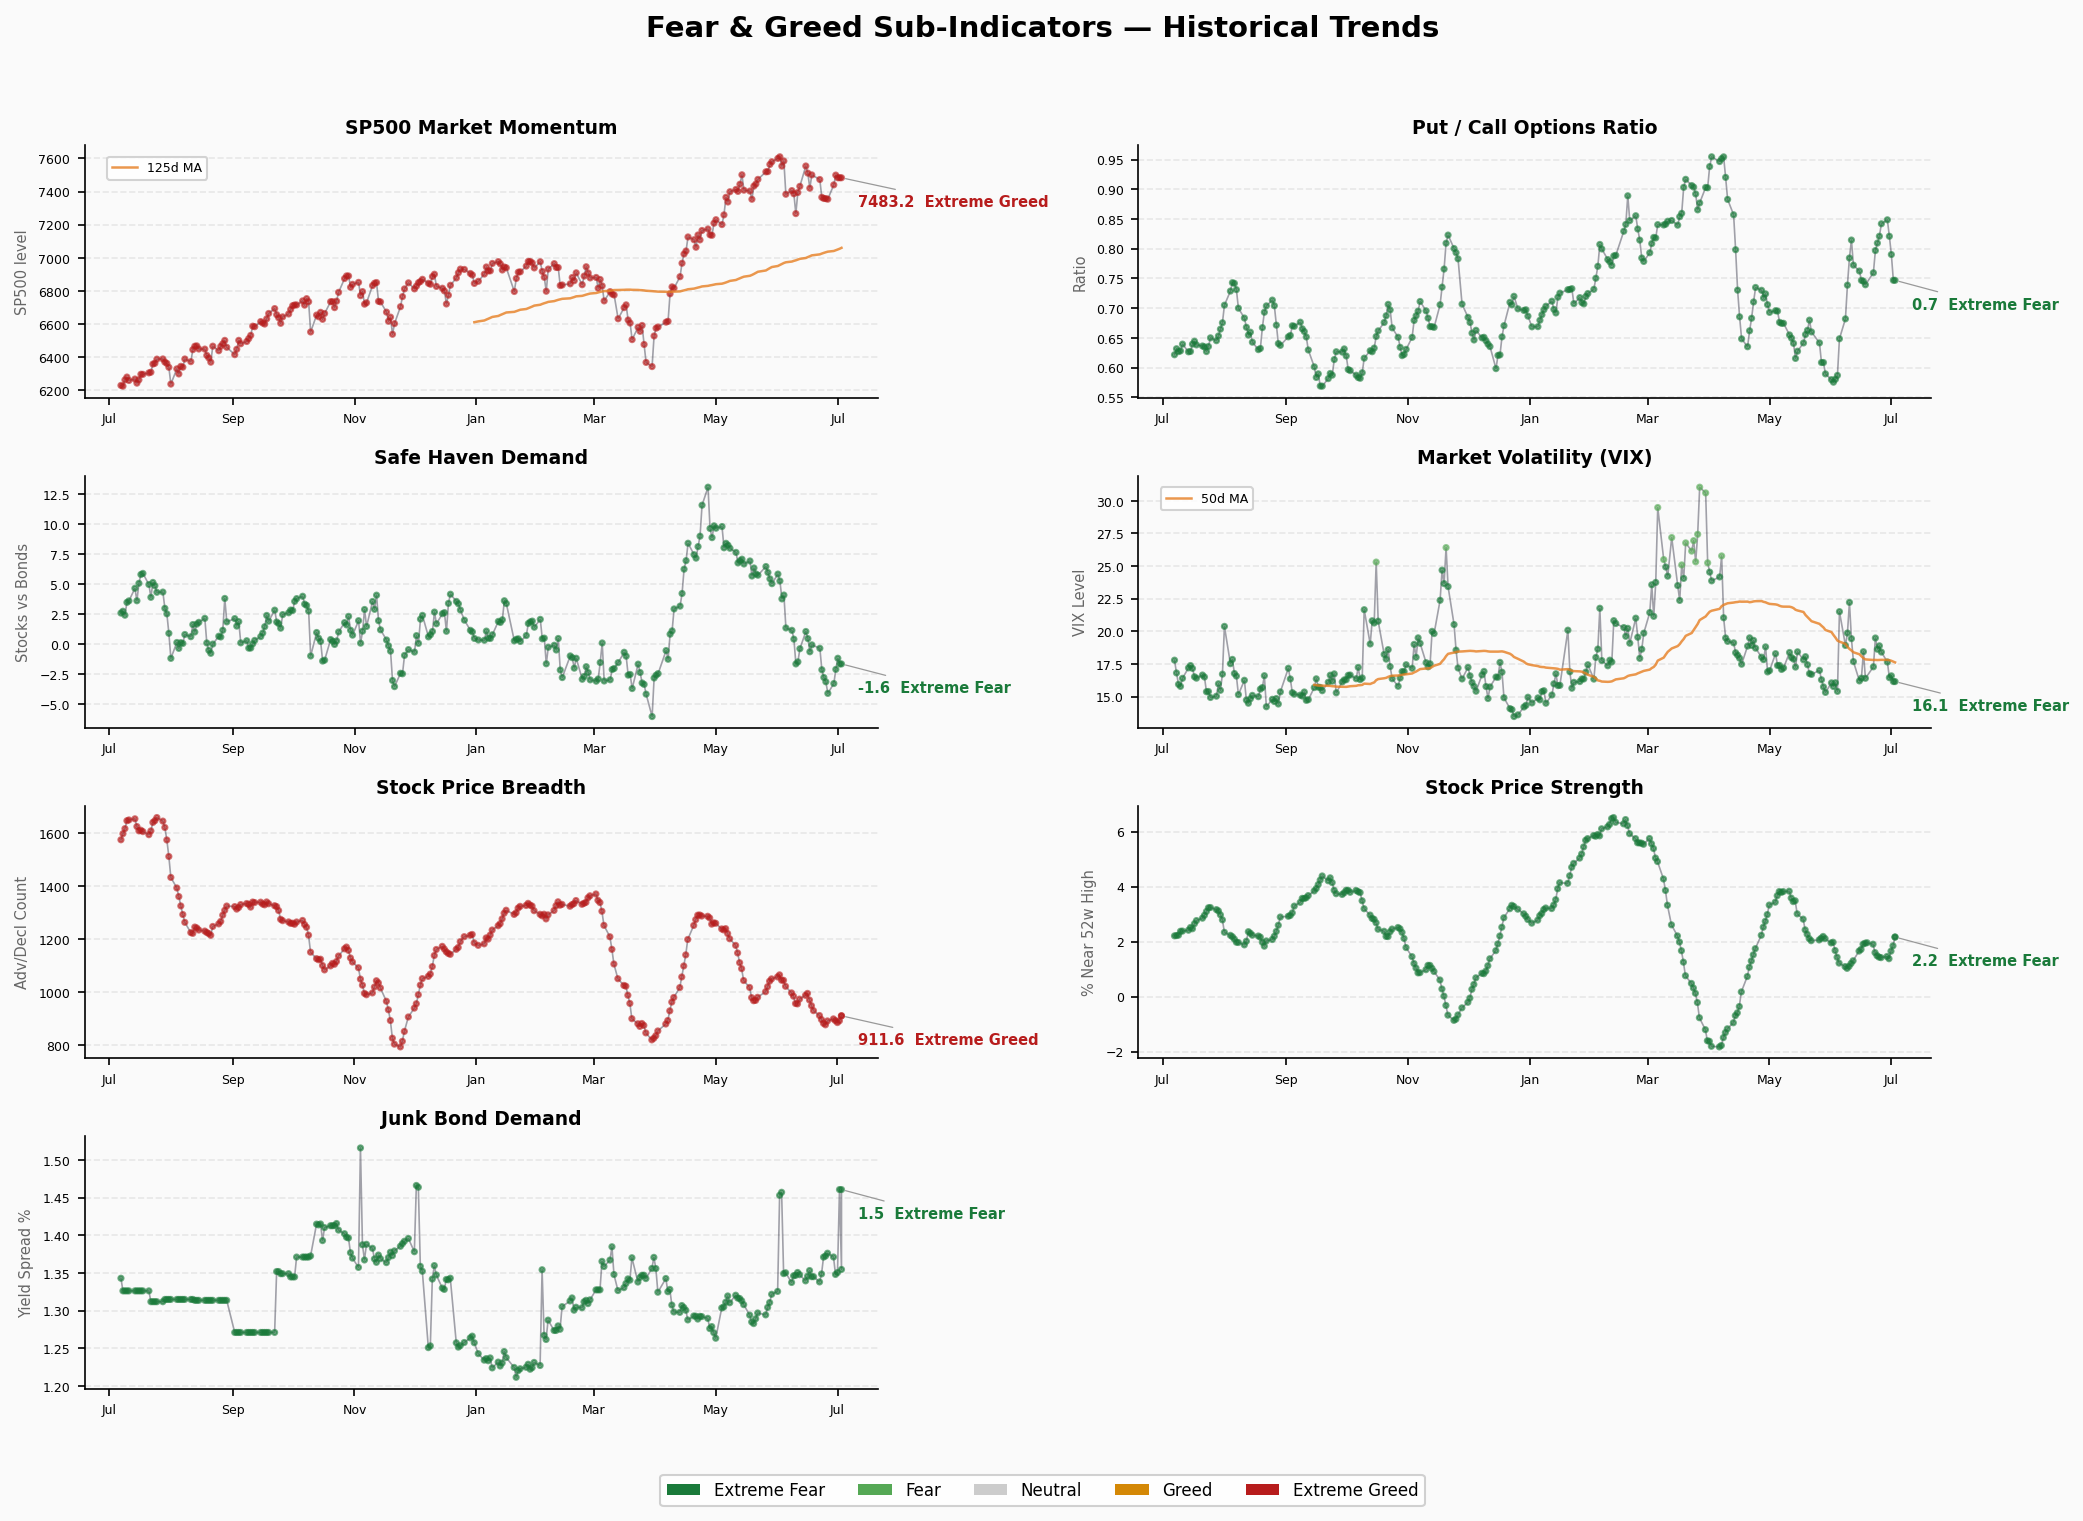
- S&P 500 at ~7,483, well above its 125-day moving average. The neutral score reflects deviation returning toward mean levels.
2. Stock Price Strength — 52-Week Highs/Lows
- Score: 41.6 | Rating: 🔴 Fear
- NYSE 52-week high/low ratio at ~2.17, within fear territory. Limited new highs signal narrowing market breadth.
3. Stock Price Breadth — Advancing/Declining Volume
- Score: 19.4 | Rating: 🔴🔴 Extreme Fear
- The most extreme sub-indicator. Advancing volume share at only 19.4%, meaning the vast majority of volume is concentrated in declining stocks. Classic “strong index, weak internals” divergence.
4. Put/Call Ratio
- Score: 43.8 | Rating: 🔴 Fear
- Put/Call ratio at 0.75, in fear territory. Hedging demand remains elevated.
5. Market Volatility — VIX
- Score: 50 | Rating: Neutral
- VIX at 16.15, low-normal. VIX 50-day MA at 17.68. Volatility is not reflecting the fear signals — the current anxiety is about breadth and credit, not outright panic.
6. Junk Bond Demand
- Score: 0.8 | Rating: 🔴🔴 Extreme Fear
- Junk bond spread at 1.46 (CNN metric), extreme fear territory. Credit markets are flashing strong risk-off signals, though FRED HY OAS at 2.75% remains in normal territory — the CNN algorithm weights short-term rate-of-change more heavily.
7. Safe Haven Demand
- Score: 24.4 | Rating: 🔴🔴 Extreme Fear
- Stock vs Treasury relative strength at -1.62, extreme fear. Capital is rotating from equities into Treasuries.
Structural Contradictions
Extreme Readings (>80 or <20)
- Junk Bond Demand 0.8: Extreme Fear. Near-term credit signals deeply pessimistic.
- Stock Price Breadth 19.4: Extreme Fear. Advancing/declining ratio severely skewed.
- Safe Haven Demand 24.4: Extreme Fear. Equity-to-bond rotation pointing to risk-off.
Divergence Signals
- VIX vs Composite: VIX at 16.15 (neutral/low) but composite at 31.89 (fear). Market is accumulating fear in a low-volatility environment — not a panic selloff but a slow, structural buildup of pessimism.
- Momentum vs Breadth: S&P 500 momentum score 48 (neutral) but breadth 19.4 (extreme fear). The index is held up by a handful of mega-caps while most stocks are declining.
- Junk Bonds vs Credit Spreads: CNN Junk Bond Demand 0.8 (extreme fear) vs FRED HY OAS 2.75% (normal). Short-term rate-of-change vs absolute level divergence — credit markets are moving rapidly from normal toward danger.
Trend Outlook
- Duration in Fear zone: 10 consecutive trading days, touched Extreme Fear (24.4) on June 24.
- Direction: Declined from 34.1 to 31.9 over the past 3 days, bounce losing steam.
- Key watchpoints: If the composite breaks below 25 (Extreme Fear threshold) with continued deterioration in breadth and junk bonds, deeper risk-off could follow. Conversely, if VIX stays low and momentum stabilizes, fear could gradually repair toward neutral.
🚨 Crisis Precursor Indicator Dashboard
1. Credit Spreads
- HY OAS: 2.75% (2026-07-02) | 🟢 Normal
- IG OAS: 0.75%
- Trend: Stable in normal range
- Analysis: Credit spreads remain healthy, HY OAS below the 3% threshold. However, CNN’s Junk Bond Demand has entered Extreme Fear — short-term rate-of-change suggests spreads may widen.
2. Yield Curve
- 10Y-2Y Spread: +35bp | 🟢 Normal (flattening)
- 10Y: 4.48% | 2Y: 4.17% | 30Y: 4.97%
- Trend: Curve flattening, 10Y-30Y inverted at -49bp
- Analysis: 10Y-2Y remains positive, no classic recession inversion signal. But 10Y-30Y inversion suggests strong long-end demand — market pricing in future rate cuts.
3. Margin Debt
- Latest: $1.304T (Apr 2026, FINRA monthly)
- YoY Change: At all-time high territory
- Status: 🔴 All-Time High
- Analysis: FINRA margin debt has held above $1.3T for consecutive months. In a high-leverage environment, any market turn risks a deleveraging spiral.
4. IPO Count
- 2026 YTD: ~73 (Renaissance Capital estimate)
- vs Prior Year: Flat to slightly up
- Status: 🟡 Moderate
- Analysis: IPO pace has not reached 2021-style overheating. Market absorption capacity remains adequate, but watch for H2 acceleration.
5. Fund Flows
- 2026 YTD ETF Net Inflows: $856B (record pace)
- Record Setting: Yes
- Status: 🔴 Frenzy
- Analysis: H1 2026 ETF net inflows have already set a new record, annualizing above $1.7T. Sustained passive inflows provide market support, but also mean reversal risk — redemption cascades could amplify any downturn.
Composite Assessment
| Signal | Status | Risk Level |
|---|---|---|
| Credit Spreads (HY OAS) | 🟢 Normal | Low |
| Yield Curve (10Y-2Y) | 🟢 Normal/Flat | Low |
| Margin Debt | 🔴 All-Time High | High |
| IPO Count | 🟡 Moderate | Medium |
| ETF Inflows | 🔴 Record Frenzy | High |
Overall: 2🟢 / 1🟡 / 2🔴 — Credit and rate fundamentals remain sound, but leverage and fund flows are at historical extremes. This is not an “imminent crash” signal, but risk asymmetry is severely skewed to the downside. Core contradiction: low VIX + high leverage + extremely narrow breadth = calm surface, fragile structure.