CNN Fear & Greed Analysis 2026-07-04
Composite 31.9 (Fear), recovering from 25.1 Extreme Fear last week. Junk Bond Demand 0.8 Extreme Fear, Breadth 19.4 Extreme Fear. VIX neutral at 50, S&P momentum neutral at 48.
Composite Index
| Metric | Value |
|---|---|
| Latest | 31.89 — Fear |
| Previous Close | 31.43 — Fear |
| 1 Week Ago | 25.11 — Extreme Fear |
| 1 Month Ago | 53.03 — Neutral |
| 1 Year Ago | 77.63 — Extreme Greed |
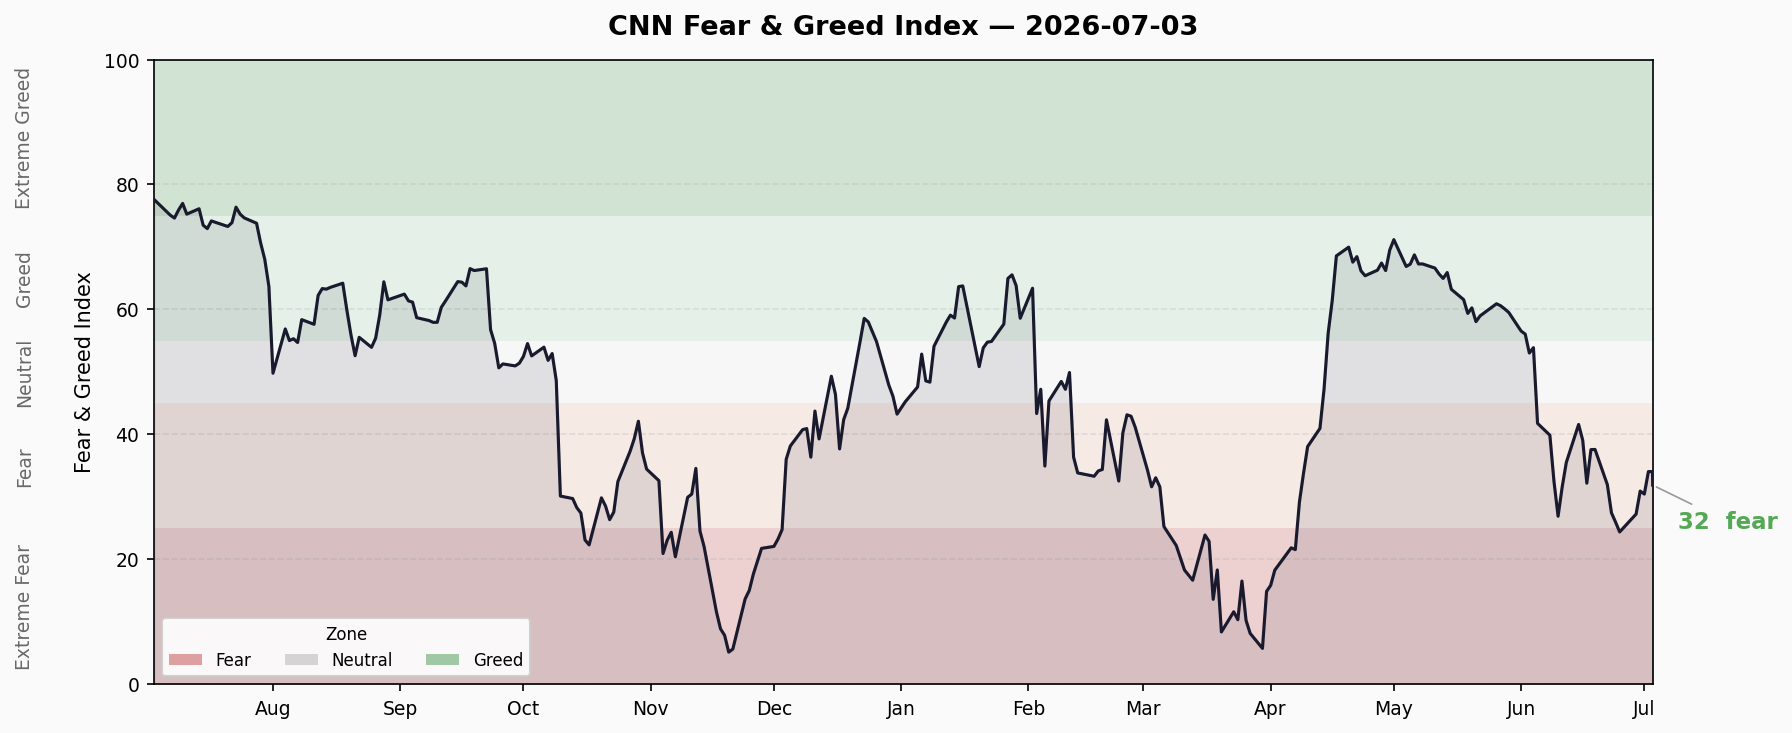
The composite index has recovered from 25.11 (Extreme Fear) a week ago to 31.89, still in Fear territory. A month ago (early June) it was Neutral at 53.03 — a significant sentiment cooldown over the past month. A year ago (July 2025) it was Extreme Greed at 77.63. Current sentiment stands in stark contrast to last year’s euphoria.
10-day trend: Fear zone bottom (22-25) → gradual recovery to ~32, direction up but momentum modest.
Seven Sub-Indicators
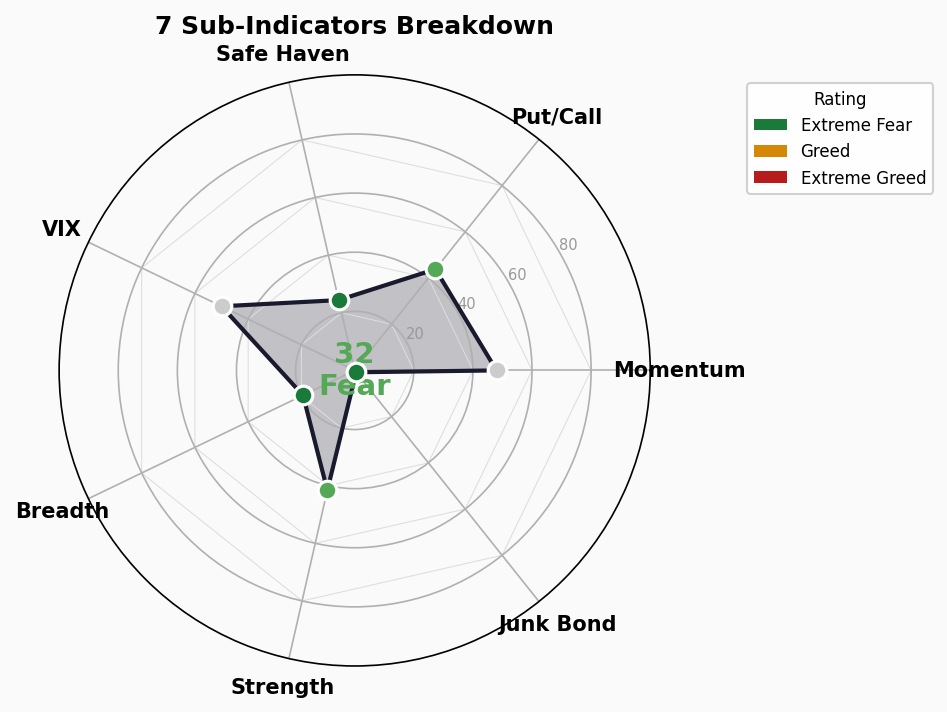
| Indicator | Score | Rating | Direction |
|---|---|---|---|
| Stock Price Strength | 41.6 | Fear | — |
| Stock Price Breadth | 19.4 | Extreme Fear | — |
| Put/Call Options | 43.8 | Fear | — |
| Market Volatility (VIX) | 50.0 | Neutral | — |
| Junk Bond Demand | 0.8 | Extreme Fear | — |
| Safe Haven Demand | 24.4 | Extreme Fear | — |
| S&P 500 Momentum | 48.0 | Neutral | — |
- Stock Price Strength (41.6): High end of Fear, approaching the Neutral 45 threshold. NYSE 52-week highs vs lows ratio is weak but not extreme.
- Stock Price Breadth (19.4): Extreme Fear. Advancing vs declining volume ratio severely imbalanced — extremely narrow market participation with a handful of mega-caps supporting the index.
- Put/Call Options (43.8): Fear. Options market leaning defensive with elevated put demand.
- VIX (50.0): Neutral. Volatility index in normal range — options market not pricing extreme tail risk.
- Junk Bond Demand (0.8): Extreme Fear. Spread between junk and IG bonds is extremely wide — credit market in maximum risk-off mode. This is the most extreme reading among all 7 indicators, nearly touching the 0 floor.
- Safe Haven Demand (24.4): Extreme Fear. Stocks underperforming bonds significantly — capital rotating from equities to fixed income.
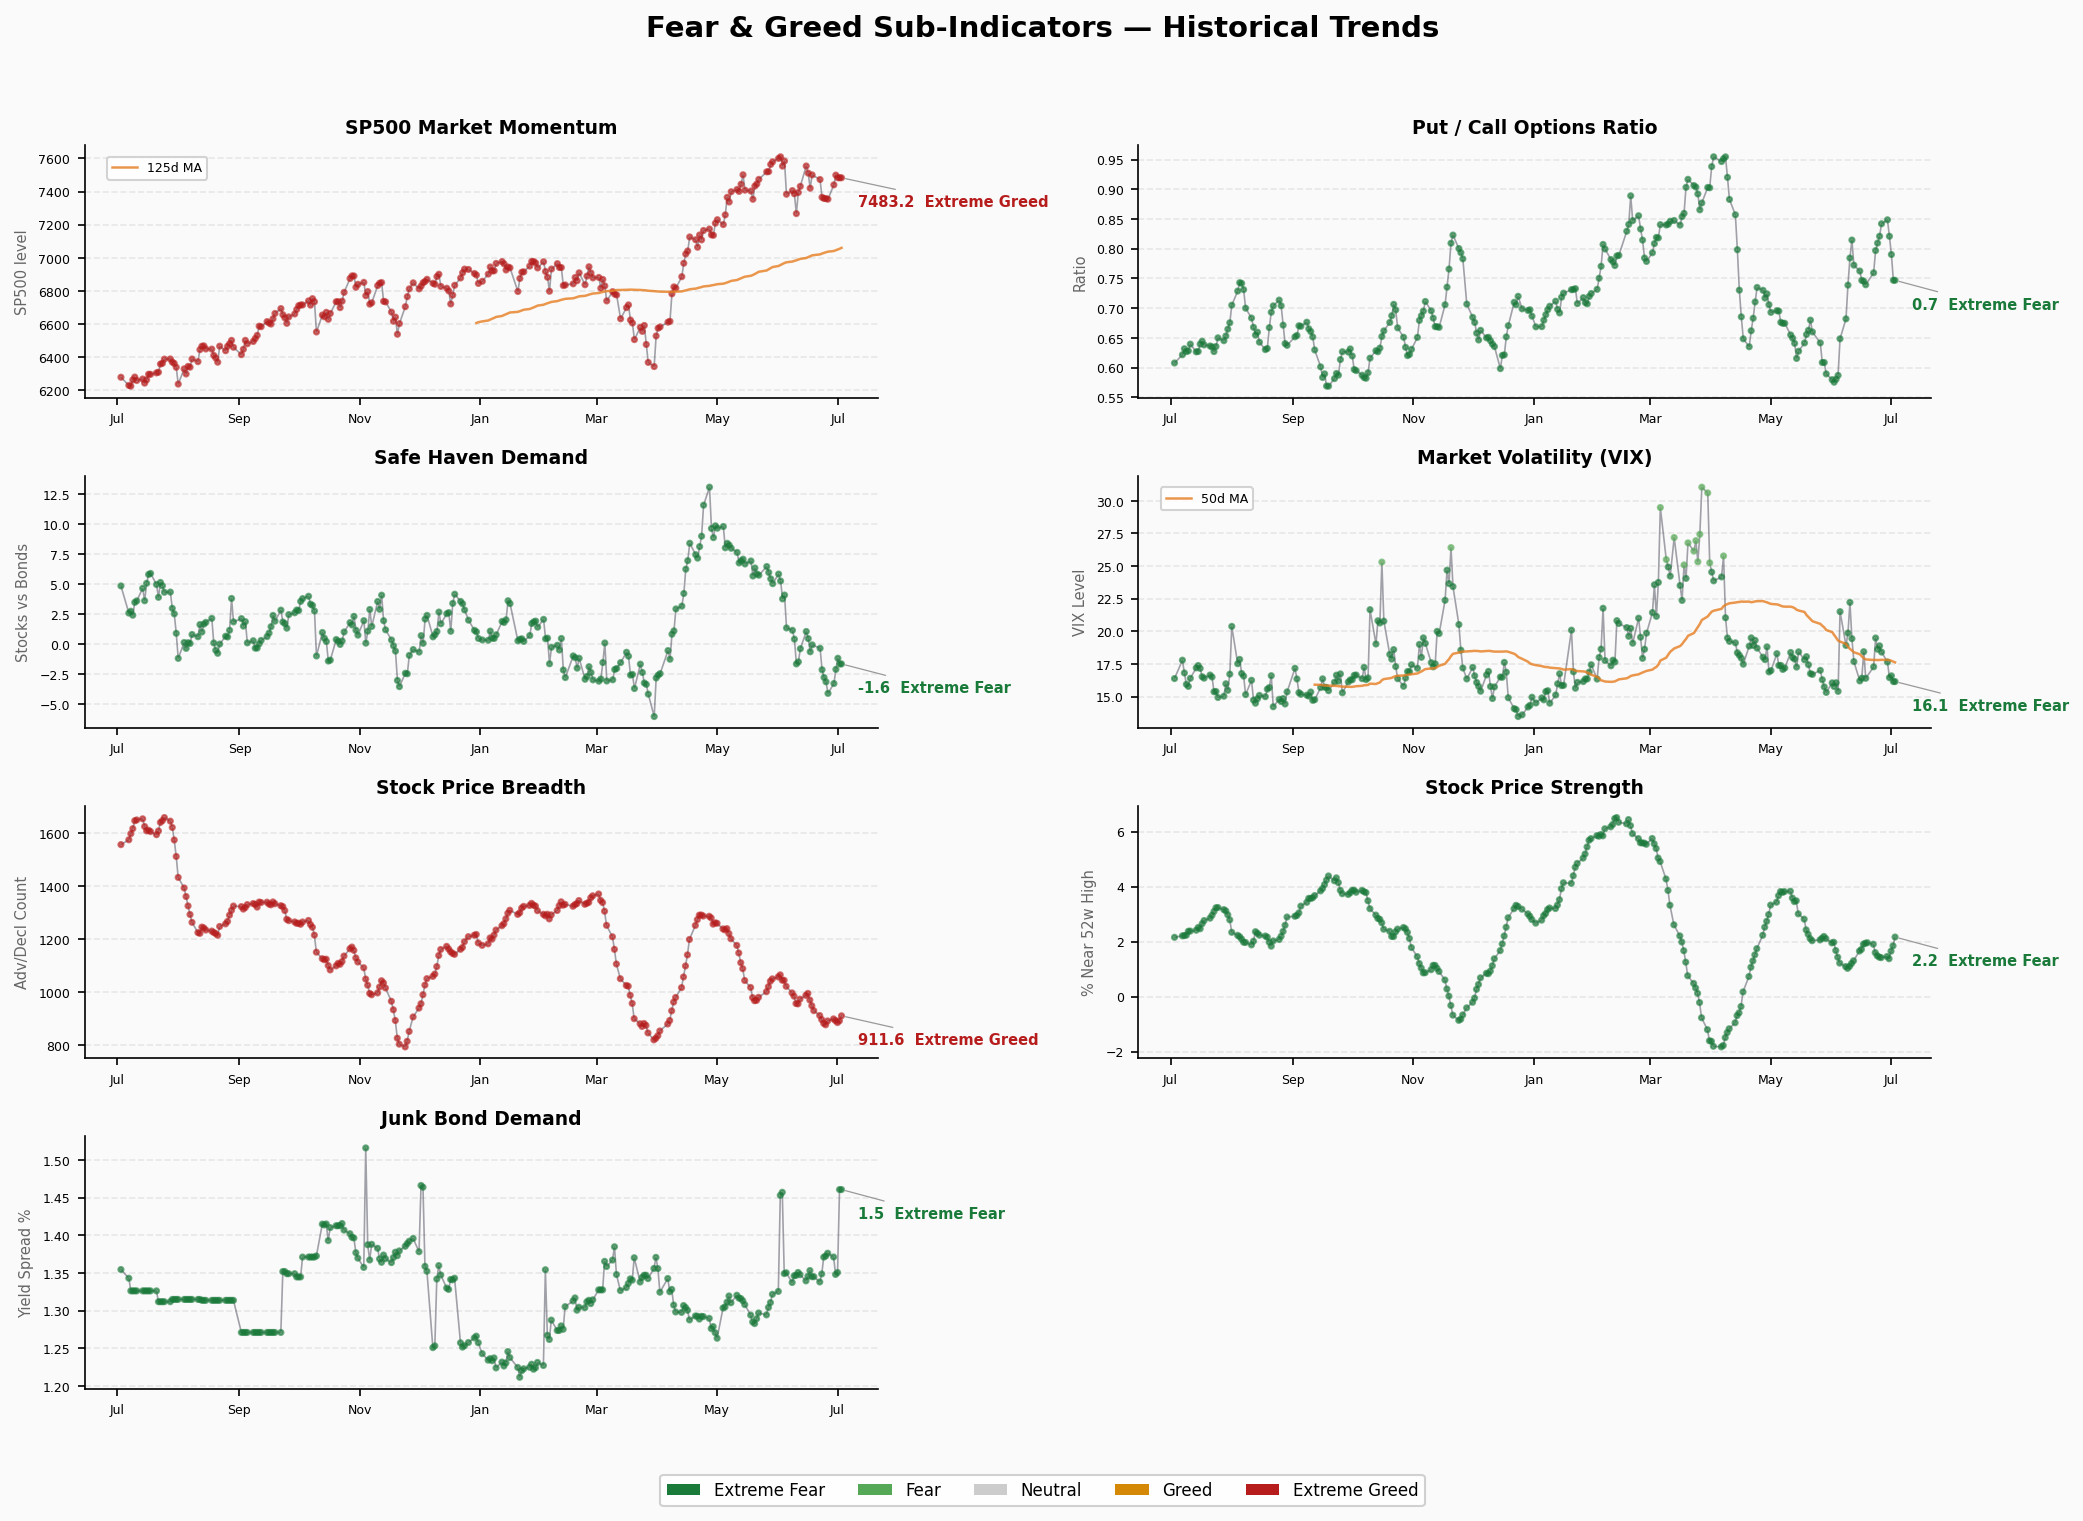
- S&P 500 Momentum (48.0): Neutral. S&P 500 still near all-time highs (~7483) but momentum score has retreated to neutral territory.
Structural Divergence Analysis
Extreme readings (>80 or <20):
- Junk Bond Demand 0.8: At the Extreme Fear floor — credit market sending the strongest possible risk-off signal
- Stock Price Breadth 19.4: At the Extreme Fear lower bound — extremely narrow market participation
Divergence signals:
- VIX Neutral (50) + S&P Momentum Neutral (48) vs Junk Bond Extreme Fear (0.8): Surface-level volatility and index positioning appear normal, but credit and breadth indicators reveal severe internal market deterioration
- Junk Bond Demand 0.8 vs HY OAS 2.75%: CNN’s junk bond indicator shows Extreme Fear while FRED HY OAS at 2.75% is historically normal. Likely a timing gap — CNN indicator is more sensitive while FRED data lags by 1-2 days.
Trend Assessment
- Composite dropped from Greed territory (60-70) in late May/early June to Extreme Fear (22-25) by mid-to-late June, now stabilizing in Fear (32) with a modest bounce.
- Since the November 2025 low (~5), the composite has spent most time oscillating between Fear and Neutral, with only brief returns to Greed.
- Current Fear zone duration: ~3 weeks (since mid-June), no sustained bottom yet formed.
- Turning points: Break above 45 (Neutral upper bound) would signal sentiment shift toward optimism; drop below 25 would bring Extreme Fear back in control.
🚨 Crisis Precursor Dashboard
1. Credit Spreads
- HY OAS: 2.75% | 🟢 Normal
- IG OAS: 0.75%
- Trend: Stable
- Analysis: Credit spreads in historically normal range, far from crisis levels (5-8%). However, note the timing gap between CNN Junk Bond Demand (0.8, extreme fear) and FRED HY OAS (2.75%, normal) — FRED data may lag by 1-2 days.
2. Yield Curve
- 10Y-2Y Spread: +35bp | 🟢 Normal/Slightly Flat
- 10Y: 4.48% | 2Y: 4.17% | 30Y: 4.97%
- Trend: Slight flattening
- Analysis: 10Y-2Y spread at 35bp in normal positive territory. 30Y at 4.97% above 10Y at 4.48% — term premium still exists. No inversion risk, but the flat curve suggests cautious long-term growth expectations.
3. Margin Debt
- Latest: $1.304T (Apr 2026)
- YoY Change: Elevated
- Status: 🔴 Record High Territory
- Analysis: FINRA margin debt has been climbing steadily since 2025, surpassing 2021 peaks. High leverage means extreme sensitivity to liquidity tightening — a significant drawdown could trigger cascading forced liquidations.
4. IPO Activity
- 2026 YTD: ~73 (Renaissance Capital)
- vs Last Year: Moderate growth
- Status: 🟡 Moderate
- Analysis: 73 IPOs YTD is not overheating. Compared to 200+ in the same period of 2021, current IPO pace is relatively restrained — not a bubble signal.
5. Fund Flows
- 2026 YTD ETF Net Inflows: $856B
- Record?: Yes
- Status: 🔴 Record
- Analysis: ETF net inflows at all-time highs for the period, reflecting continued retail and institutional inflows. But massive inflows at index highs mean significant potential redemption pressure if the market turns.
Overall Assessment
| Signal | Status | Risk Level |
|---|---|---|
| Credit Spreads | 🟢 Normal | Low |
| Yield Curve | 🟢 Normal | Low |
| Margin Debt | 🔴 Record High | High |
| IPO Activity | 🟡 Moderate | Low |
| ETF Flows | 🔴 Record | Medium |
| FNG Composite | 🟡 Fear | Medium |
Overall: 2🟢 / 2🟡 / 2🔴 — Credit and rates fundamentals are healthy, but leverage and fund flows are at extreme levels. Fear sentiment offers a contrarian buying window, but tail risk from record margin debt warrants caution. Overall risk level: Moderately Elevated.