CNN Fear & Greed Analysis 2026-07-03
Composite 31.4 fear zone, breadth extreme fear, put demand strong
CNN Fear & Greed Analysis — 2026-07-03
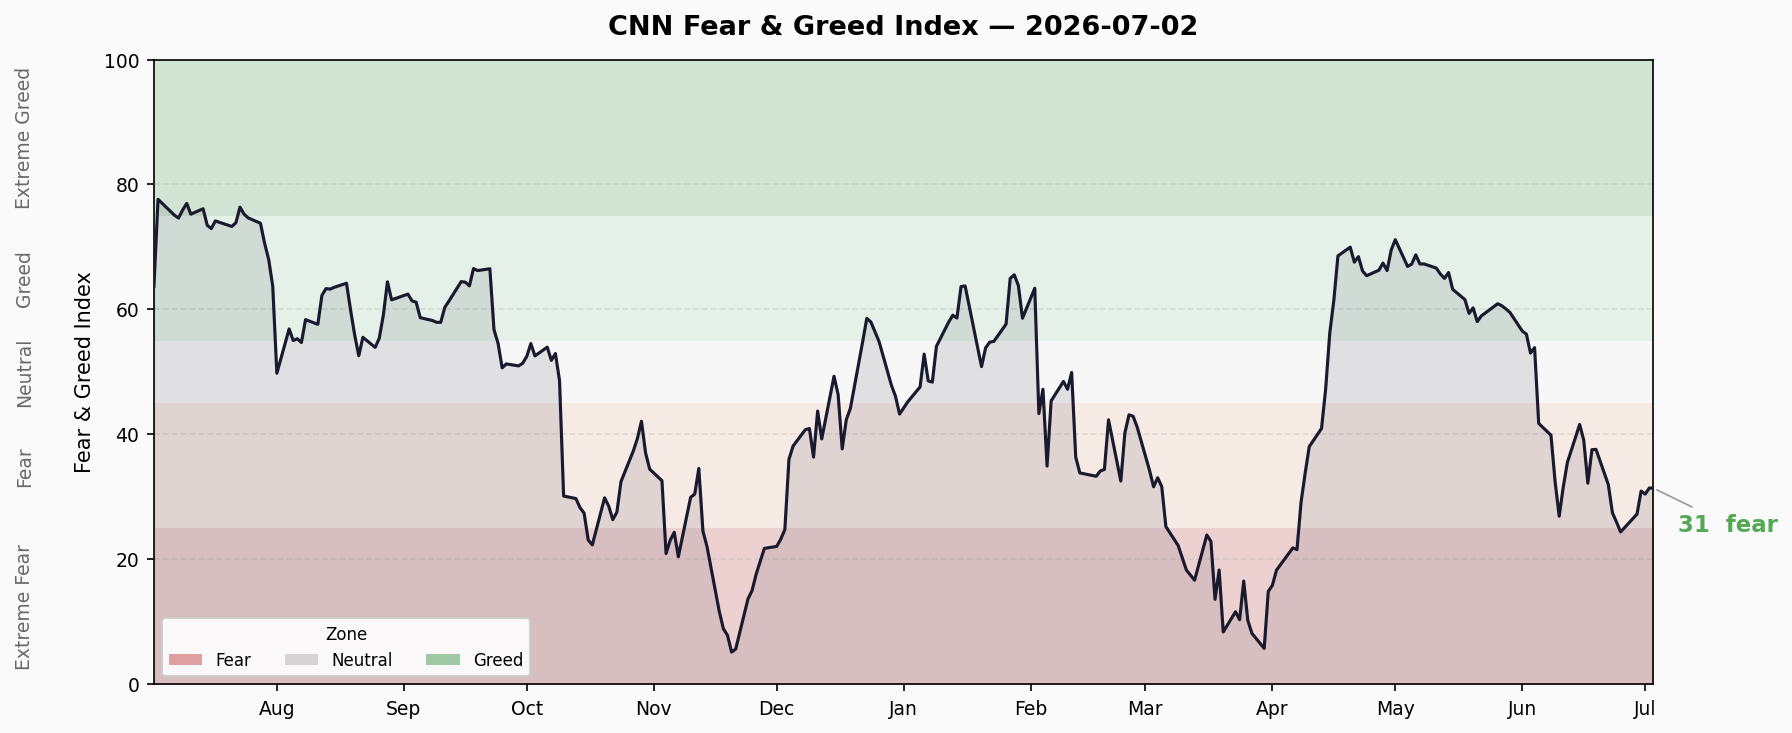
Composite Index
Current: 31.4 / 100 — Fear
| Date | Score | Rating | Change |
|---|---|---|---|
| 06-22 | 32.0 | Fear | — |
| 06-23 | 27.5 | Fear | ↓ |
| 06-24 | 26.0 | Fear | ↓ |
| 06-25 | 24.4 | Extreme Fear | ↓ Local low |
| 06-26 | 25.1 | Fear | ↑ |
| 06-29 | 27.3 | Fear | ↑ |
| 06-30 | 30.9 | Fear | ↑ |
| 07-01 | 30.5 | Fear | → |
| 07-02 | 31.4 | Fear | ↑ |
| 07-03 | 31.4 | Fear | → Flat |
Trend: Composite bottomed at 24.4 (Extreme Fear) on June 25, then recovered to 31.4. Currently sitting at the upper end of Fear zone (25-50), hasn’t broken into Neutral. Upward trend established but momentum fading.
7 Sub-Indicators Scan
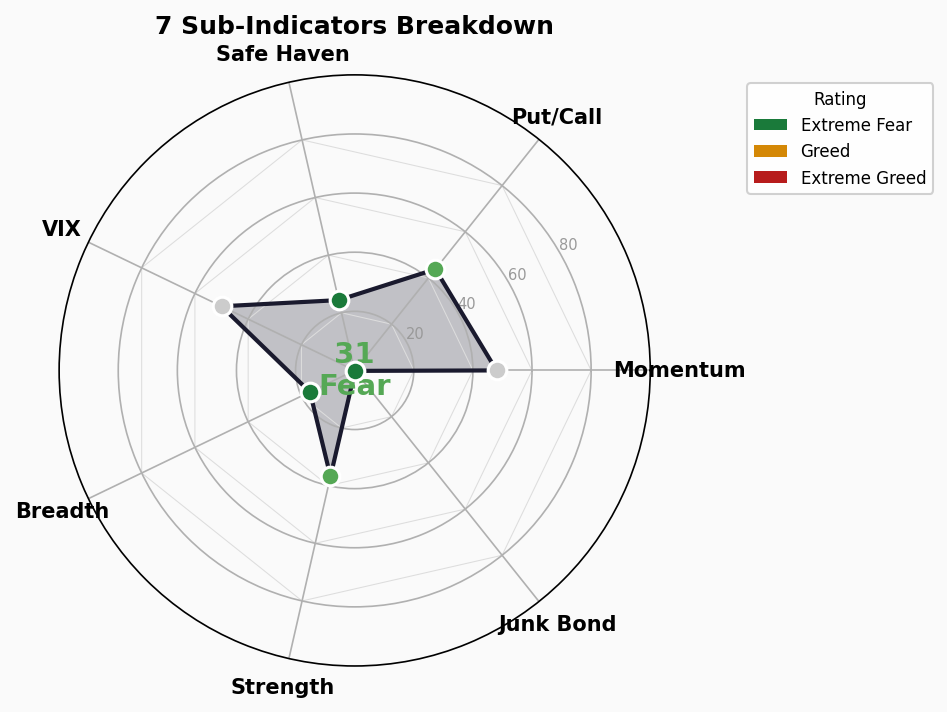
| # | Indicator | Score | Rating | Raw Value | vs Prior Day | Signal |
|---|---|---|---|---|---|---|
| 1 | Market Momentum (S&P 500) | 48.0 | Neutral | 7,483.24 | Flat | 🟡 |
| 2 | Stock Price Strength (High-Low) | 36.8 | Fear | +1.85% | ↑ +0.19 | 🟡 |
| 3 | Stock Price Breadth (A/D Line) | 16.8 | Extreme Fear | 892.84 | ↑ +6.77 | 🔴 |
| 4 | Put/Call Options Ratio | 43.8 | Fear | 0.747 | ↓ -0.04 | 🟡 |
| 5 | Market Volatility (VIX) | 50.0 | Neutral | 16.15 | Flat | 🟡 |
| 6 | Junk Bond Demand (HY OAS) | 0.2 | Extreme Fear | 1.46% | ↑ +0.11bp | 🔴 |
| 7 | Safe Haven Demand | 24.4 | Extreme Fear | -1.62% | ↓ -0.47 | 🔴 |
Distribution:
- 🟢 Greed/Extreme Greed: 0
- 🟡 Neutral/Fear: 4 (momentum, strength, put/call, volatility)
- 🔴 Extreme Fear: 3 (breadth, junk bond, safe haven)
Structural Divergence Analysis
Extreme Value Scan (>80 Greed or <20 Fear):
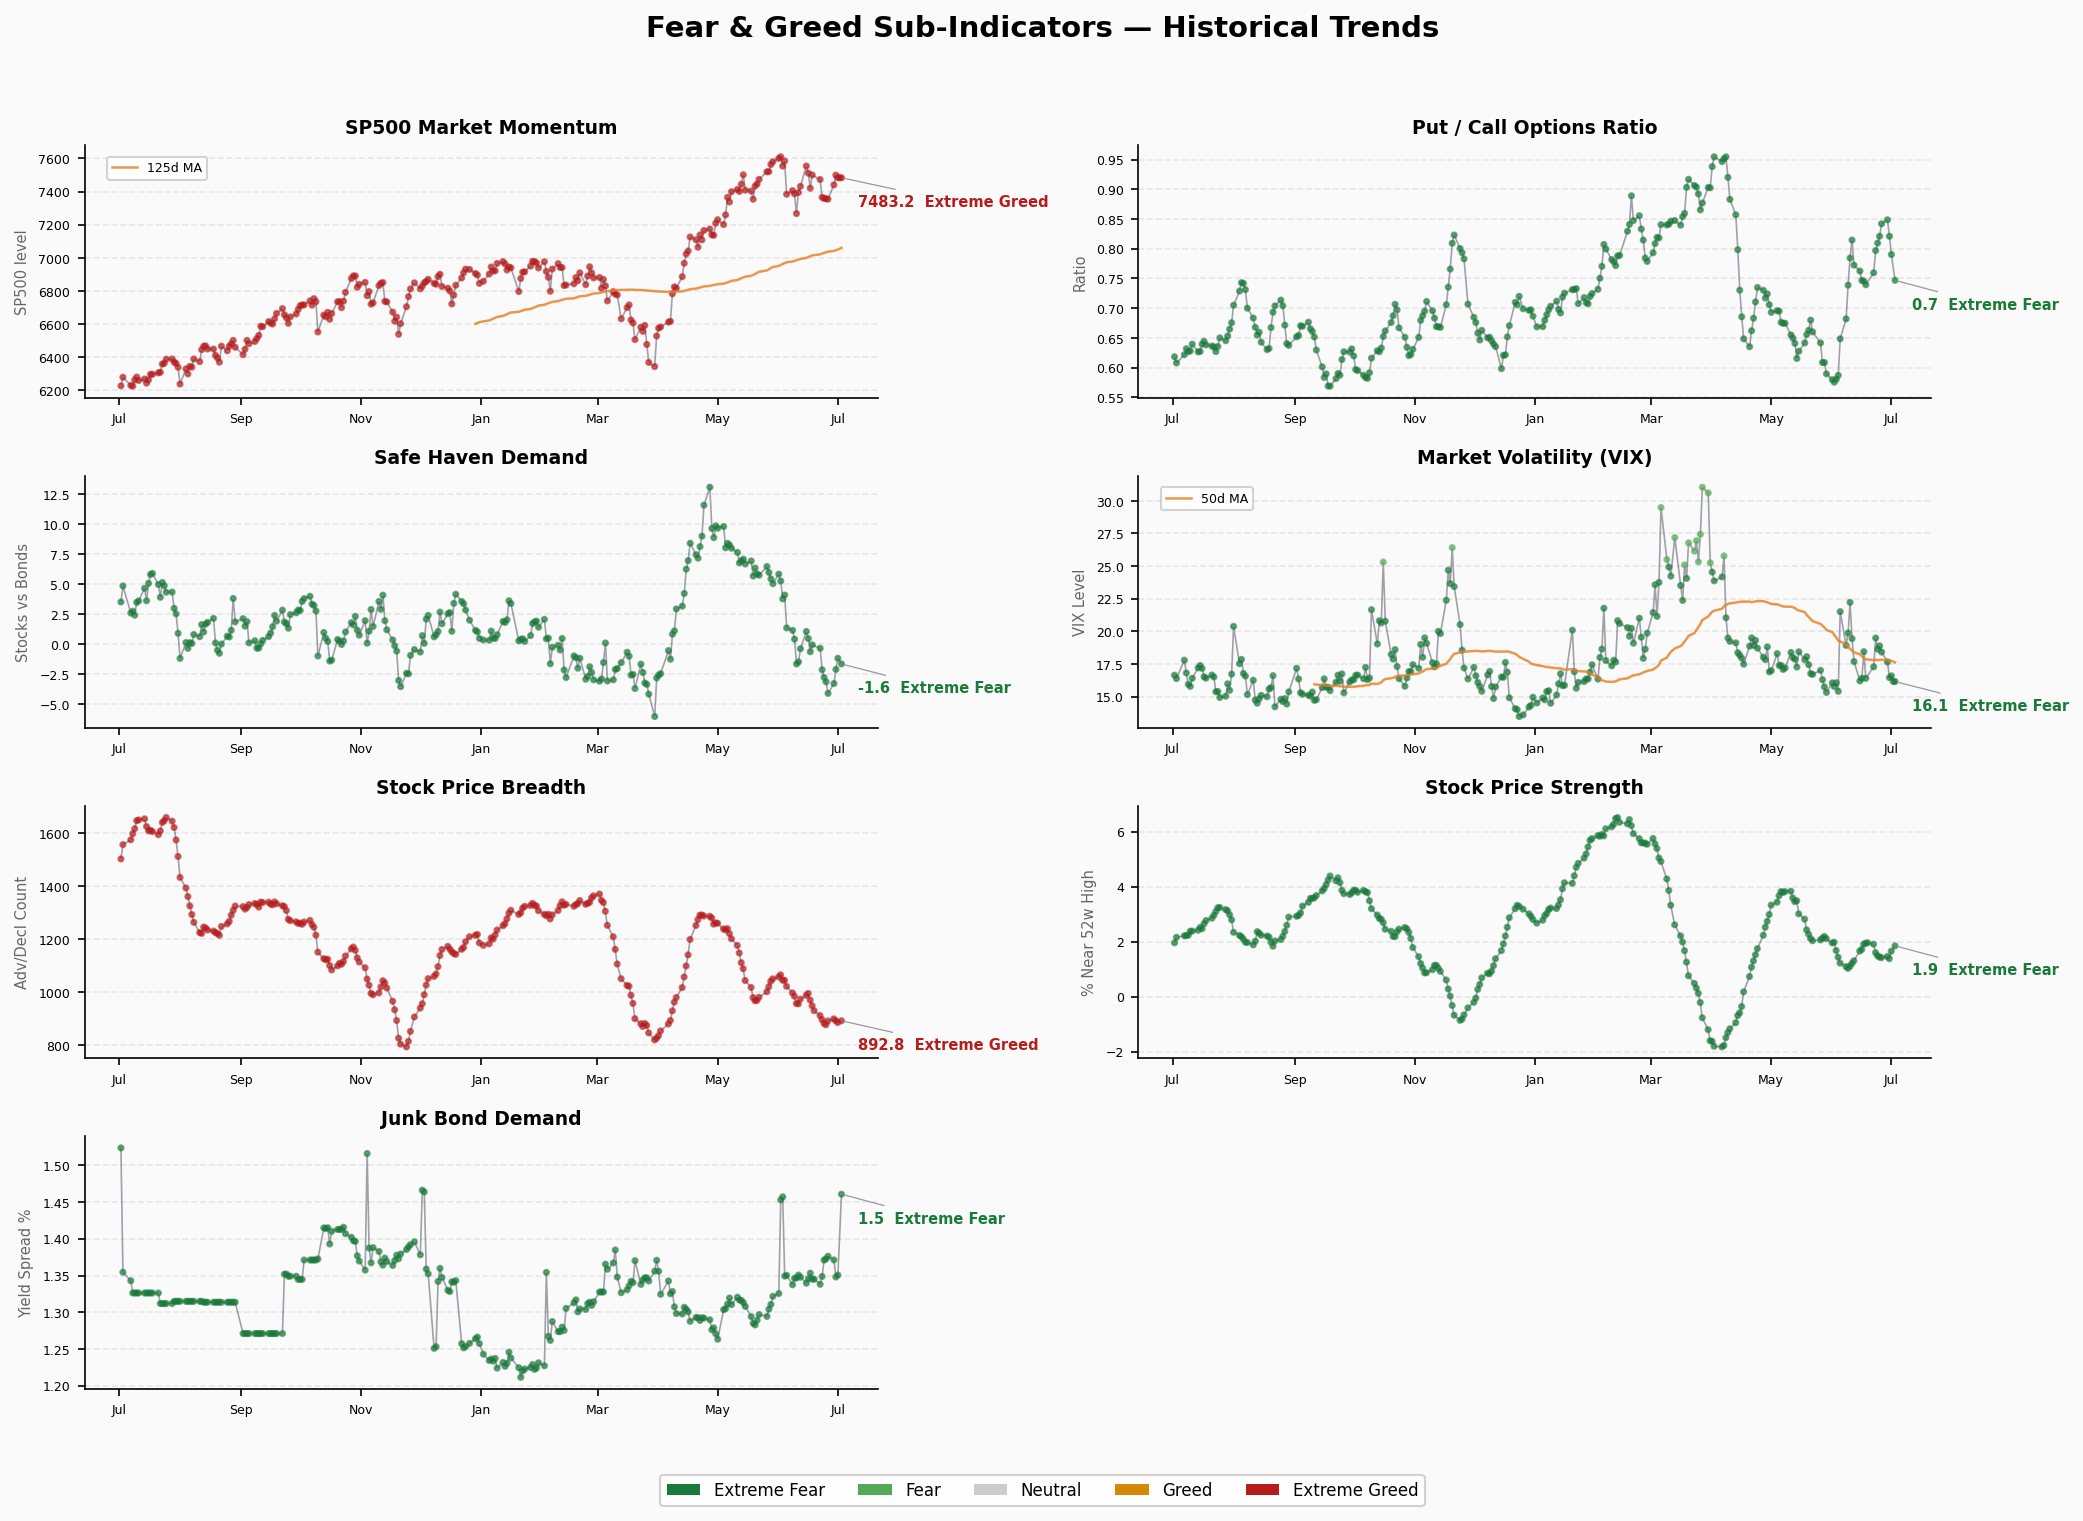
Breadth at 16.8 (Extreme Fear) — Market width severely narrowed, only a handful of large-caps propping up the index. A/D line recovering from 886→892 but still deep in extreme fear territory. This means index gains are a “few-stock” facade.
Junk Bond Demand at 0.2 (Extreme Fear) — HY OAS only 1.46%, credit markets pricing in soft landing. But CNN score extremely low, reflecting direction of spread changes rather than absolute level. Credit-vs-sentiment divergence worth monitoring.
Safe Haven Demand at 24.4 (Extreme Fear) — Capital flowing aggressively out of safe havens (Treasuries/gold) into risk assets. Classic risk-on signal that looks contradictory against the broader fear backdrop.
Divergence Signals:
- 📌 Neutral Momentum vs Extreme Fear Breadth: Index flat but massive internal divergence — classic “distribution top” signature
- 📌 Neutral VIX (16.15) vs Extreme Fear Breadth: Volatility not reflecting stock-level panic — potentially lagging
- 📌 Extreme Fear Junk Bond vs Neutral VIX: Credit and derivatives markets sending contradictory signals
🚨 Crisis Precursor Dashboard
1. Credit Spreads
- High Yield OAS: 1.46% | 🟢 Normal
- Investment Grade OAS: 0.76% | 🟢 Normal
- Trend: +0.11bp vs prior day, slight widening
- Analysis: HY OAS 1.46% still very tight, credit markets pricing soft landing. Daily widening warrants monitoring.
2. Yield Curve
- 10Y-2Y Spread: +35bp | 🟢 Normal (dis-inverted)
- 10Y: 4.48% | 2Y: 4.17% | 30Y: 4.97%
- Trend: Curve normalizing, 10Y-30Y segment still flat (-49bp)
- Analysis: Short end回落 to 4.17%, curve out of inversion. Flat long end reflects anchored inflation expectations. Rate environment overall constructive.
3. Margin Debt
- Latest: $1.304T (Apr 2026)
- YoY Change: ~+15-18% (est. from ~$1.1T Apr 2025)
- Status: 🔴 All-time high territory
- Analysis: Margin debt at record highs, leverage in dangerous zone. FINRA data lags ~6 weeks; May figure likely higher.
4. IPO Count
- 2026 YTD: ~73 deals (Renaissance Capital)
- vs Year Ago: Increased (≈60 in 2025 same period)
- Status: 🟡 Moderately warm
- Analysis: IPO market active but not at 2021 mania levels — normal expansion.
5. Fund Flows
- 2026 YTD ETF Net Inflows: $856B
- Record?: Yes — all-time high
- Status: 🔴 Frenzied
- Analysis: Capital flowing into ETFs at unprecedented pace, especially passive products. " indiscriminate" inflow patterns typically signal overheated sentiment.
Composite Assessment
| Signal | Status | Danger Level |
|---|---|---|
| Credit Spreads | HY 1.46% / IG 0.76% | 🟢 Low |
| Yield Curve | 10Y-2Y +35bp | 🟢 Low |
| Margin Debt | $1.304T ATH | 🔴 High |
| IPO Count | ~73 deals | 🟡 Medium |
| ETF Inflows | $856B record | 🔴 High |
Verdict: 2🟢 / 1🟡 / 2🔴 — Credit and rate environments healthy, but leverage and fund inflows overheated. Market in a “liquidity-rich but structurally divergent” dangerous equilibrium.
Key watch items: Margin debt + ETF inflows 🔴. If market corrects, high leverage + concentrated passive outflows could amplify drawdowns. Current FNG 31.4 fear reading coexisting with these overheated indicators suggests retail/leveraged money is “catching falling knives” during fear — a classic setup for forced liquidation.
Data sources: CNN Fear & Greed Index, FRED, FINRA, Renaissance Capital | Updated: 2026-07-03 06:30 CST