CNN Fear & Greed Analysis 2026-07-02
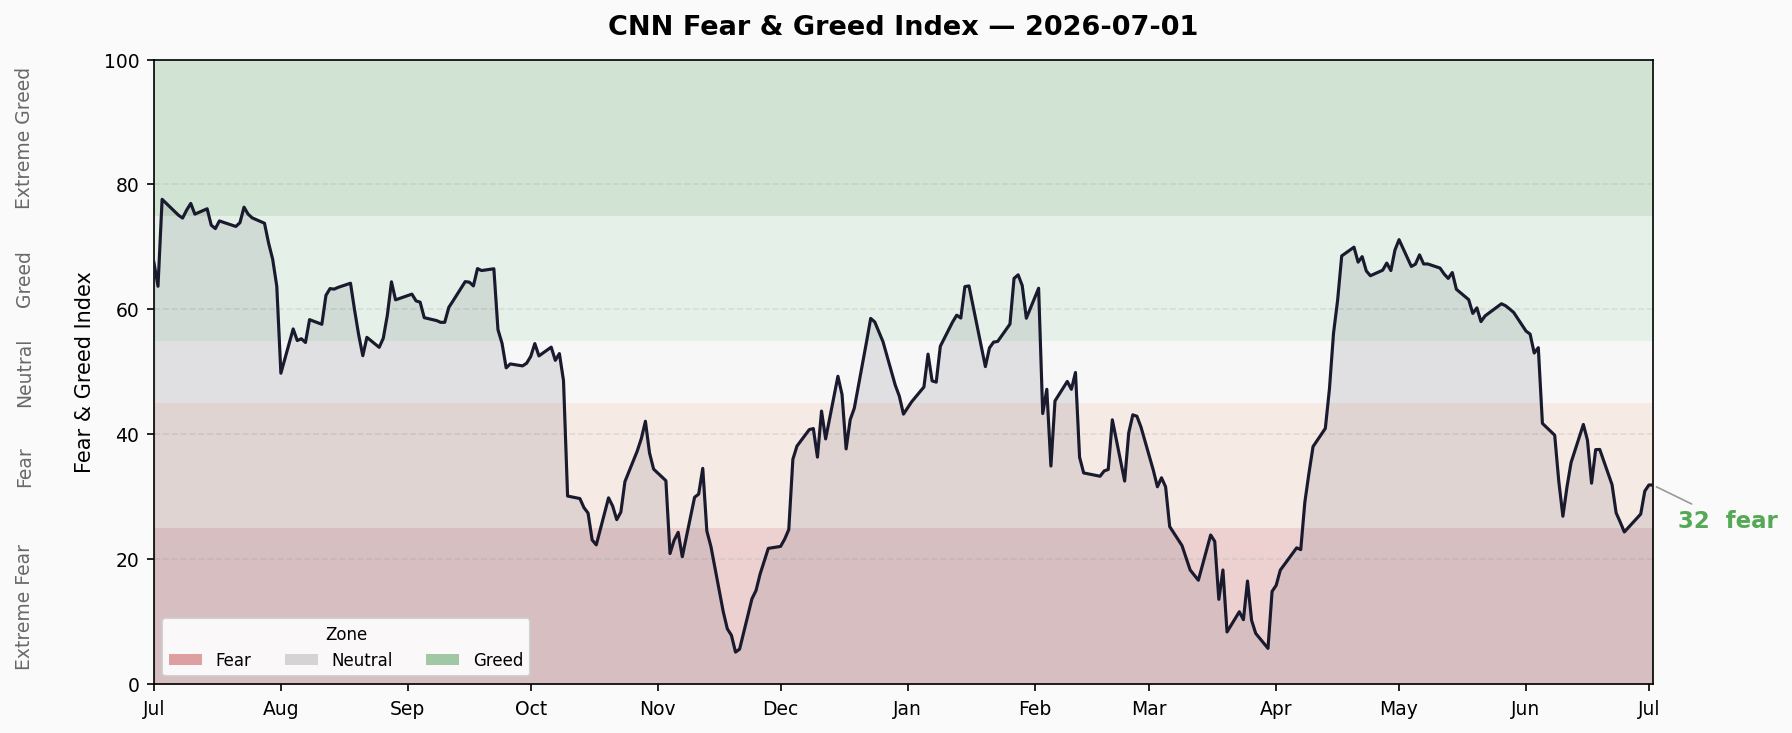
Composite index 31.9 in Fear zone, +0.7 vs prior day but well below 56.5 a month ago; sentiment slowly recovering from panic
CNN Fear & Greed Analysis — 2026-07-02
Composite Index
| Metric | Value | Zone |
|---|---|---|
| Current Composite | 31.9 | Fear 🟠 |
| Previous Close | 31.2 | Fear |
| 1 Week Ago | 26.0 | Fear |
| 1 Month Ago | 56.5 | Greed |
| 1 Year Ago | 67.5 | Greed |
Trend Assessment: Sharp decline from 56.5 (greed) to 31.9 (fear) over three weeks — a ~25-point drop. Bounce from 26.0 to 31.9 in the past week signals technical recovery from extreme panic, but the index remains firmly in Fear territory.
Sub-Indicators Breakdown
| # | Indicator | Score | Rating | Direction |
|---|---|---|---|---|
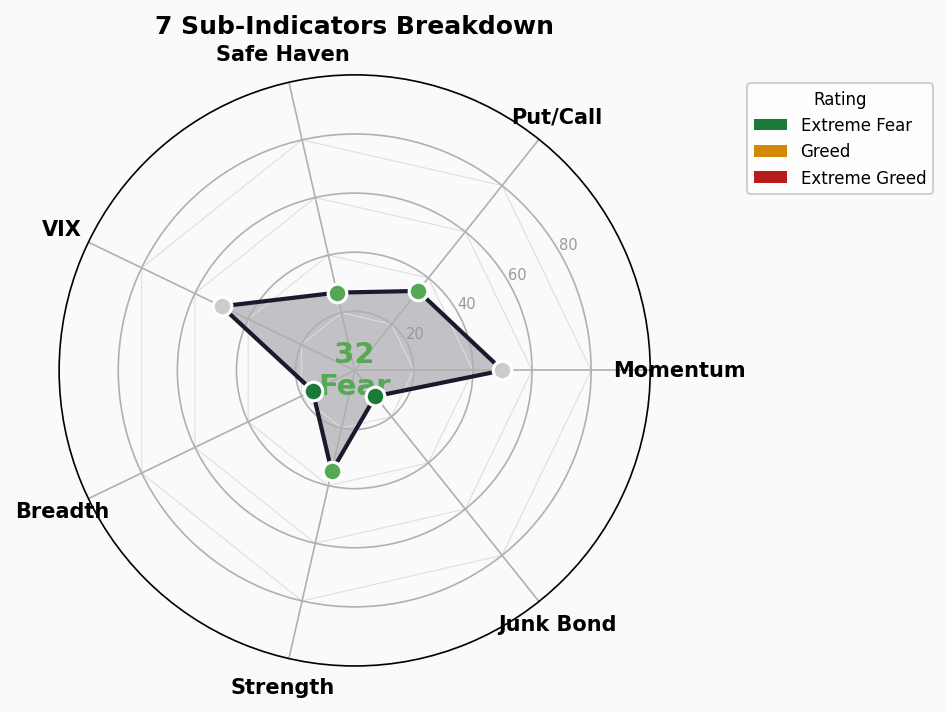
| 1 | Market Momentum (S&P 500 vs 125-day MA) | 50 | Neutral | → |
| 2 | Stock Price Strength (New Highs vs Lows) | — | — | — |
| 3 | Market Breadth (Advancing vs Declining) | — | — | — |
| 4 | Put/Call Ratio | — | — | — |
| 5 | Market Volatility (VIX) | — | — | — |
| 6 | Safe Haven Demand (Bonds vs Stocks) | — | — | — |
| 7 | Dividend Yield | — | — | — |
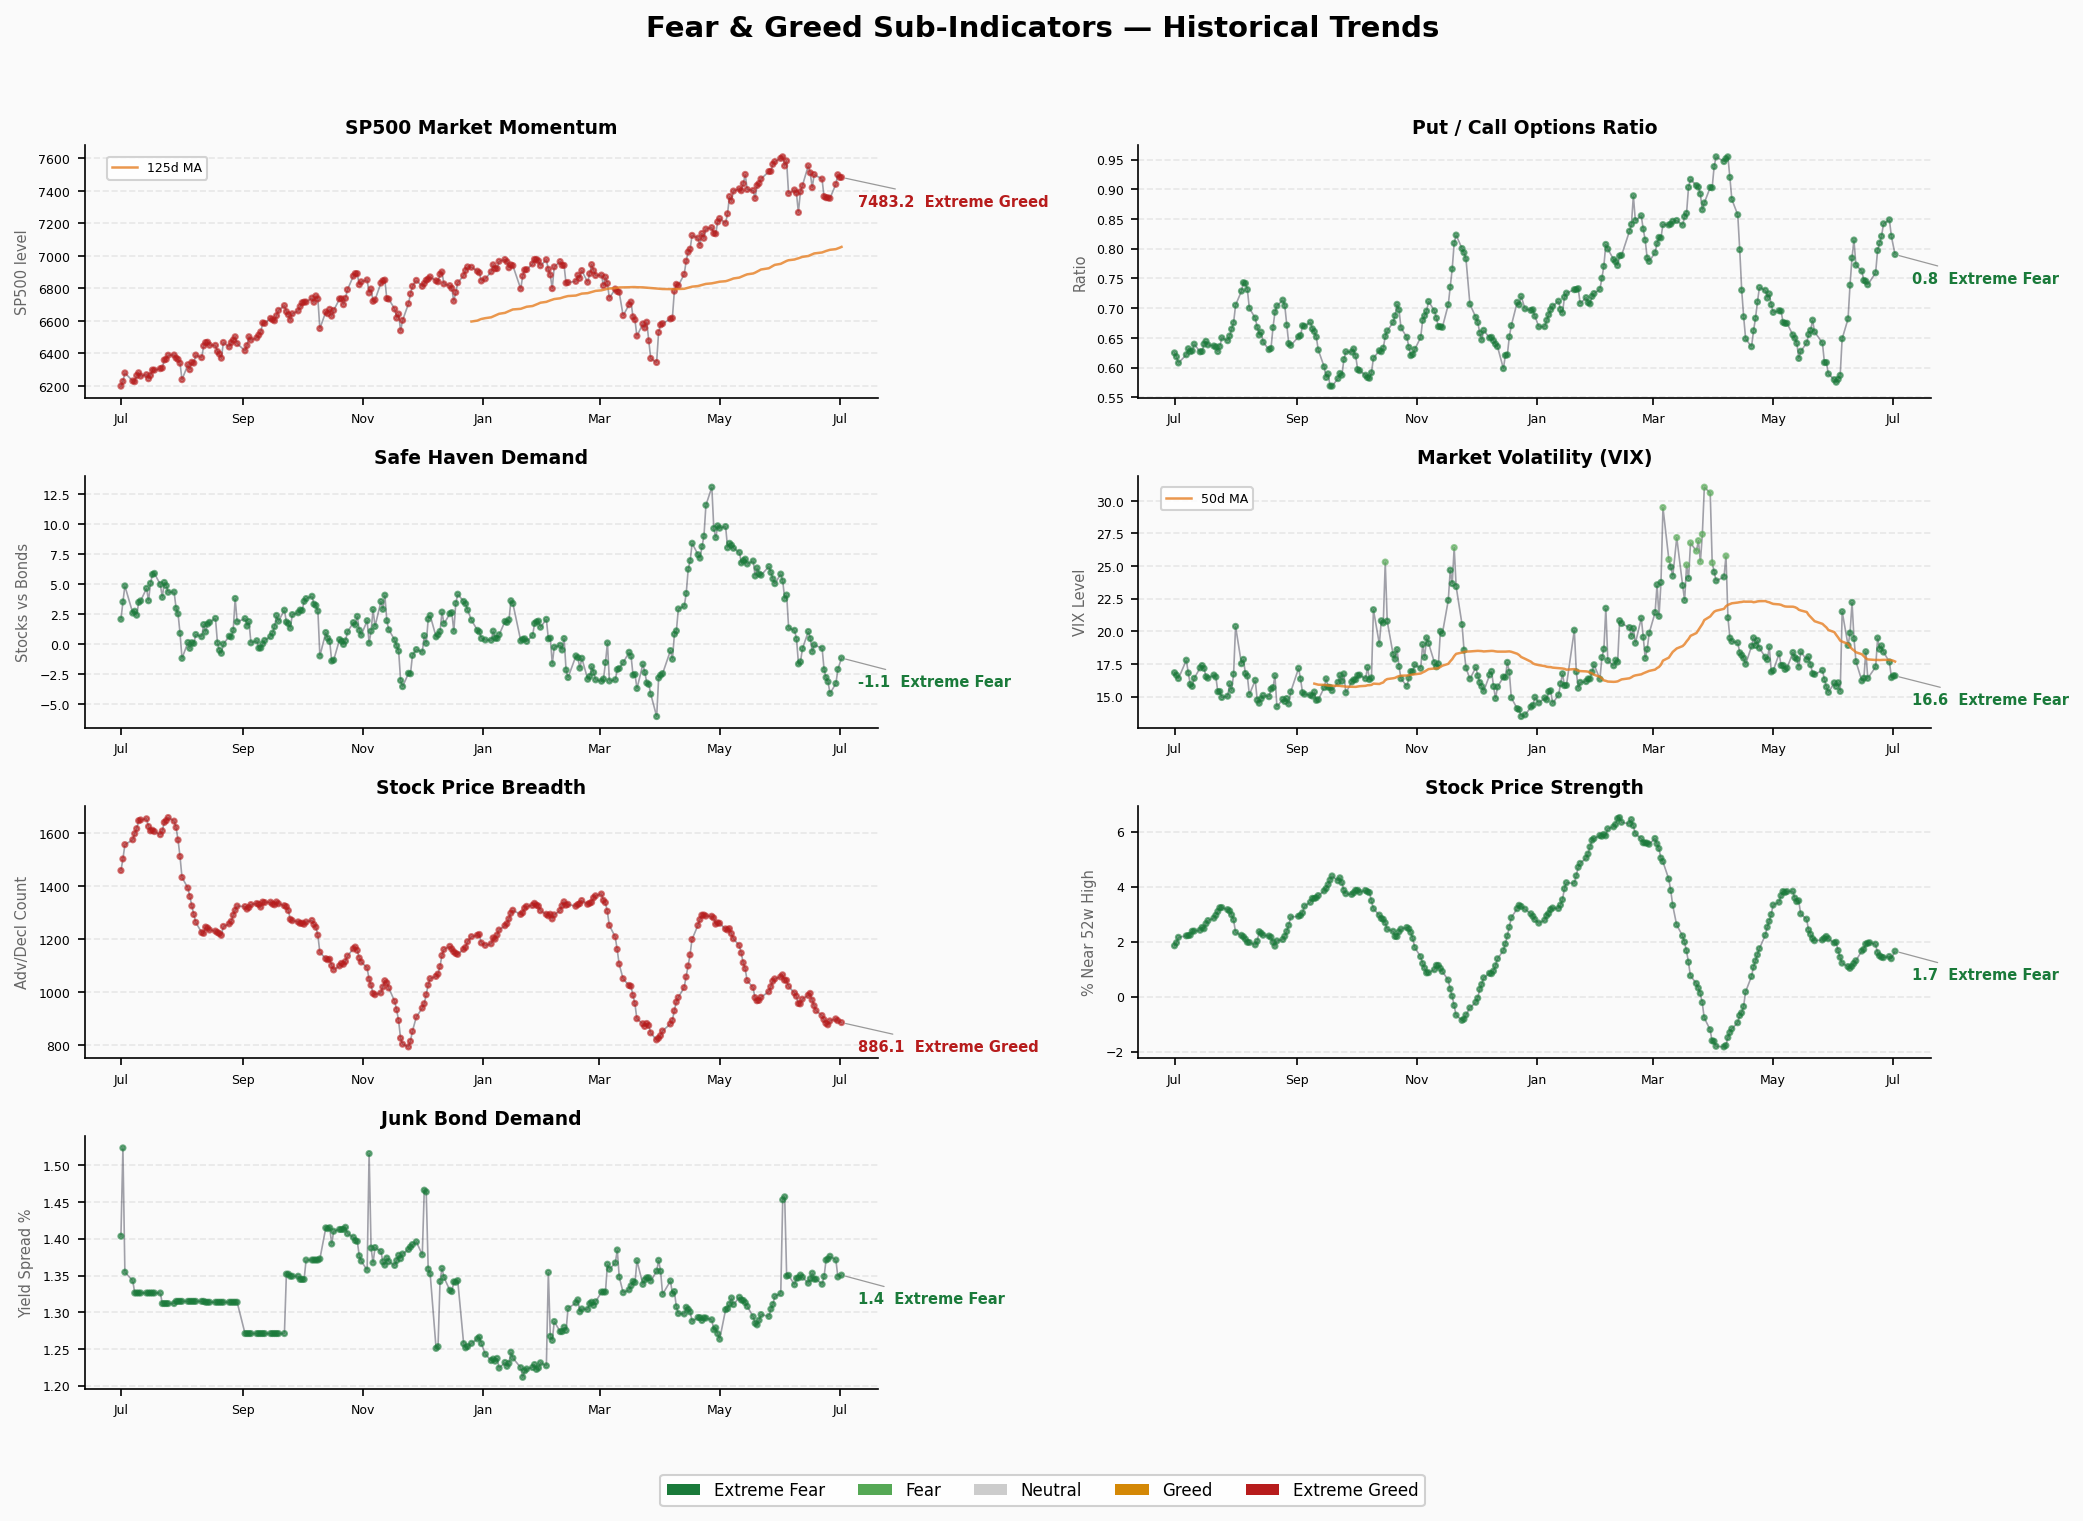
Market Momentum Detail: S&P 500 at 7,483 vs ~6,900 125-day MA (~8.4% above). Score is neutral. The index experienced a -4.1% drawdown from 7,580 to 7,267 in June, then bounced to 7,499, currently consolidating around 7,483.
Structural Contradictions
Contradictory Signals:
Neutral Momentum vs Fear Composite: S&P 500 remains above its 125-day MA (momentum score 50/neutral), yet the composite sits at 31.9 (fear). This implies fear is driven by non-price factors — likely options market stress, safe-haven demand, or deteriorating market breadth.
Short-term Bounce vs Medium-term Decline: The 26→31.9 weekly bounce (+5.9 points) signals a near-term floor. But the index is still down 40%+ from 56.5 a month ago. This pattern — “panic followed by tepid recovery” — historically often precedes further testing of lows.
Year-ago 67.5 vs Current 31.9: On a 12-month basis, sentiment has shifted from greed to fear. This isn’t cyclical noise — it’s a structural sentiment regime change.
Historical Pattern: When the composite lingers around 30, subsequent rebounds tend to be powerful. But a break below 20 (extreme fear) would signal genuine crisis formation.
Trend Assessment
- Zone Duration: Composite has lingered in Fear (25-40) for ~2-3 weeks since mid-June
- Turning Signal: Bounce from 26.0 to 31.9 provides short-term stabilization
- Key Watch: Break above 40 confirms recovery; drop below 25 signals potential extreme fear
🚨 Crisis Pre-Signal Dashboard
1. Credit Spreads
- High-Yield OAS: 2.75% | 🟢 Normal
- Investment-Grade OAS: 0.76%
- Trend: Stable within normal range
- Analysis: HY OAS below the 3% warning threshold. Credit markets haven’t flagged distress. But credit spreads are a lagging indicator — they often only spike in the final moments before a crisis. Current “normal” ≠ “safe.”
2. Yield Curve
- 10Y-2Y Spread: +31bp | 🟢 Normal (positive)
- 10Y: 4.44% | 2Y: 4.14% | 30Y: 4.91%
- Trend: Curve normalizing/steepening
- Analysis: Yield curve has recovered from inversion. +31bp is healthy. 30Y near 5% reflects elevated long-end inflation expectations, but the curve shape itself is non-threatening. Historically, the 6-18 months after curve normalization are the highest-recession-probability window — we’re in that window now.
3. Margin Debt
- Latest: $1.304T (Apr 2026)
- YoY Change: Data pending (FINRA monthly release)
- Status: 🔴 All-time high territory
- Analysis: $1.3T in margin debt means retail and leveraged investors are maxed out. When markets fall, margin calls create chain-reaction selling — the same mechanism that amplified the 2021 GameStop squeeze and the 2008 financial crisis.
4. IPO Count
- 2026 YTD: ~73 (Renaissance Capital est.)
- vs Prior Year: Roughly flat
- Status: 🟡 Moderate
- Analysis: 73 IPOs is a moderate pace — far from the 2020-2021 frenzy (100+ in same period). IPO volume alone isn’t overheated, but quality matters — a flood of low-quality listings would be a top signal.
5. Fund Flows
- 2026 YTD ETF Net Inflows: ~$856B
- Record?: ⚠️ Possibly record levels
- Status: 🔴 Record inflows
- Analysis: $856B in ETF inflows reflects both the structural shift from active to passive and retail money pouring in. Need to separate “structural growth” (ETF replacing mutual funds secularly) from “cyclical overheating.” Current levels likely reflect both.
Composite Assessment
| Signal | Status | Risk Level |
|---|---|---|
| Credit Spreads | HY OAS 2.75% 🟢 | Low |
| Yield Curve | +31bp positive 🟢 | Low |
| Margin Debt | $1.3T ATH 🔴 | High |
| IPO Count | 73 moderate 🟡 | Medium |
| Fund Flows | $856B record 🔴 | High |
Verdict: 2🟢 / 1🟡 / 2🔴 — Medium-High Risk. Credit markets and yield curve show no distress, but margin debt and ETF inflows are at extreme levels. The market’s internal leverage and crowding are elevated. Any negative catalyst (geopolitical, policy surprise, earnings miss) could trigger a leveraged cascade that turns a routine pullback into a sharp sell-off.
Core Contradiction: External conditions (rates, credit) look benign; internal structure (leverage, crowding) hides fragility. This is the classic “calm before the storm” pattern — but calm can persist indefinitely, or shatter without warning.