CNN Fear & Greed Analysis 2026-07-01
FNG composite 31.2 Fear, down from 59.5 one month ago. Crisis indicators: 2 green, 2 red. Margin debt $1.42T record high, ETF inflows $1T+ record pace.
📊 CNN Fear & Greed Analysis — 2026-07-01
Composite Index
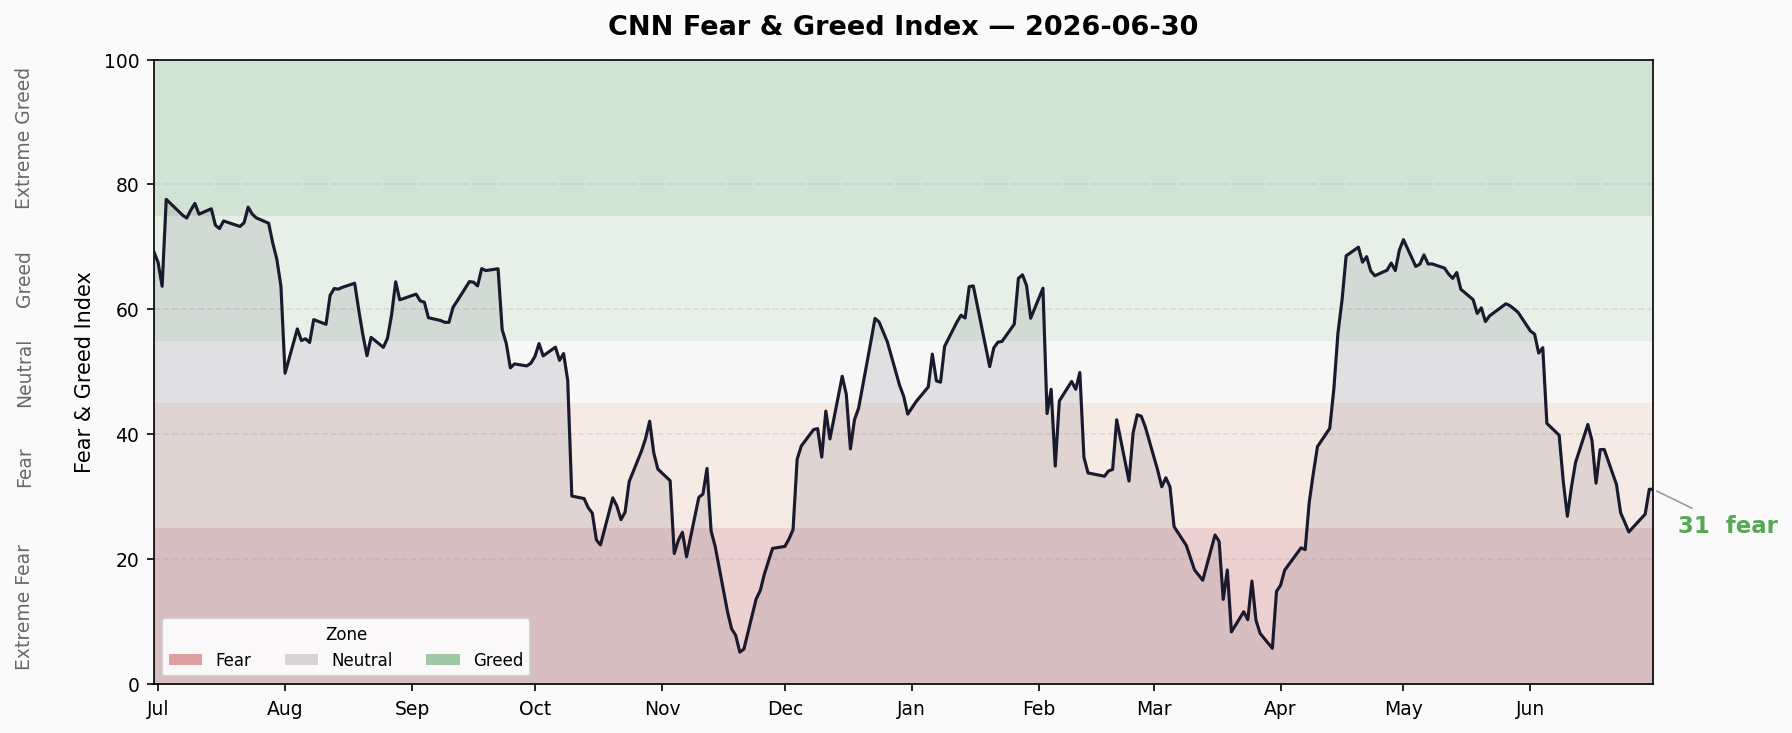
Current Reading: 31.2 — Fear 😰
| Timeframe | Score | Change |
|---|---|---|
| Previous Close | 27.0 | +4.2 ↑ |
| 1 Week Ago | 27.5 | +3.7 ↑ |
| 1 Month Ago | 59.5 | -28.3 ↓↓ |
| 1 Year Ago | 69.2 | -38.0 ↓↓ |
Range Duration: Been in Fear zone (25-40) for 12 trading days since dropping below 50 Neutral on June 18. Hit 24.4 Extreme Fear on June 25, then modestly bounced.
Trend: Last 10 days: 37.6→37.6→32.0→27.5→26.0→24.4(trough)→25.1→27.3→31.2→31.2. Bouncing from Extreme Fear lows but still well below one month ago.
7 Sub-Indicators Scan
| Indicator | Score | Rating | Raw Value / Notes | Direction |
|---|---|---|---|---|
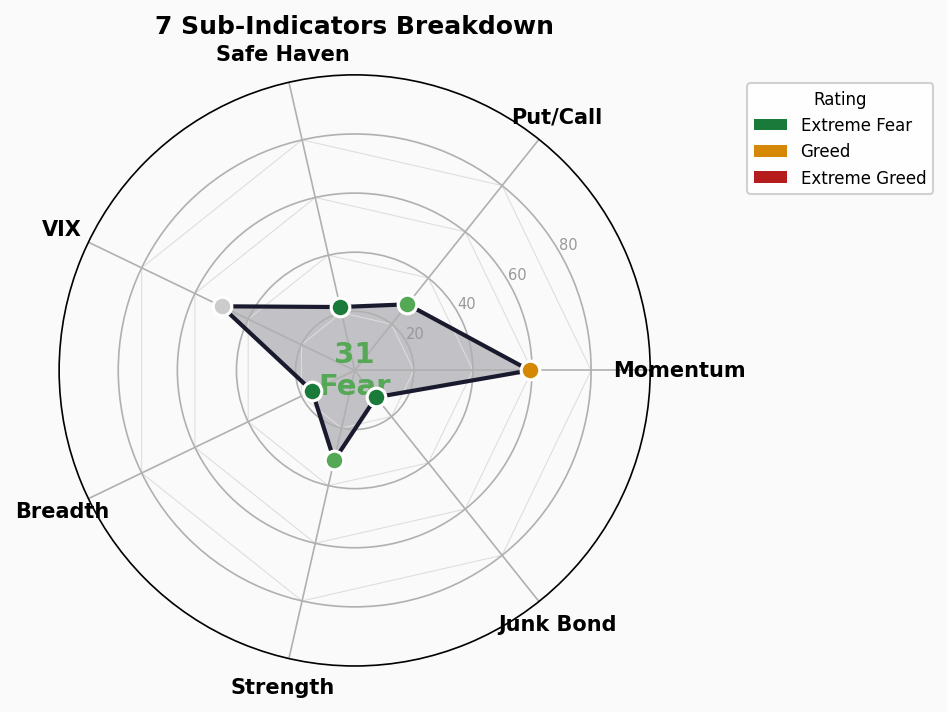
| Market Momentum (SP500) | 59.2 | 🟡 Greed | SP500 above 125-day MA | → |
| Stock Price Strength | 31.2 | 🔴 Fear | 52-week high/low ratio depressed | → |
| Stock Price Breadth | 16.0 | 🔴 Extreme Fear | Very low advancing issues | ↓ |
| Put/Call Options | 28.6 | 🔴 Fear | Elevated put activity, bearish sentiment | → |
| Market Volatility VIX | 50.0 | ⚪ Neutral | VIX at neutral level | → |
| Junk Bond Demand | 11.6 | 🔴 Extreme Fear | Extremely low demand for high-yield | ↓ |
| Safe Haven Demand | 22.0 | 🔴 Extreme Fear | Flight to safety assets | ↓ |
Structural Divergence Analysis
Extreme Values (<20):
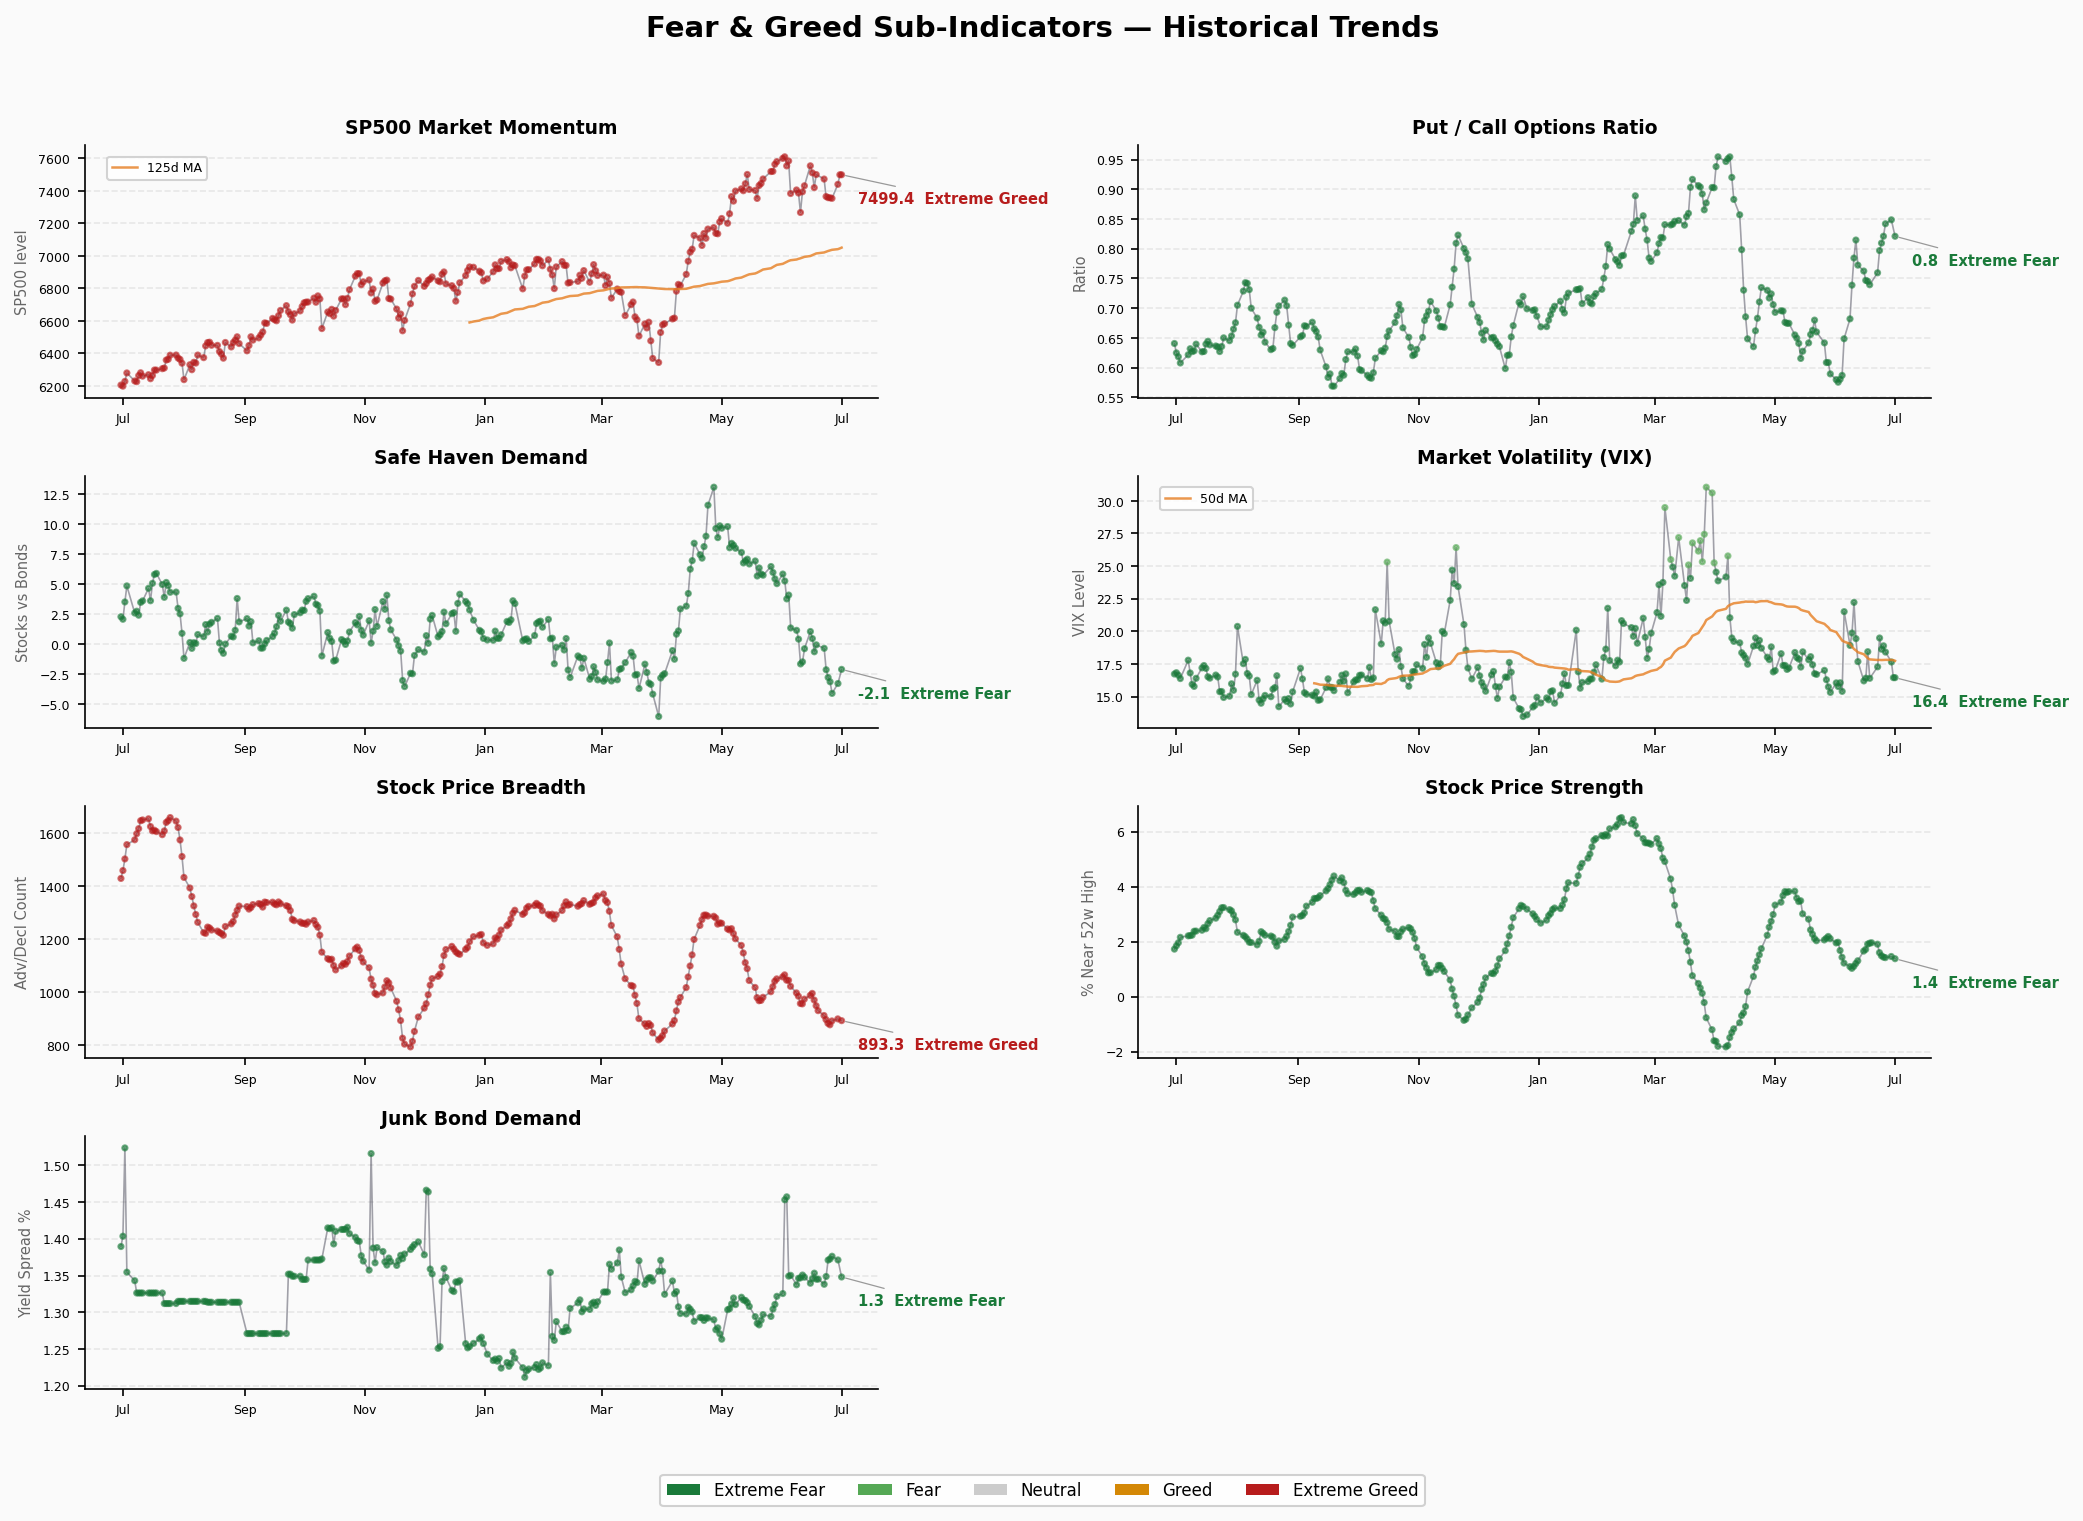
- Stock Price Breadth 16.0 — Extreme Fear, indicating very low market participation; index propped up by few mega-caps while broad market declines
- Junk Bond Demand 11.6 — Extreme Fear, credit markets extremely risk-averse; capital fleeing high-yield
Key Contradictions:
- SP500 Momentum (59.2 Greed) vs Breadth (16.0 Extreme Fear) — Classic “top divergence” signal. Index looks fine but underlying breadth has collapsed, meaning rally concentrated in a few large-cap names
- VIX (50 Neutral) vs Junk Bond Demand (11.6 Extreme Fear) — Panic the VIX isn’t reflecting has already spread to credit markets
- Safe Haven Demand (22 Extreme Fear) — Capital fleeing risk assets, but VIX hasn’t spiked accordingly — possible institutional silent rebalancing
Trend Assessment
- Range: Operating in Fear zone (25-40) since June 18, no bottoming signal yet
- Weak Bounce: From 24.4 to 31.2 = only 7 points, now stalling
- Structural Deterioration: Breadth and junk bond demand both at Extreme Fear and worsening
- Historical Comparison: One year ago 69.2 (Greed), now 31.2 (Fear) — 58% sentiment reversal
🚨 Crisis Early Warning Dashboard
1. Credit Spreads
- High Yield OAS: 2.80% | 🟢 Normal
- Investment Grade OAS: 0.76%
- Trend: Stable, below 3% warning threshold
- Analysis: Credit spreads haven’t alarmed yet, but watch if junk bond Extreme Fear leads to spread widening
2. Yield Curve
- 10Y-2Y Spread: +30bp | 🟢 Normal
- 10Y: 4.38% | 2Y: 4.10% | 30Y: 4.86%
- Trend: Normal but flat
- Analysis: Curve back in positive territory, recession signal fading, though 10Y-30Y at -48bp shows long-end weakness
3. Margin Debt
- Latest: $1.416T (May 2026)
- YoY Change: +53.7%
- Status: 🔴 Record High
- Analysis: Two consecutive monthly increases, May +8.5% MoM. Record leverage = extreme fragility — any correction risks cascading liquidations
4. IPO Count
- 2026 YTD: ~73 (incl. Arm and other mega-IPOs)
- vs Same Period Last Year: Increased from ~50-60
- Status: 🟡 Warm to Hot
- Analysis: Active but not overheated; 73 is elevated-normal
5. Fund Flows
- 2026 YTD ETF Net Inflows: $1T+ (crossed milestone June 17)
- Record Pace: Yes — fastest to $1T in history
- Status: 🔴 Euphoric
- Analysis: 640 new ETFs launched YTD, active ETFs at record $320B inflows. Classic late-cycle crowded trade
Overall Assessment
| Signal | Status | Risk Level |
|---|---|---|
| Credit Spreads | 🟢 HY OAS 2.80% | Low |
| Yield Curve | 🟢 10Y-2Y +30bp | Low |
| Margin Debt | 🔴 $1.42T Record | High |
| IPO Count | 🟡 73 YTD | Medium |
| Fund Flows | 🔴 $1T+ Record | High |
Composite: 2🟢 / 1🟡 / 2🔴 — Credit markets appear calm on the surface but underlying cracks are showing (Extreme Fear in breadth and junk bonds). Margin leverage and ETF inflows both at records signal severe crowded positioning. FNG 31.2 Fear combined with dual Extreme Fear readings in breadth and junk bonds has historically preceded further pullbacks. Current risk level: Medium-High.
⚠️ Key Monitoring Points: HY OAS breaking above 3% or margin debt MoM decline would trigger elevated alert status.