CNN Fear & Greed Analysis 2026-06-30
Index 27 (Fear), 5/7 sub-indicators at extreme fear, credit spreads normal but margin/ETF flows at records
📉 CNN Fear & Greed Analysis — 2026-06-30
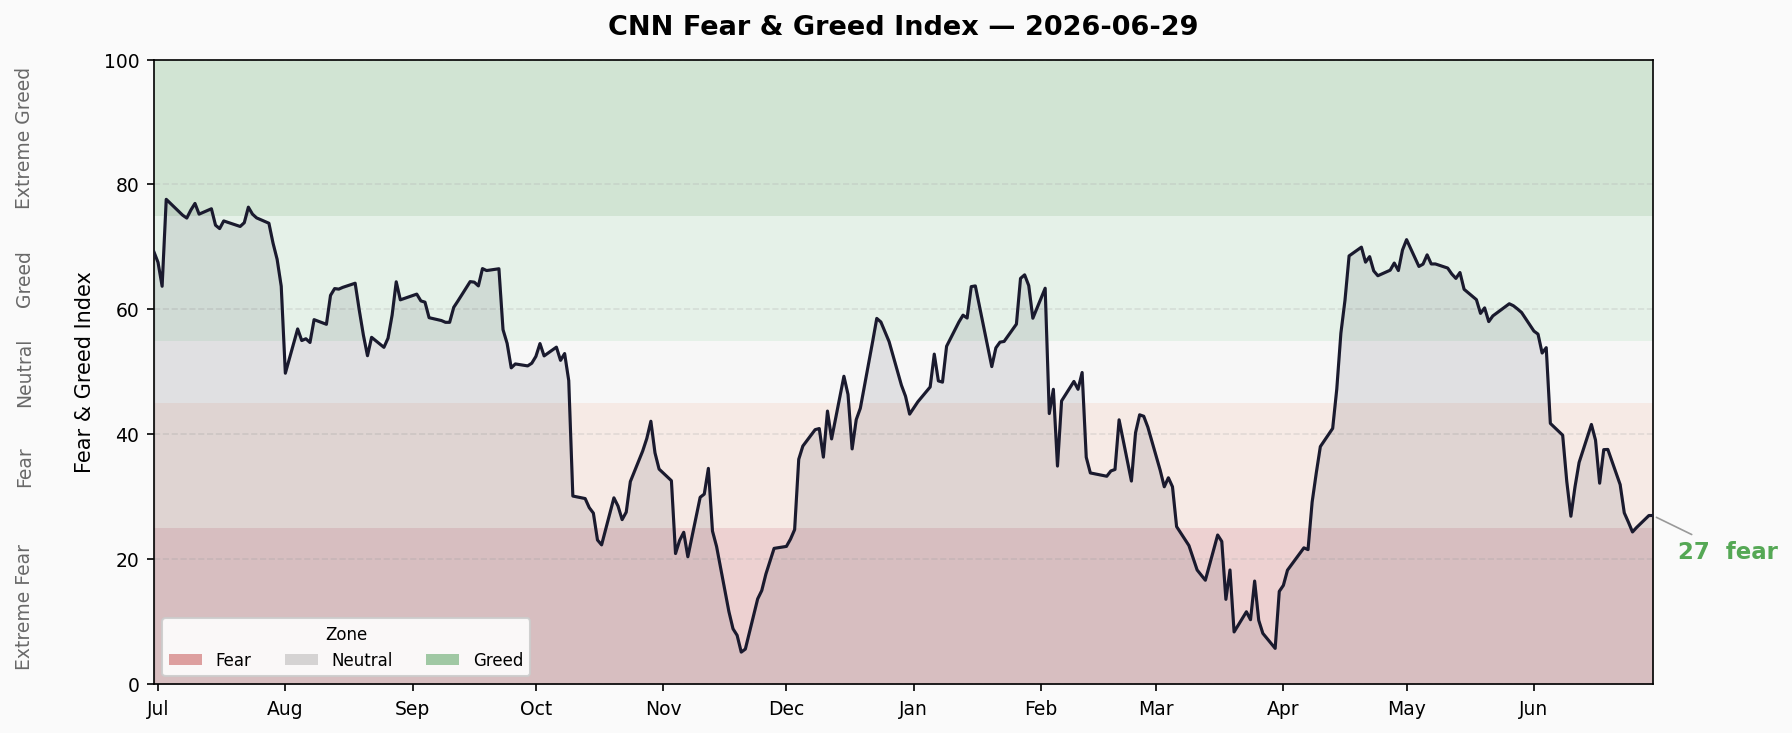
1. Composite Index
| Metric | Value | Rating |
|---|---|---|
| Today | 27.0 | Fear |
| Previous Close | 24.8 | Fear |
| 1 Week Ago | 32.0 | Fear |
| 1 Month Ago | 59.5 | Greed |
| 1 Year Ago | 64.8 | Greed |
Trend Direction: +2.2 from yesterday (minor bounce), but still in fear zone. One-week trend: 32.0→27.0, deteriorating. Monthly collapse: 59.5 (greed) → 27.0 (fear) — a dramatic sentiment reversal in 30 days.
2. Seven Sub-Indicators
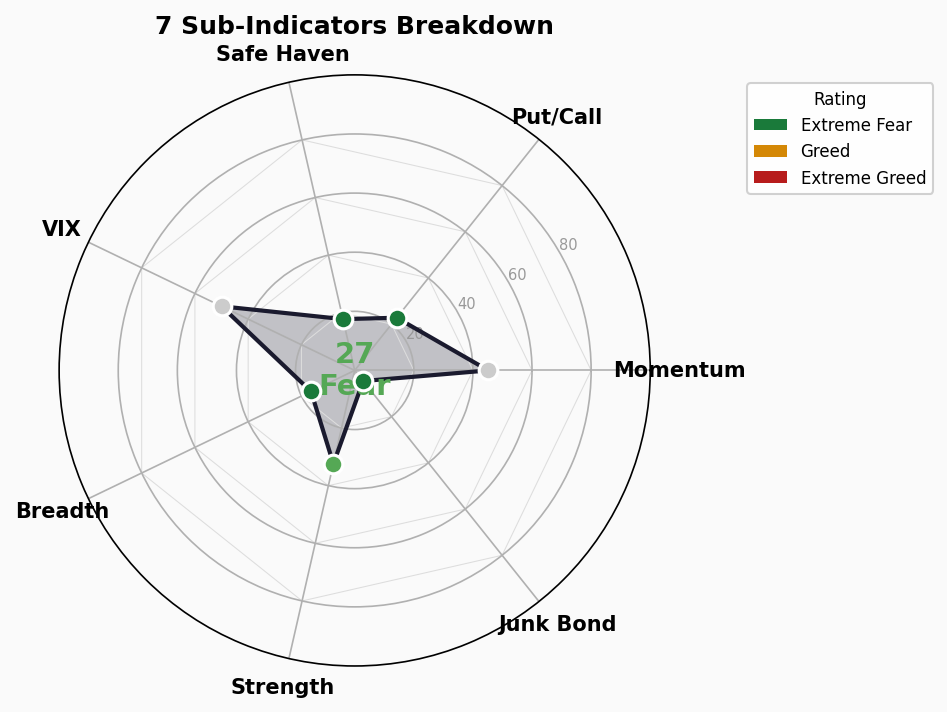
| # | Indicator | Score | Rating | Raw Value | Direction |
|---|---|---|---|---|---|
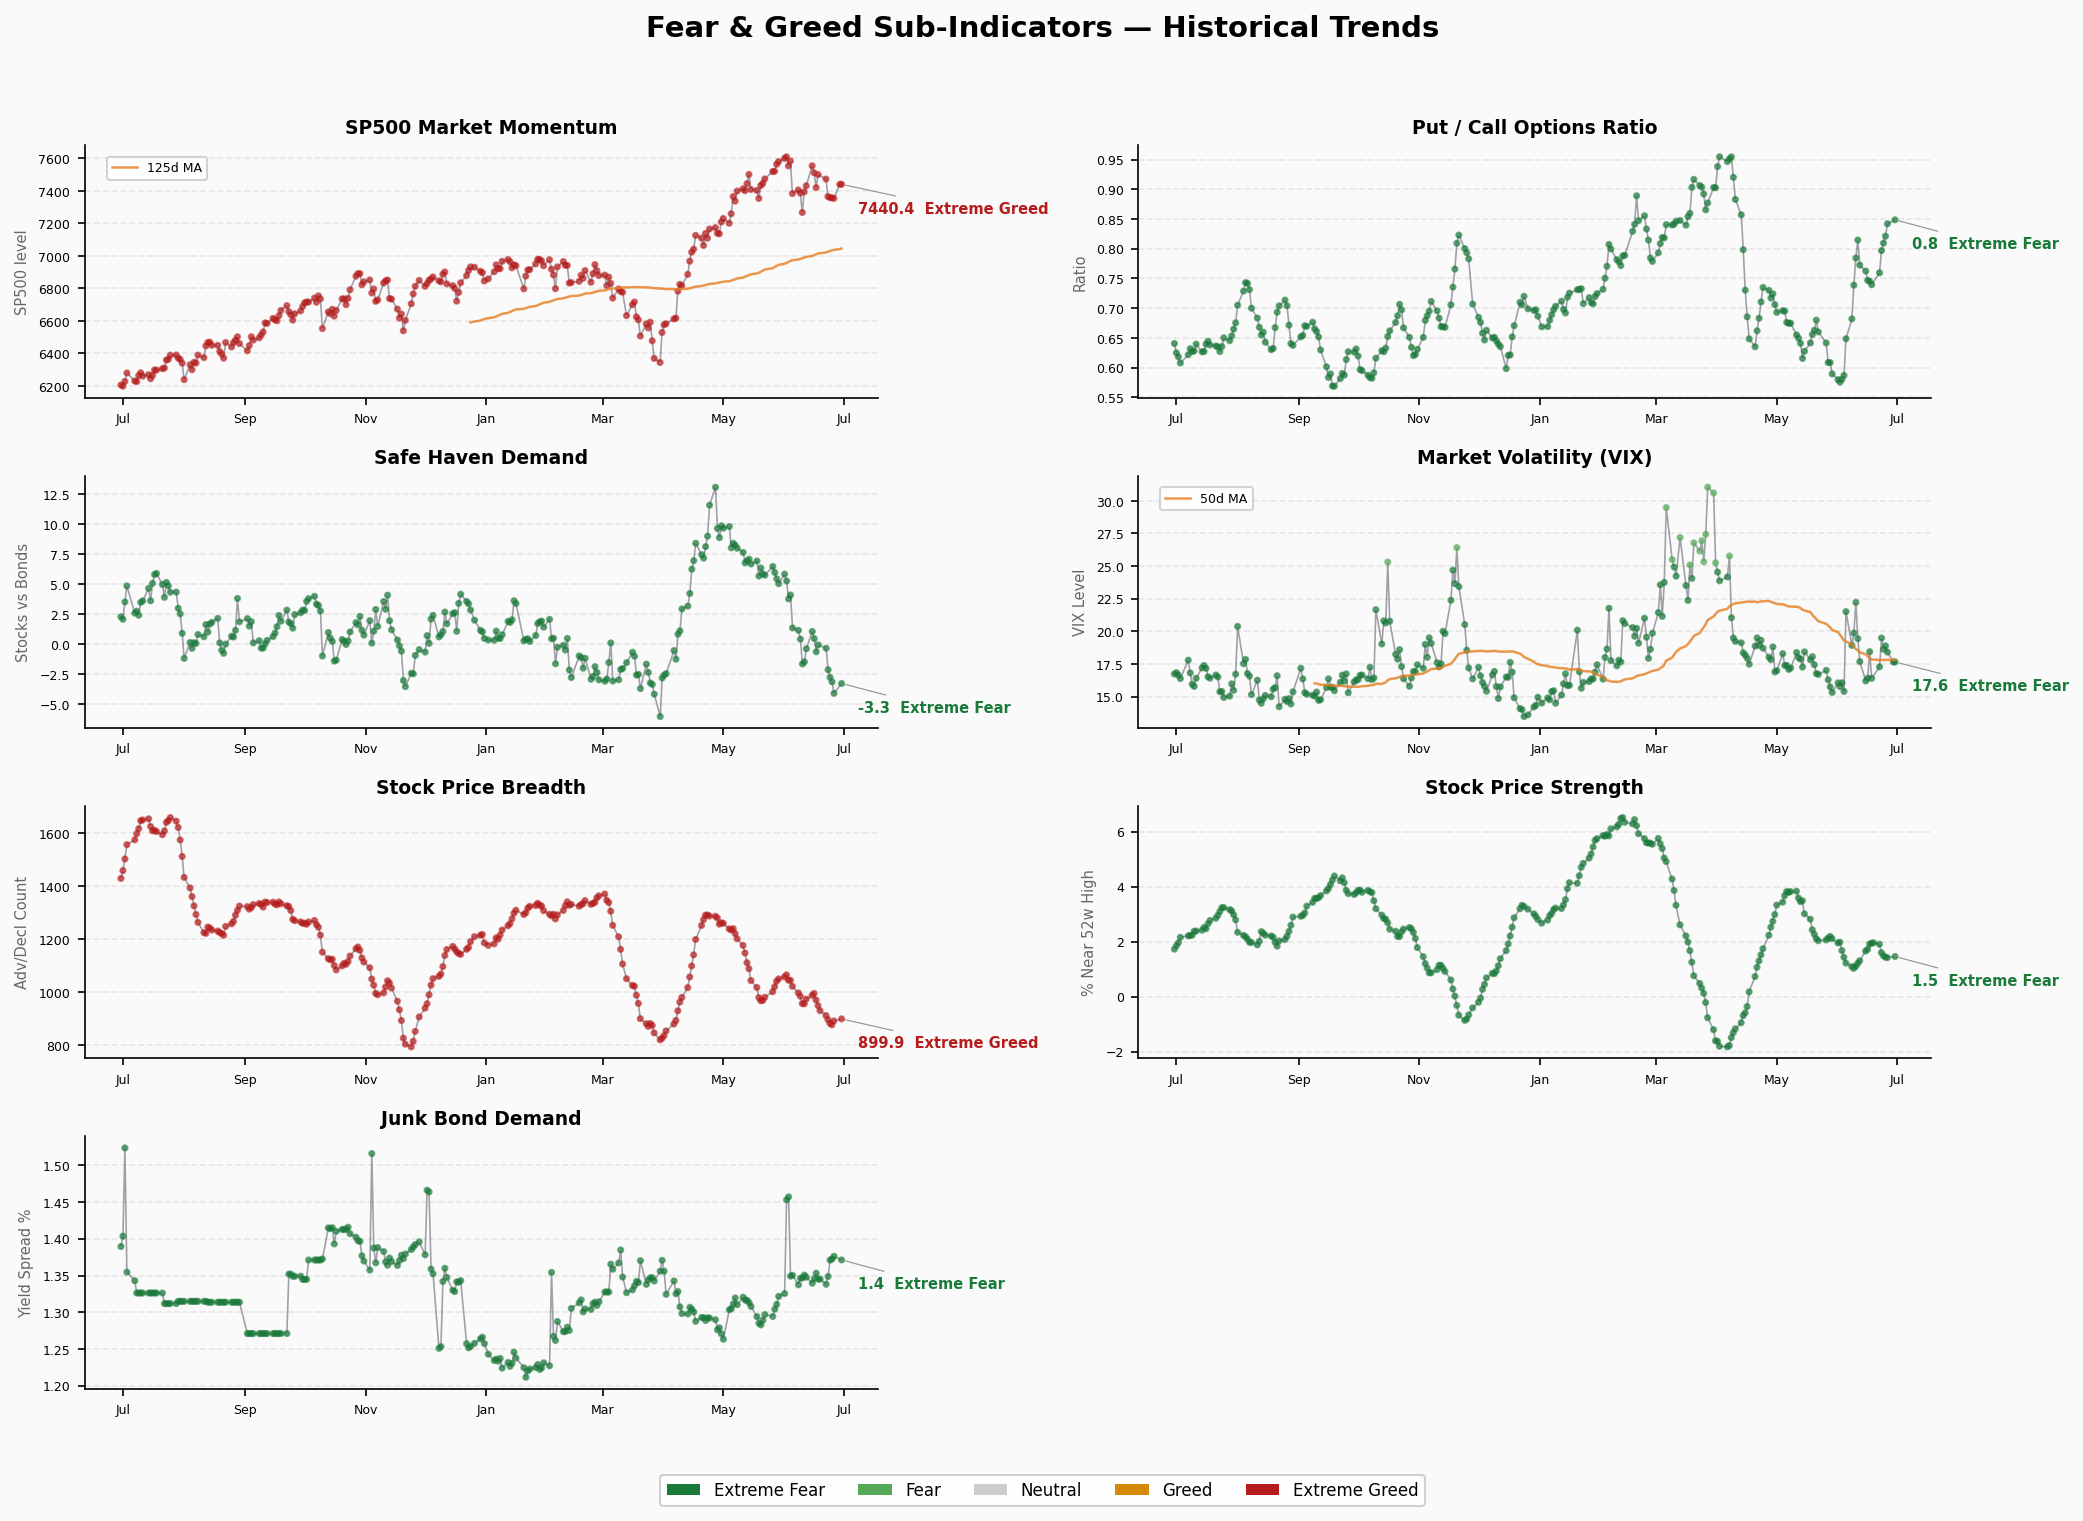
| 1 | Market Momentum (S&P 500) | 45.2 | 🟡 Neutral | S&P 7,440 | ↔ Flat |
| 2 | Stock Price Strength | 32.4 | 🔴 Fear | New High/Low ratio 1.46 | ↘ Declining |
| 3 | Stock Price Breadth | 16.4 | 🔴 Extreme Fear | McClellan -3.25 | ↘ Worsening |
| 4 | Put/Call Options | 22.8 | 🔴 Extreme Fear | P/C ratio 0.85 | ↘ Panicking |
| 5 | Market Volatility (VIX) | 50.0 | 🟡 Neutral | VIX 17.65 | ↔ Stable |
| 6 | Junk Bond Demand | 4.6 | 🔴 Extreme Fear | Spread 1.37% | ↘ Worsening |
| 7 | Safe Haven Demand | 17.8 | 🔴 Extreme Fear | Stock/Bond ratio -3.25 | ↘ Worsening |
3. Structural Contradictions
Extreme Value Signals:
- 🔴 Junk Bond Demand (4.6) and Price Breadth (16.4) at extreme fear (<20) — market internals severely deteriorated
- 🔴 Safe Haven Demand (17.8) extreme fear — massive capital rotation from stocks to bonds
- 🔴 Put/Call Options (22.8) extreme fear — hedging demand surging
Divergence Signals:
- ⚠️ VIX (17.65) diverges from sentiment: VIX at neutral-low but sentiment at 27 (fear). VIX typically leads sentiment by 1-2 weeks — if VIX rises next, sentiment may deteriorate further
- ⚠️ S&P 500 at highs (7,440) but breadth extremely poor: Classic “narrow leadership” — few mega-caps hold the index while majority of stocks decline
- ⚠️ Credit spreads widening while VIX stable: Credit markets pricing risk before volatility markets reflect it
4. Trend Assessment
- Duration in zone: Fear zone (20-40) for ~7 trading days (since 6/23), hasn’t touched extreme fear (<20) yet
- Reversal signals: Yesterday 24.8 → Today 27.0, minor bounce likely technical, not trend reversal
- Monthly change: 59.5 → 27.0, a 32.5-point drop in 30 days — rare in recent history
🚨 Crisis Precursor Dashboard
1. Credit Spreads
- High Yield OAS: 2.83% | 🟢 Normal (thresholds: <3% normal, 3-5% warning)
- Investment Grade OAS: 0.77% | 🟢 Normal (thresholds: <1% normal)
- Trend: Stable, no significant widening
- Analysis: Credit spreads in safe zone, but junk bond demand indicator already at extreme fear — market pricing credit risk ahead of actual spread widening. Monitor closely.
2. Yield Curve
- 10Y-2Y Spread: +28bp | 🟢 Normal (not inverted)
- 10Y: 4.38% | 2Y: 4.07% | 30Y: 4.87%
- 10Y-30Y: -49bp (mild inversion)
- Trend: Curve normalized, now stable
- Analysis: Yield curve recovered from previous inversion. But 10Y-30Y mild inversion (-49bp) signals market remains cautious on long-term growth prospects.
3. Margin Debt
- Latest: $1.416T (May 2026)
- YoY Change: +53.7%
- Status: 🔴 All-time high (second consecutive monthly record, May +8.5% MoM)
- Analysis: Margin debt at historical highs with rapid acceleration (+53.7% YoY). Amplifies gains in bull markets, but amplifies losses in corrections. One of the highest-risk crisis precursor indicators.
4. IPO Activity
- 2026 YTD: ~130 IPOs (including SPACs, ~50+ traditional)
- vs. Last Year: Increasing (2025 Q1: 15 traditional IPOs, 2026 Q1: 22)
- Status: 🟡 Warm to hot
- Analysis: IPO market active but not overheated. 2021 peak was 1,035 IPOs for full year — current pace far below frenzy. But large IPOs like SpaceX ($135→$164) show warming sentiment.
5. Fund Flows
- 2026 YTD ETF Net Inflows: >$1 Trillion (record)
- Record?: ✅ Yes (fastest inflow pace on record, January alone $156B)
- Status: 🔴 Frenzy
- Analysis: ETF inflows at historical highs, active ETFs on pace for $600B annual. Classic retail FOMO — massive capital entering at highs.一旦 market turns, redemption pressure will accelerate declines.
Composite Assessment
| Signal | Status | Risk Level |
|---|---|---|
| Credit Spreads | 🟢 Normal | ⭐ Low |
| Yield Curve | 🟢 Normal, flat | ⭐ Low |
| Margin Debt | 🔴 All-time high | ⭐⭐⭐⭐ Very High |
| IPO Activity | 🟡 Warm | ⭐⭐ Moderate |
| Fund Flows | 🔴 Frenzy | ⭐⭐⭐⭐ Very High |
Overall: 2🟢 / 1🟡 / 2🔴 — Credit and rate environment normal, but leverage and fund flow indicators flashing strong warnings. Margin debt +53.7% YoY and record ETF inflows are textbook late-cycle bubble signals. Market in “calm surface, fragile interior” state — index propped by few mega-caps while breadth extremely poor (McClellan -3.25). A catalyst (unexpected rate hike, geopolitical shock) could trigger amplified declines given concentrated holdings and high leverage.
⚠️ Risk Note: FNG at 27 (Fear) + 5/7 sub-indicators at extreme fear + margin debt at all-time high + record ETF inflows = 2 red lights on crisis precursor dashboard. Consider reducing leverage, increasing cash allocation, and rotating toward defensive sectors.
Data: CNN Fear & Greed Index, FRED, FINRA, Renaissance Capital, Morningstar | Generated: 2026-06-30 06:30 CST