CNN Fear & Greed Sentiment Analysis 2026-06-29
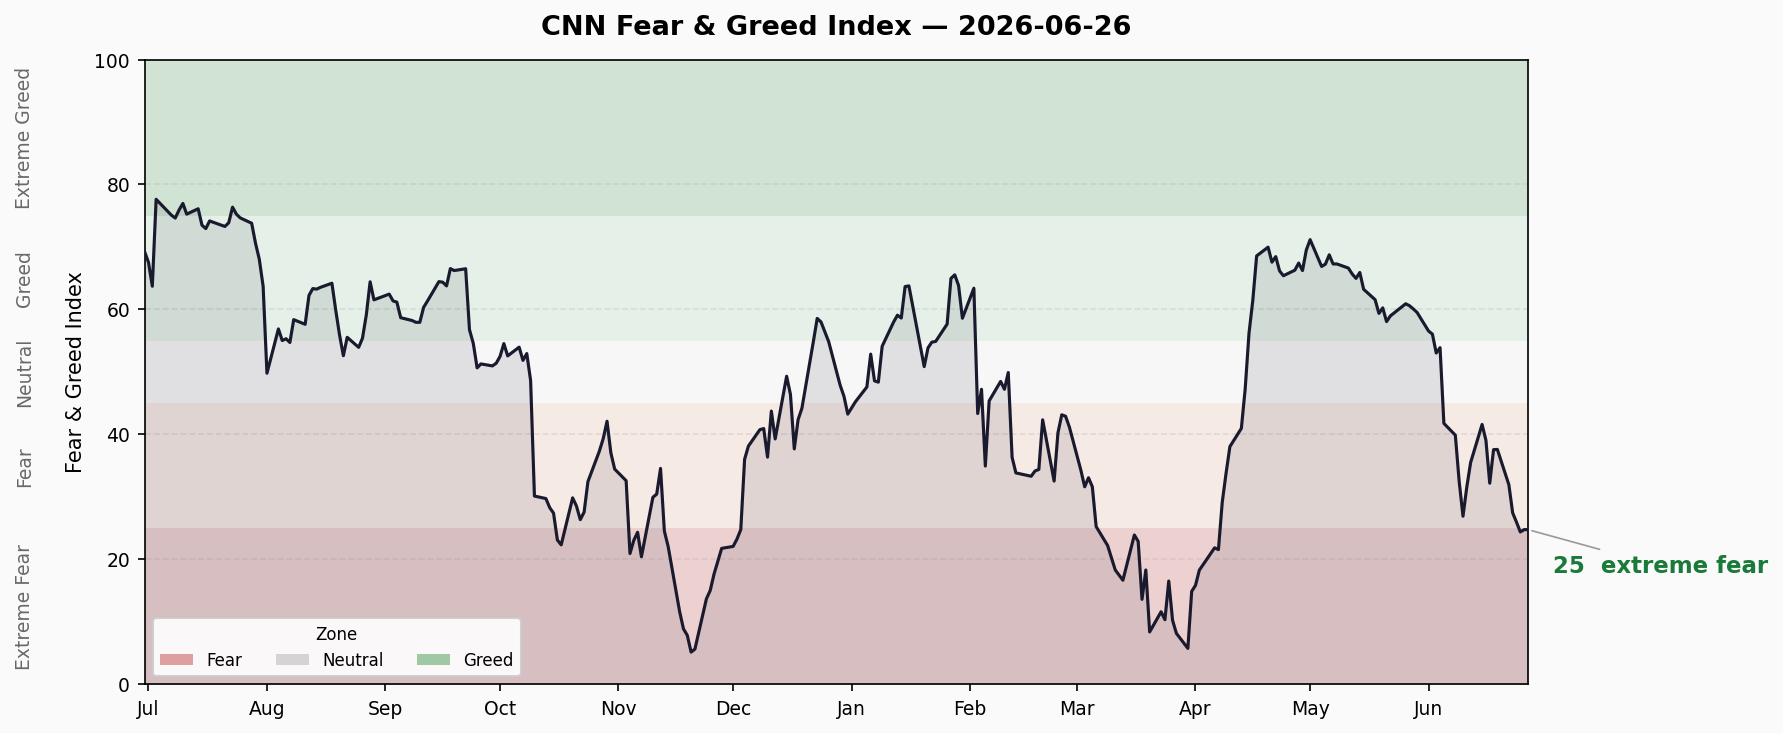
Composite index 24.8 extreme fear; 5/7 sub-indicators red; margin debt $1.42T all-time high, ETF inflows record
📊 Composite Index
Latest: 24.8 — 🟣 Extreme Fear
| Comparison | Value | Change |
|---|---|---|
| Previous Close | 25.5 | -0.7 ↓ |
| 1 Week Ago | 37.6 | -12.8 ↓ |
| 1 Month Ago | 60.9 | -36.1 ↓ |
| 1 Year Ago | 63.0 | -38.2 ↓ |
Trend: Continued decline from 39.1 to 24.8 over the past 10 days, multiple consecutive days in extreme fear territory. The index has plunged -59% from 60.9 (greed) to 24.8 (extreme fear) in one month.
🔍 Seven Sub-Indicators Scan
| # | Indicator | Score | Rating | Raw Value | Trend |
|---|---|---|---|---|---|
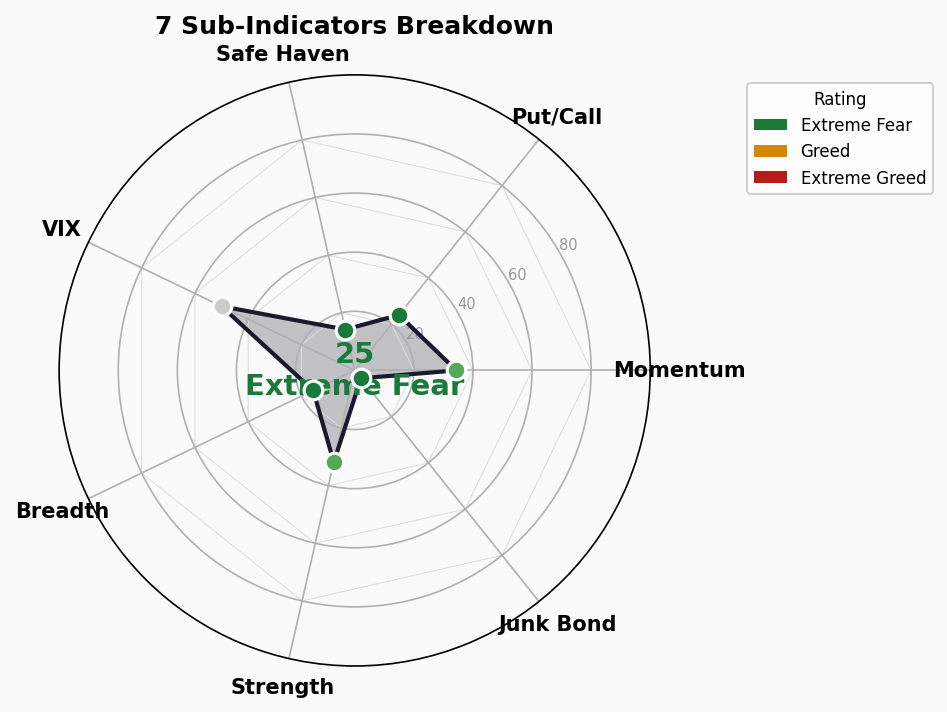
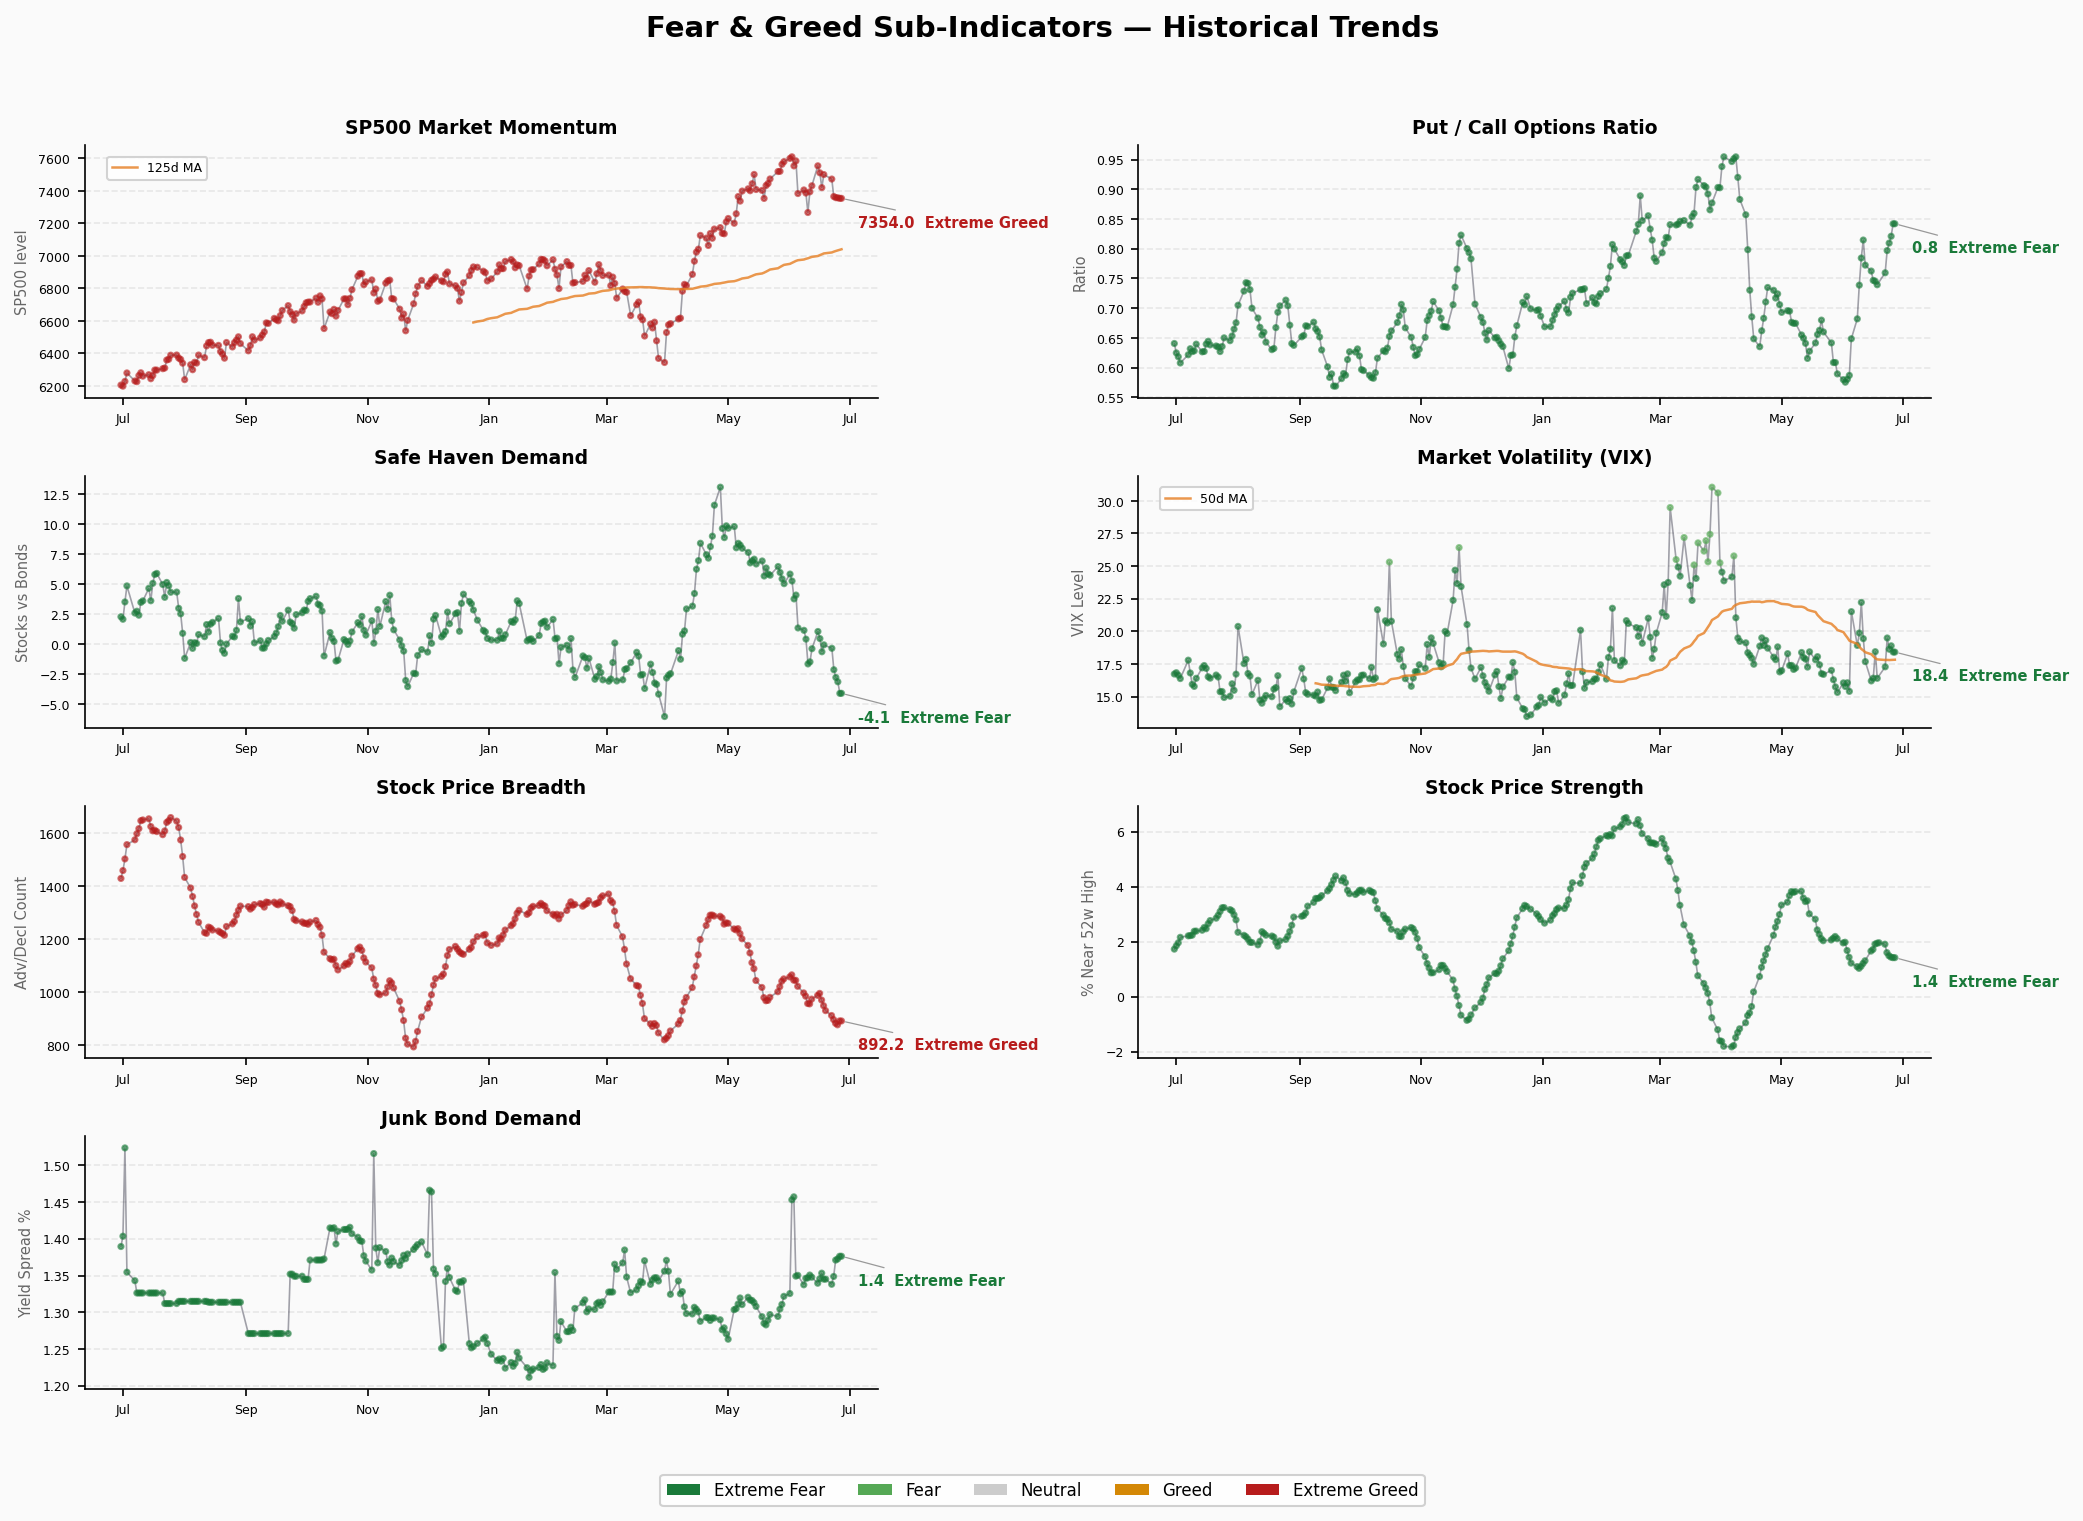
| 1 | Market Momentum (S&P 500 vs 125-day MA) | 34.4 | 🟡 Fear | 7,354 (below 125-day MA) | ↓ from 60+ to 34 |
| 2 | Stock Price Strength (new highs - new lows) | 31.8 | 🟡 Fear | Net new highs 1.42 | ↓ declining |
| 3 | Stock Price Breadth (advancing/declining volume) | 15.6 | 🔴 Extreme Fear | AD line 892 | ↓ sharp decline |
| 4 | Put/Call Options Ratio | 24.0 | 🔴 Extreme Fear | P/C ratio 0.842 | ↑ put demand surging |
| 5 | Market Volatility (VIX) | 50.0 | ⚪ Neutral | VIX 50-day avg 18.41 | → stable |
| 6 | Safe Haven Demand (bonds vs stocks) | 14.2 | 🔴 Extreme Fear | -4.07 | ↑ capital flooding into bonds |
| 7 | Junk Bond Demand (HY spread) | 3.4 | 🔴 Extreme Fear | 1.38% | ↑ credit risk rising |
Extreme Value Analysis
🔴 Extreme Fear (Score < 20):
- Stock Price Breadth 15.6 — Massive individual stock declines, extremely low market participation, not just a few large-caps propping up indices
- Safe Haven 14.2 — Capital frantically flowing into treasuries and safe assets, risk appetite collapsed
- Junk Bond Demand 3.4 — Excess return of junk bonds over treasuries nearly vanished, credit market sounding alarm
🟡 Fear (Score 20-40):
- Put/Call 24.0 — Options market heavily bearish, but not yet at extremes
- Market Momentum 34.4 — S&P 500 below 125-day MA, technically weakening
- Stock Price Strength 31.8 — Number of new highs drastically shrinking
⚠️ Structural Divergence:
- VIX score 50 (neutral) vs Junk Bond score 3.4 (extreme fear) — massive gap
- This means: stock volatility hasn’t fully reflected credit market panic
- Historically, such divergences resolve through VIX spiking — volatility playing catch-up
Trend Assessment
- Composite index plunged from 60.9 (greed) to 24.8 (extreme fear) in 1 month, a -59% drop
- Extreme fear territory has persisted for ~1 week, with signal intensity accelerating
- Historically, after FNG drops below 20, it typically takes 1-3 months to bottom and reverse
- Currently in fear acceleration phase, no stabilization signals yet
🚨 Crisis Precursor Indicator Dashboard
1. Credit Spreads
- High Yield OAS: 2.78% | 🟢 Normal
- Investment Grade OAS: 0.76%
- Trend: Slightly higher than previous day, but still in normal range
- Analysis: Credit spreads haven’t entered warning territory (3%+), but Junk Bond Demand score is only 3.4, suggesting market pricing of future credit risk is deteriorating. Lagging indicator vs leading indicator showing divergence.
2. Yield Curve
- 10Y-2Y Spread: +31bp | 🟢 Normal (inversion resolved)
- 10Y: 4.40% | 2Y: 4.09% | 30Y: 4.86%
- Trend: Curve steepening, long-end yields rising
- Analysis: Yield curve fully normalized. 10Y-30Y spread -46bp (long-end inversion) still warrants monitoring, but the main curve is healthy. Long-end rate increase reflects inflation expectations and fiscal pressure.
3. Margin Debt
- Latest: $1.42T (May 2026)
- YoY Change: +53.7%
- Status: 🔴 All-time high
- Analysis: May margin debt jumped 8.5% to $1.42T, second consecutive monthly record. +53.7% YoY leverage growth is extremely rare. Similar leverage surges preceded the 2000 and 2007 crashes. FINRA’s new intraday margin requirements (effective June 4) may suppress future leverage growth.
4. IPO Count
- 2026 YTD: ~73 (Renaissance Capital estimate)
- vs Same Period Last Year: Increased (2025 Q1 was only 15/$7.9B)
- Status: 🟡 Moderate-to-warm
- Analysis: 73 IPOs not manic (2021 exceeded this in a single month). PwC Q1 data shows 22 traditional IPOs raising $9.4B. 2025 full year was ~202, current pace roughly in line.
5. Fund Flows
- 2026 YTD ETF Net Inflows: ~$1T+ (surpassed $1T by June 26)
- Record?: Yes — on pace for ~$1.9T full year, far exceeding historical records
- Status: 🔴 Frenzy
- Analysis: ETF fund flows at historical frenzy levels. Active ETFs set monthly record $70B, YTD $320B. VOO leading with $75.69B inflows. State Street reports second-best monthly total on record in May. Massive passive inflows mean market ignoring stock selection — potential liquidity risk when FNG is in extreme fear.
Overall Assessment
| Signal | Status | Danger Level |
|---|---|---|
| Credit Spread (HY OAS) | 2.78% 🟢 | ⬜ Low |
| Credit Spread (IG OAS) | 0.76% 🟢 | ⬜ Low |
| Yield Curve | +31bp 🟢 | ⬜ Low |
| Margin Debt | $1.42T 🔴 | 🟥 High |
| IPO Count | ~73 🟡 | 🟧 Medium |
| ETF Fund Flows | $1T+ 🔴 | 🟥 High |
Overall Verdict: 2🟢 / 1🟡 / 2🔴 — Traditional macro indicators (credit spreads, yield curve) still healthy, but leverage and fund flows at extreme levels. The contradiction between FNG composite at 24.8 (extreme fear) and margin debt at all-time highs is the most dangerous signal — market sentiment has collapsed, but leverage hasn’t been unwound yet. Historical experience shows this combination often precedes forced-liquidation-driven liquidity spirals that haven’t begun.
Risk Warning: This is not a “business as usual” situation. FNG has plunged from 60.9 to 24.8 in one month, with 5/7 sub-indicators flashing red. While credit spreads haven’t blown out, the market is already pricing in worst-case scenarios. Stay vigilant, control positions.