CNN Fear & Greed Analysis 2026-06-27
Composite index at 24.8 extreme fear; 6 of 7 sub-indicators in fear/extreme fear; margin debt and ETF inflows at record highs
📉 CNN Fear & Greed Analysis — 2026-06-27
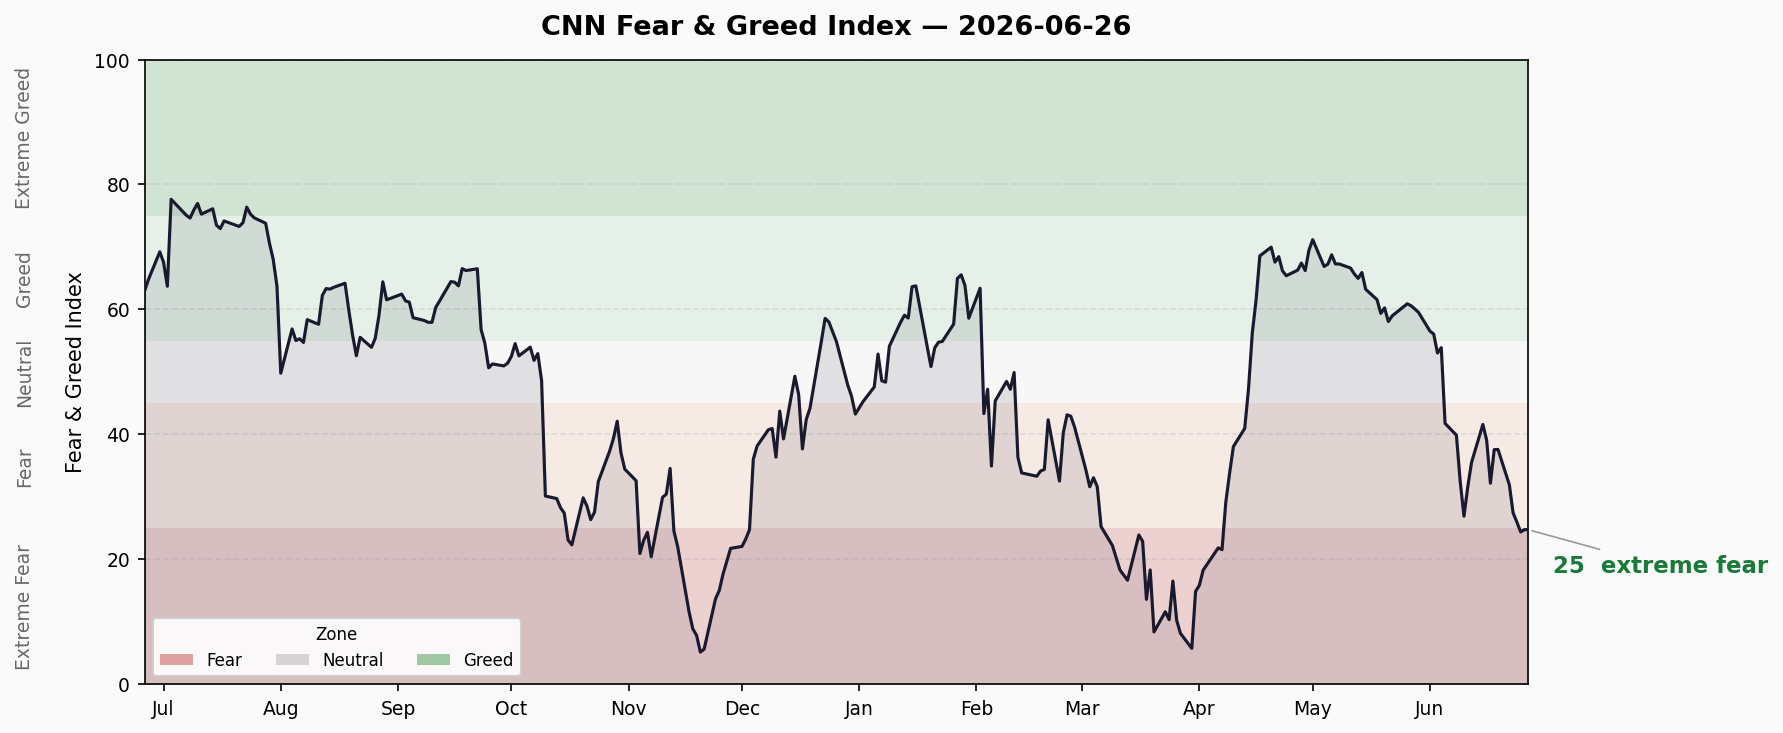
Composite Index: 24.8 / 100 | Rating: 🔴 Extreme Fear
1. Composite Index Trend
| Date | Score | Rating | Change |
|---|---|---|---|
| 06-16 | 39.1 | Fear | — |
| 06-17 | 32.2 | Fear | ↓ -6.9 |
| 06-18 | 37.6 | Fear | ↑ +5.4 |
| 06-19 | 37.6 | Fear | → flat |
| 06-22 | 32.0 | Fear | ↓ -5.6 |
| 06-23 | 27.5 | Fear | ↓ -4.5 |
| 06-24 | 26.0 | Fear | ↓ -1.5 |
| 06-25 | 24.4 | Extreme Fear | ↓ -1.6 |
| 06-26 | 24.8 | Extreme Fear | ↑ +0.4 |
| 06-27 | 24.8 | Extreme Fear | → flat |
10-Day Trend: Declined from 39.1 to 24.8, cumulative drop of -14.3 points. Now 3 consecutive days in extreme fear territory (<25).
Trend Assessment: Index consolidating near 25, deceleration in decline but no reversal signal yet. Bottoming phase, direction unclear.
2. Seven Sub-Indicators
| # | Indicator | Score | Rating | Raw Value | Direction | Interpretation |
|---|---|---|---|---|---|---|
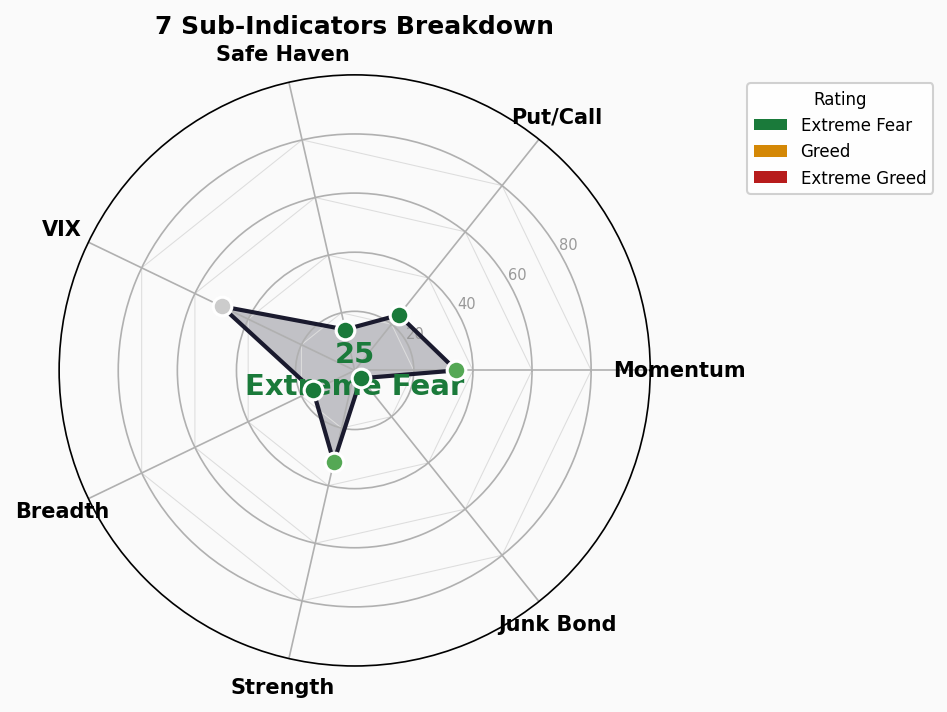
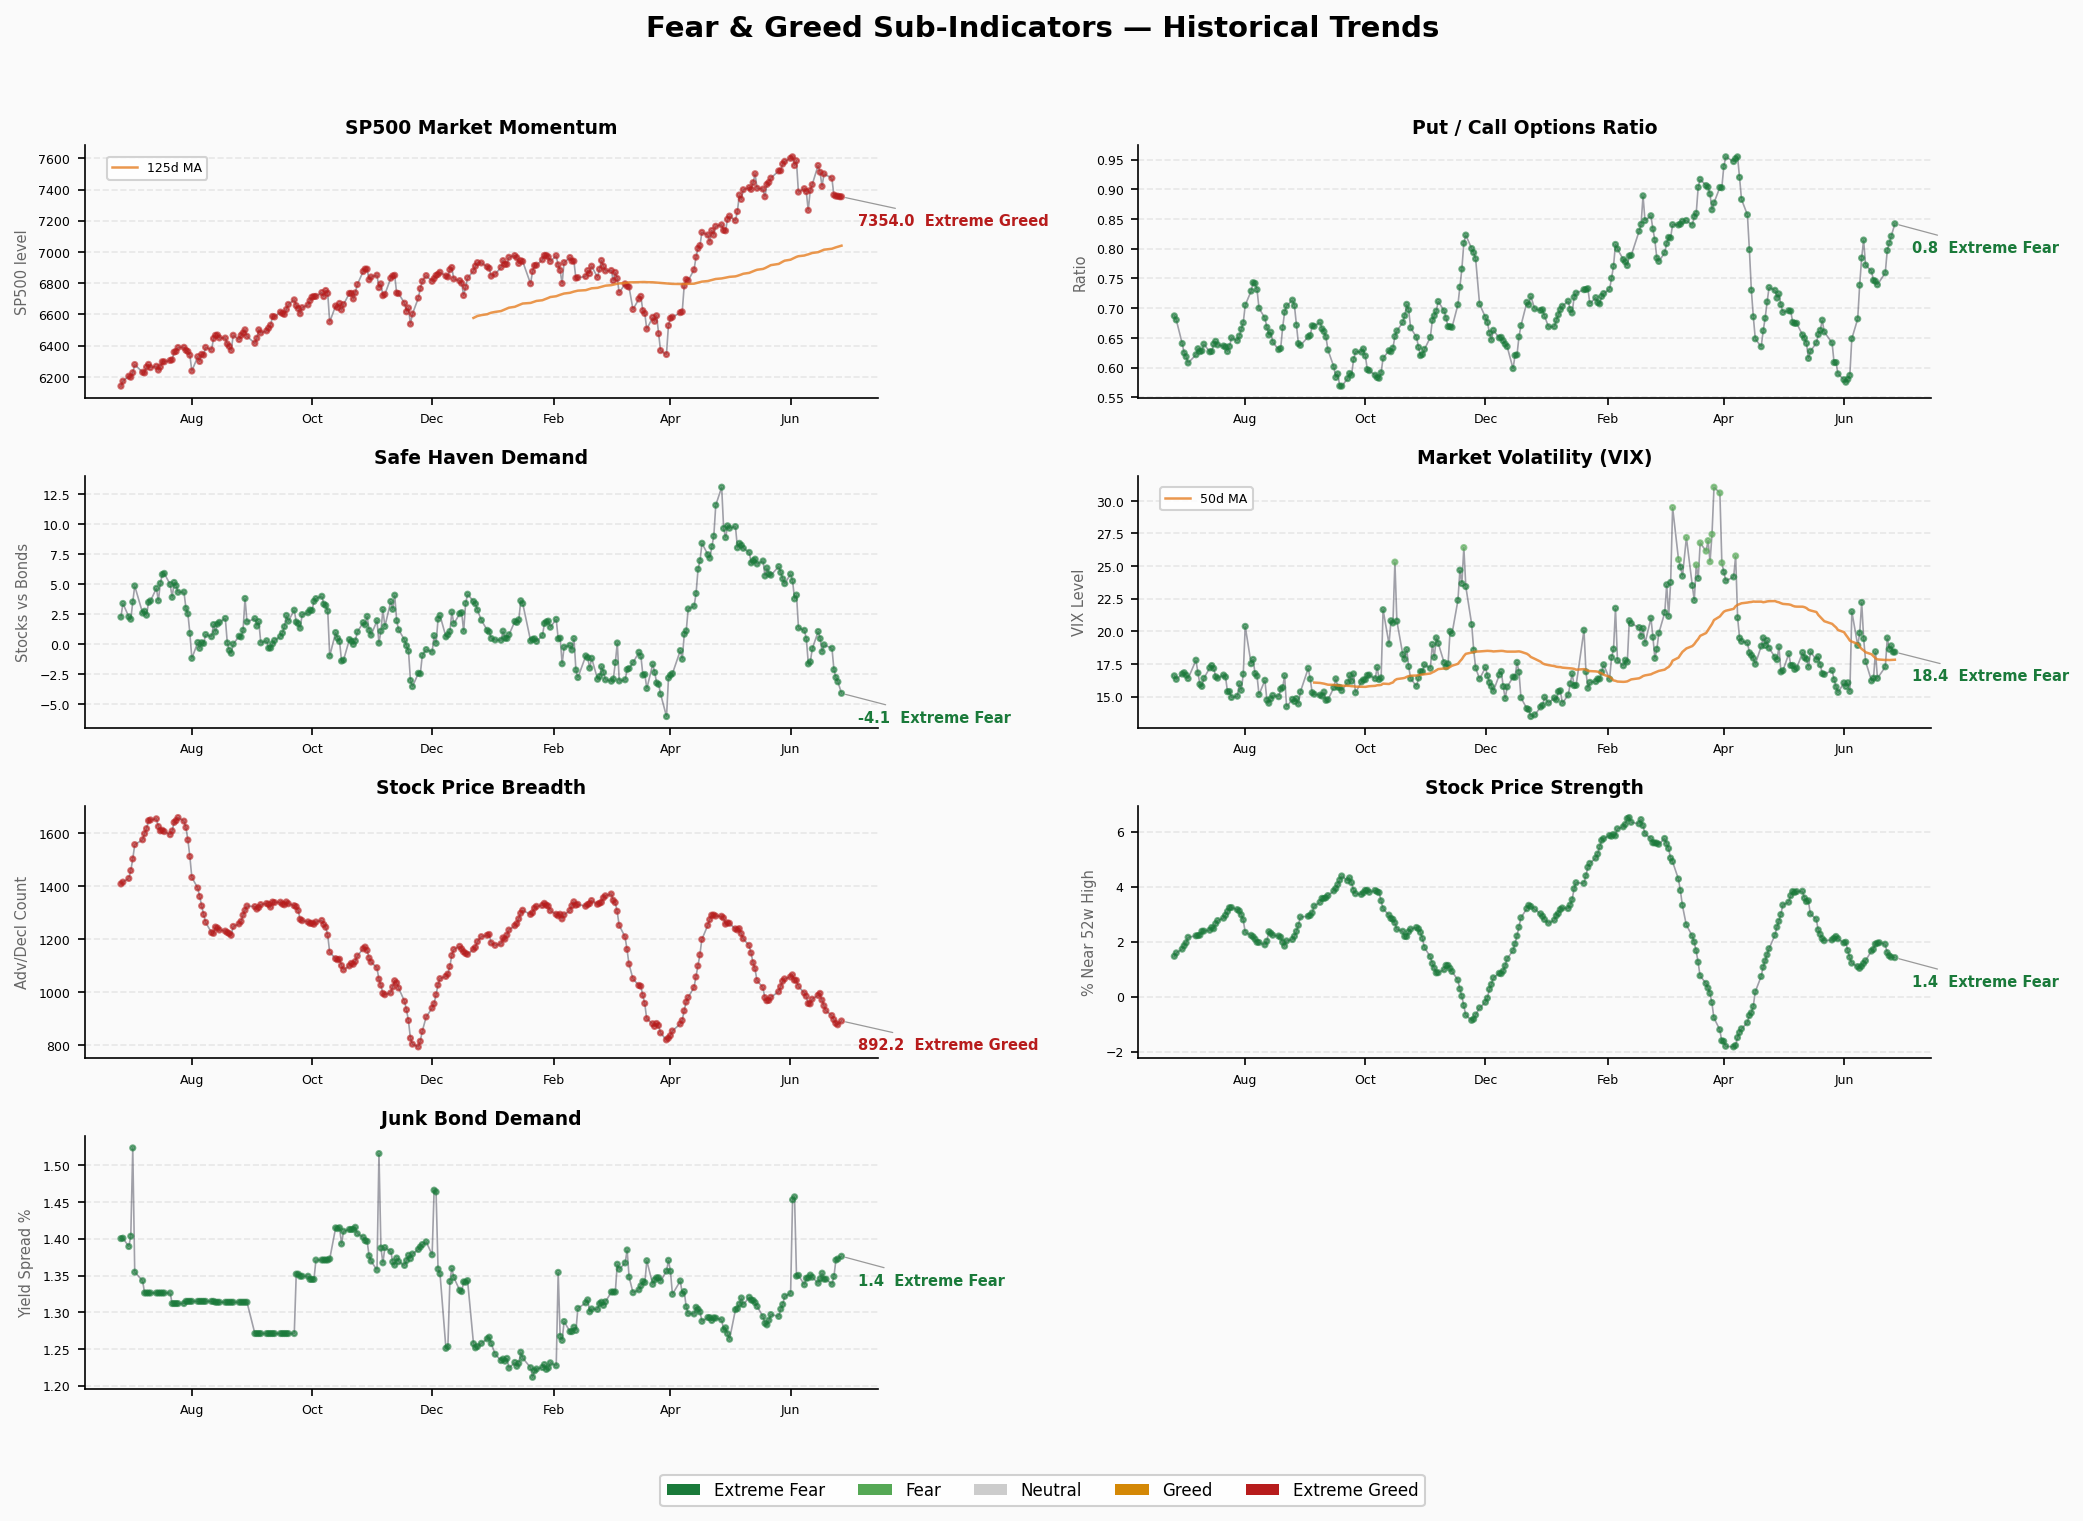
| 1 | Market Momentum (S&P vs 125d MA) | 34.4 | 🟡 Fear | 7,354 | → flat | Index above MA but momentum fading |
| 2 | Stock Price Strength (new highs/lows) | 31.8 | 🟡 Fear | 1.42 | ↓ slight | H/L ratio at 1.4, weak expansion |
| 3 | Stock Price Breadth (volume diff) | 15.6 | 🔴 Extreme Fear | 892 | ↑ slight | Breadth extremely narrow, few names holding index |
| 4 | Put/Call Ratio | 24.0 | 🔴 Extreme Fear | 0.842 | ↑ rising | Put demand surging vs calls, hedging frenzy |
| 5 | Market Volatility (VIX) | 50.0 | ⚪ Neutral | 18.41 | → flat | VIX neutral, panic not yet in vol surface |
| 6 | Junk Bond Demand (HY spread vs 10Y) | 3.4 | 🔴 Extreme Fear | 1.376 | ↑ slight | Capital fleeing risk, flocking to safety |
| 7 | Safe Haven Demand (bonds vs stocks) | 14.2 | 🔴 Extreme Fear | -4.07 | ↓ sharp | Bonds crushing stocks, extreme flight-to-quality |
3. Structural Contradictions
Extreme Value Scan:
- 🔴 Junk Bond Demand 3.4 — Near historical extremes (<5 = extreme fear), credit markets nearly frozen
- 🔴 Safe Haven Demand 14.2 — Bond-stock return spread at -4.07%, crowded safety trade
- 🔴 Breadth 15.6 — Market width dangerously narrow, only mega-caps propping index
Divergence Signals:
- ⚠️ VIX neutral vs sentiment extreme fear: Key contradiction. VIX at only 18.4 (neutral) while 6/7 indicators show fear. VIX may be lagging, or a volatility spike is brewing
- ⚠️ Momentum neutral vs breadth extreme fear: Index-level stability masking severe internal deterioration. Classic “index stability masking breadth collapse”
Risk Alert: When VIX and sentiment diverge this much, history shows VIX tends to “catch up.” The next leg down may come with a volatility spike.
4. Trend Assessment
| Dimension | Status |
|---|---|
| Range Duration | Extreme fear for 3 days (since 06-25) |
| Reversal Signals | None. No bottom divergence, no volume-driven bounce |
| Acceleration | Decline decelerating but not reversing |
| Historical Parallel | Similar to mid-2022 extended fear period, but that had clear fundamental trigger (rate hikes) |
Trend Conclusion: Fear consolidating at lows with stabilization signs but far from reversal. Watch for VIX breakout above 25 (capitulation peak = potential reversal), or continued fear with low VIX (grind lower).
🚨 Crisis Early Warning Dashboard
1. Credit Spreads
- HY OAS: 2.78% | 🟢 Normal
- IG OAS: 0.76% | 🟢 Normal
- Trend: Stable, no widening
- Assessment: Credit spreads safe, but CNN junk bond demand indicator already extreme — watch for spread widening as leading signal
2. Yield Curve
- 10Y-2Y Spread: +31bp | 🟢 Normal (positive)
- 10Y: 4.40% | 2Y: 4.09% | 30Y: 4.86%
- Trend: Normal but flat; 10Y-30Y inverted at -46bp
- Assessment: Positive 10Y-2Y means recession not priced in, but 10Y-30Y inversion suggests weak long-term growth confidence
3. Margin Debt
- Latest: $1.42T (May 2026, FINRA released 6/24)
- YoY Change: +53.7% (from ~$923B)
- MoM Change: +8.5% (2nd consecutive monthly increase)
- Status: 🔴 All-time high
- Assessment: Leverage at record highs with 53.7% YoY surge — textbook late-cycle indicator. Forced liquidation risk if market turns.
4. IPO Activity
- 2026 YTD: ~73 deals (Renaissance Capital)
- vs Prior Year: Up (~60 in same period 2025)
- Status: 🟡 Moderate-to-warm
- Assessment: IPO pace accelerating but below 2021 bubble levels. Watch for monthly 15+ deals as overheating signal.
5. Fund Flows
- 2026 YTD ETF Net Inflows: $600B+ (through early May, State Street)
- Annualized Pace: On track for $2T — all-time record
- Record?: Yes — fastest inflow pace ever
- Status: 🔴 Frenzied
- Assessment: Record ETF inflows amid extreme fear = structural paradox. Passive flows propping index while active money flees. Market regime has fundamentally changed.
Composite Assessment
| Signal | Status | Risk Level |
|---|---|---|
| Credit Spreads | HY OAS 2.78%, IG 0.76% | 🟢 Normal |
| Yield Curve | 10Y-2Y +31bp, normal | 🟢 Normal |
| Margin Debt | $1.42T ATH, +53.7% YoY | 🔴 High Risk |
| IPO Activity | ~73 deals, moderate-warm | 🟡 Medium |
| ETF Flows | $600B+ record pace | 🔴 High Risk |
Verdict: 2🟢 / 1🟡 / 2🔴 — Credit and rates are safe, but leverage and fund flows have reached dangerous heights. Market in “calm surface, turbulent depths” mode: VIX 18.4 masks severe internal divergence (breadth 15.6), extreme fear combined with record leverage and inflows. When the trigger comes, the correction may exceed expectations.
Sources: CNN Fear & Greed Index, FRED, FINRA, Renaissance Capital, State Street Generated: 2026-06-27 06:30 CST