CNN Fear & Greed Analysis 2026-06-26
Composite 25.5 Fear; breadth + junk bond demand trigger extreme fear; margin debt $1.42T all-time high
📈 Composite Index
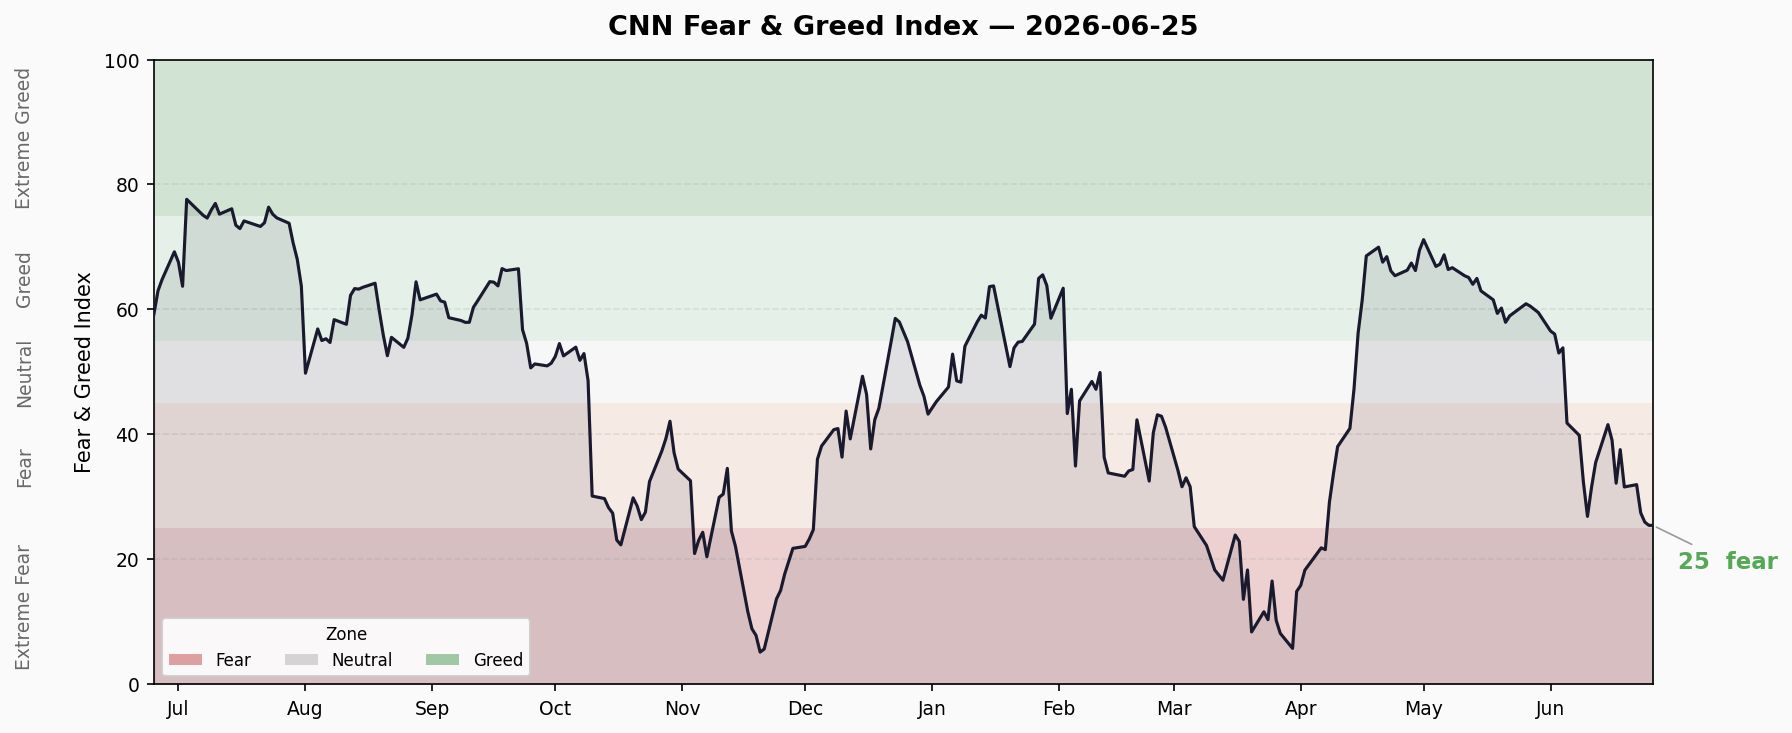
Latest Score: 25.5 / 100 — 😨 Fear
Previous: 25.5 → Current: 25.5 (flat)
Composite has declined for 4 consecutive sessions: 26.0 → 25.5 → 25.5, down 16.1 points from the June 15 high of 41.6. Currently at the upper boundary of Fear territory, just 0.5 points from Extreme Fear (<25).
10-Day Trend
| Date | Score | Zone |
|---|---|---|
| 06-12 | 35.5 | Fear |
| 06-15 | 41.6 | Fear |
| 06-16 | 39.1 | Fear |
| 06-17 | 32.2 | Fear |
| 06-18 | 37.6 | Fear |
| 06-19 | 31.6 | Fear |
| 06-22 | 32.0 | Fear |
| 06-23 | 27.5 | Fear |
| 06-24 | 26.0 | Fear |
| 06-25 | 25.5 | Fear |
Trend Direction: 📉 Persistent decline since 6/15 peak with no stabilization signal yet.
🔍 7 Sub-Indicators Scan
| # | Indicator | Score | Rating | Raw Value | Direction |
|---|---|---|---|---|---|
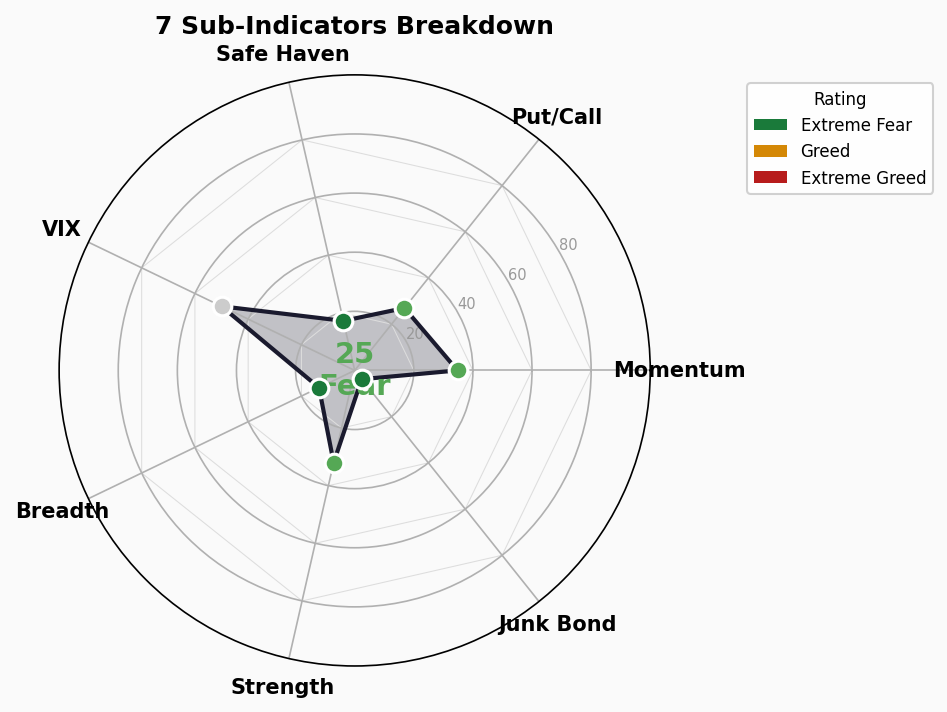
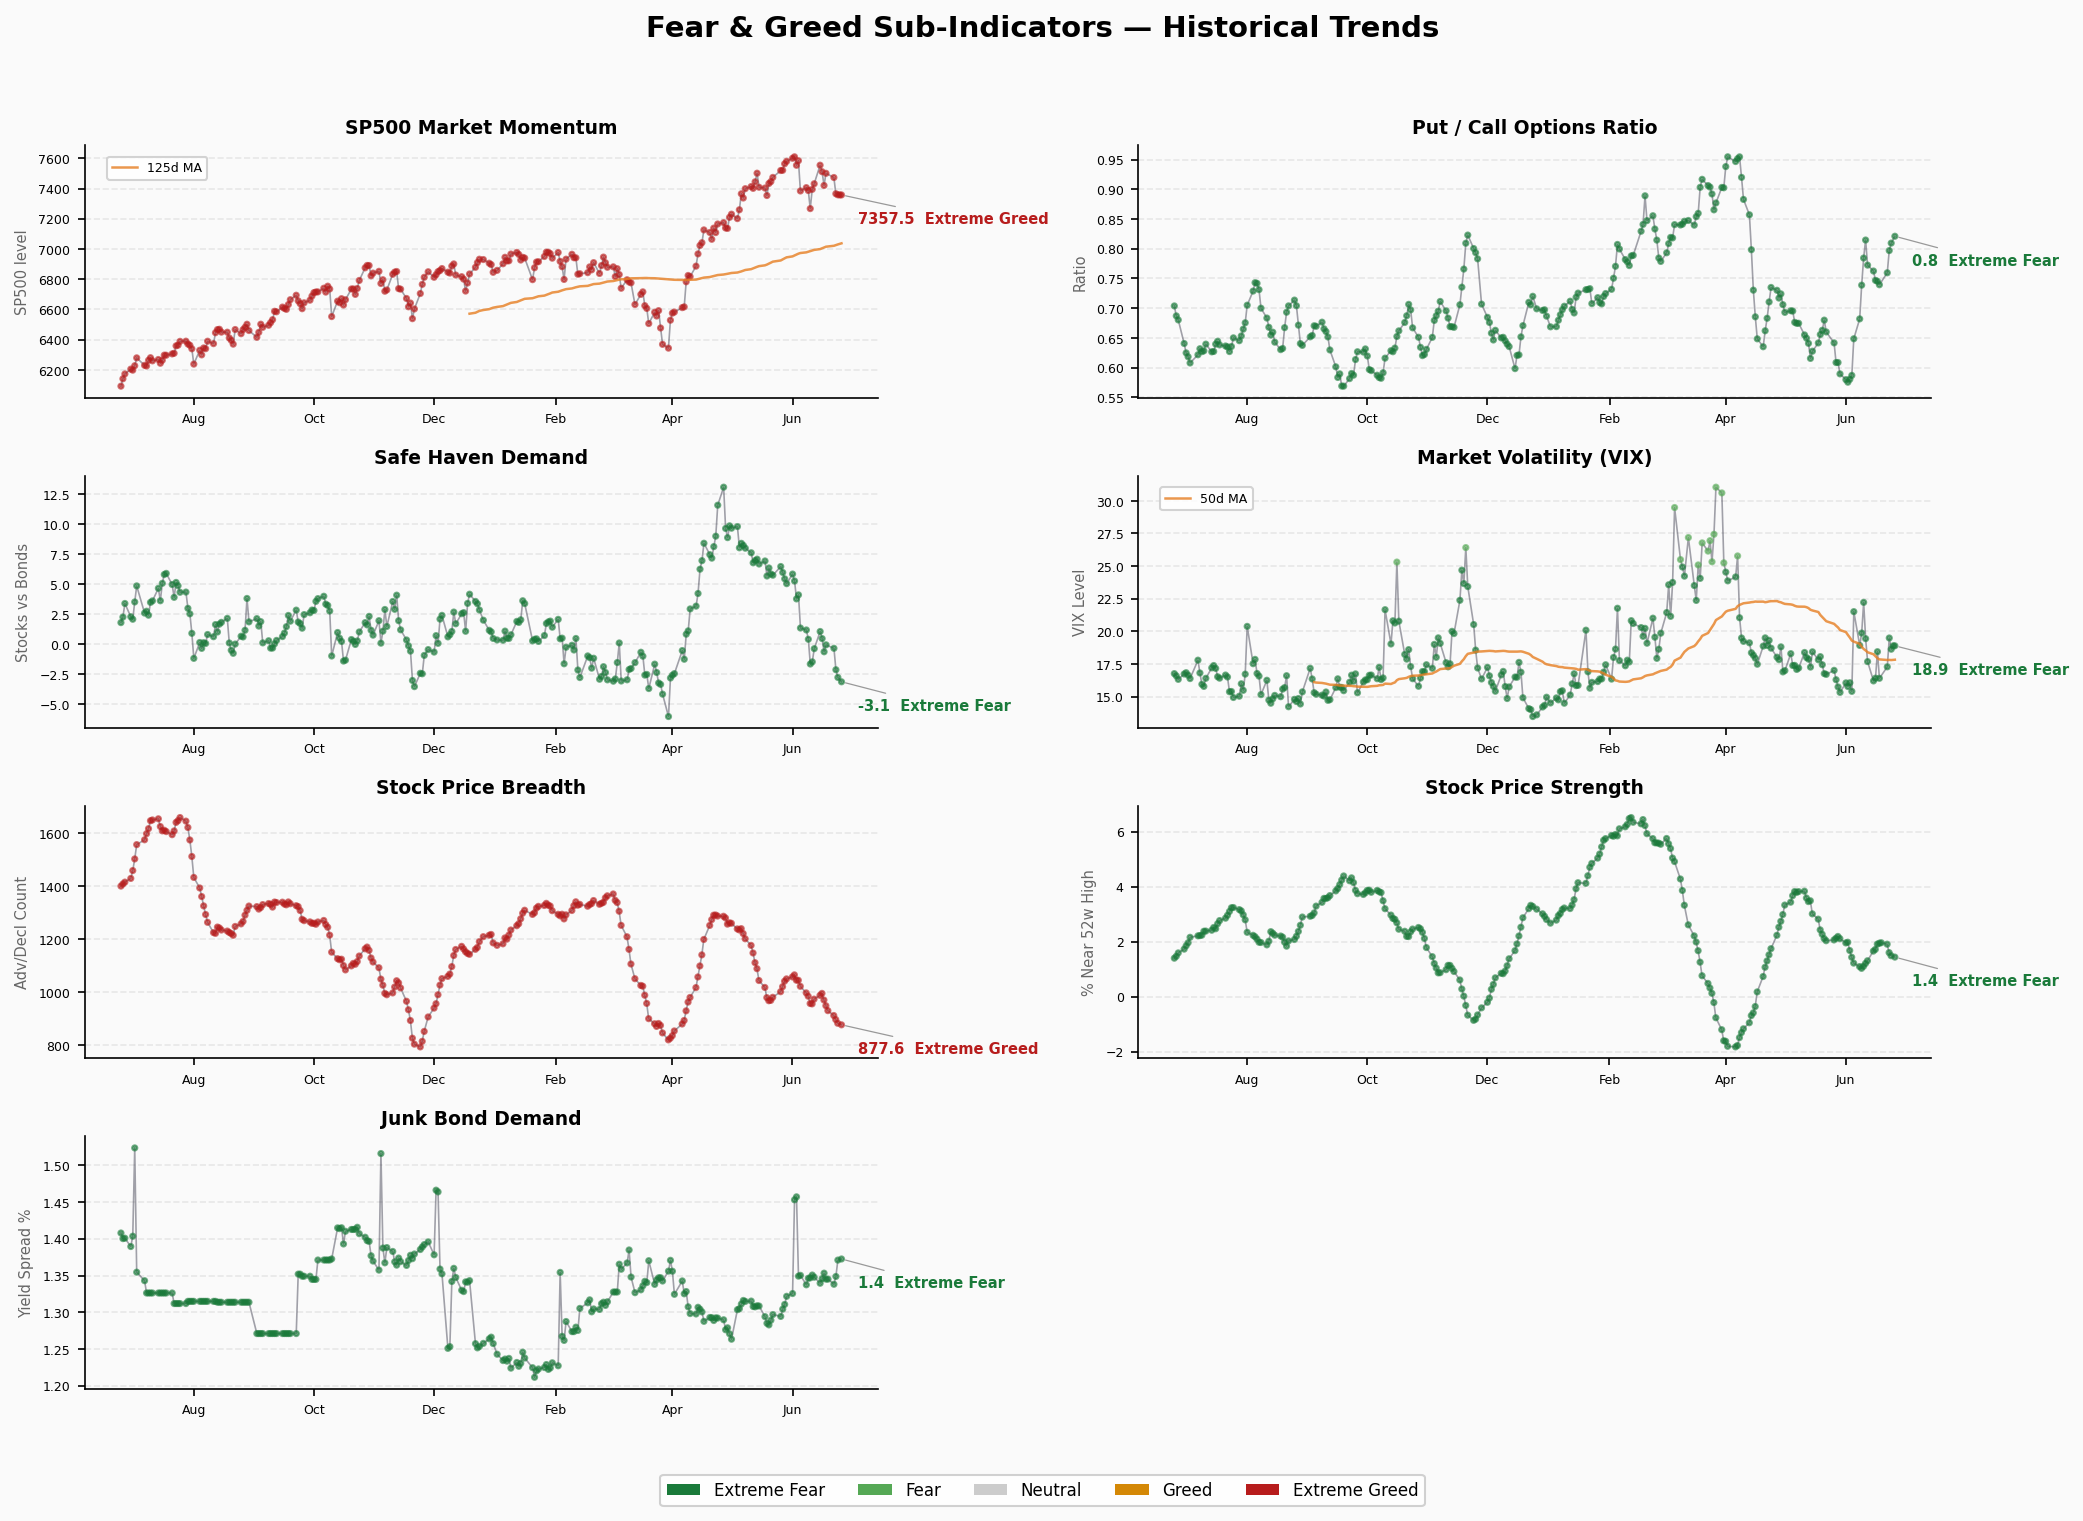
| 1 | Market Momentum (S&P 500 vs 125d MA) | 34.8 | 🟡 Fear | 7357.49 | ⬇️ from 7358.22 |
| 2 | Stock Price Strength (New Highs - Lows) | 32.0 | 🟡 Fear | +1.44 | ⬇️ from +1.49 |
| 3 | Stock Price Breadth (Advancing/Declining Volume) | 13.4 | 🔴 Extreme Fear | 877.62 | ⬇️ from 883.38 |
| 4 | Put/Call Options Ratio | 27.0 | 🟡 Fear | 0.8211 | ⬆️ from 0.8096 |
| 5 | Market Volatility (VIX) | 50.0 | ⚪ Neutral | 18.89 | ➡️ Flat |
| 6 | Safe Haven Demand (Bonds vs Stocks) | 17.2 | 🔴 Extreme Fear | -3.11 | ⬇️ from -2.75 |
| 7 | Junk Bond Demand (Credit Spread) | 3.8 | 🔴 Extreme Fear | 1.37% | ⬇️ from 1.37% |
Item-by-Item Analysis
- Market Momentum (34.8): S&P 500 at 7357 remains above the 125-day MA (~7034), but the gap is narrowing. Momentum score in Fear territory signals weakening price action.
- Stock Price Strength (32.0): Net new highs minus new lows is just +1.44, deep in Fear territory. No clear market leaders; severe stock-level divergence.
- Stock Price Breadth (13.4) 🔴: The most alarming indicator. Declining volume dominance persists at 877.62 — well below historical norms. Poor breadth means rallies lack broad participation; a few mega-caps are propping up the index.
- Put/Call Options (27.0): Put/Call ratio rose to 0.82, reflecting increased hedging demand. Not yet at panic levels (>1.0), but trending upward.
- Market Volatility (50.0): VIX at 18.89 sits squarely in the neutral zone. The only non-Fear indicator in the basket — a notable anomaly.
- Safe Haven Demand (17.2) 🔴: Bond demand relative to equities continues rising. The -3.11 reading shows capital fleeing risk assets.
- Junk Bond Demand (3.8) 🔴: The most extreme signal in the entire index. A score of 3.8 means credit markets are essentially frozen in fear — investor appetite for high-yield debt has collapsed.
⚠️ Structural Divergence Analysis
Extreme Value Signals
- Junk Bond Demand at 3.8 (Extreme Fear): Credit market panic far exceeds equity market stress — typically a leading indicator
- Stock Price Breadth at 13.4 (Extreme Fear): Market participation is abnormally low; rallies are narrow
- Safe Haven Demand at 17.2 (Extreme Fear): Capital accelerating out of risk assets
Divergence Signals
- VIX Neutral (50) vs Credit Markets Extreme Fear (3.8): A stark contradiction. VIX measures 30-day implied volatility; credit spreads reflect longer-term risk perception. When they diverge this sharply, credit markets are usually right — they price in deeper, more structural risks.
- Market Momentum in Fear (34.8) vs S&P 500 Absolute Level Still High: The index hasn’t dropped dramatically in absolute terms, but momentum indicators are in Fear territory — suggesting a “grind down” rather than a panic selloff.
Composite Divergence Assessment
The core contradiction: calm surface, anxious undercurrents. VIX is low, index drawdowns are modest, but credit and breadth indicators are flashing severe warnings. Historically, this combination appears near market tops — prices haven’t crashed yet, but smart money is already retreating.
🚨 Crisis Early Warning Dashboard
1. Credit Spreads
- High Yield OAS: 2.76% | 🟢 Normal
- Investment Grade OAS: 0.75%
- Trend: Stable but creeping upward, approaching 3% warning level
- Analysis: Absolute levels are still normal, but FNG junk bond sub-indicator at 3.8 shows market perception of credit risk has deteriorated severely. The gap between sentiment (extreme fear) and pricing (normal) reflects a timing lag — CNN measures fear, FRED measures current spreads.
2. Yield Curve
- 10Y-2Y Spread: +31bp | 🟢 Normal (un-inverted)
- 10Y: 4.41% | 2Y: 4.11% | 30Y: 4.86%
- Trend: Curve normalizing; 10Y-2Y maintaining positive spread
- Analysis: The yield curve has recovered from inversion — a positive signal against recession risk. However, the 10Y-30Y spread at -45bp (long-end inversion) indicates the market still harbors pessimistic long-term growth expectations.
3. Margin Debt
- Latest Value: $1.416T (May 2026)
- YoY Change: +53.7%
- Status: 🔴 All-Time High
- Analysis: Margin debt rose for the second consecutive month, jumping 8.5% in May to $1.42T — a new all-time record. The +53.7% YoY surge is extraordinary — even the 2021 bubble peak didn’t see this pace. High leverage means forced liquidations will amplify any selloff.
4. IPO Activity
- 2026 YTD: ~73 IPOs (Renaissance Capital)
- Q2 Performance: 48 IPOs raised $104.9B — a record
- Status: 🔴 Overheated
- Analysis: Both IPO count and proceeds hit records in Q2. The IPO window is wide open — a classic late-cycle indicator where companies rush to list before conditions deteriorate.
5. Fund Flows
- 2026 YTD ETF Net Inflows: $830B (through May)
- Record?: Yes
- Status: 🔴 Euphoric
- Analysis: ETF inflows continue at record pace; active ETFs alone saw $70B in May (also a record). Money keeps pouring in, but FNG shows sentiment has turned Fear — suggesting new money may be providing exit liquidity for smart money.
Composite Assessment
| Signal | Status | Risk Level |
|---|---|---|
| Credit Spreads | 2.76%, Normal | 🟢 Low |
| Yield Curve | +31bp, Normal | 🟢 Low |
| Margin Debt | $1.42T, All-Time High | 🔴 High |
| IPO Market | 73 / $104.9B, Record | 🔴 High |
| Fund Flows | $830B, Record | 🔴 High |
Final Verdict: 2🟢 / 0🟡 / 3🔴 — Credit and rate conditions remain benign, but margin debt, IPO activity, and fund flows are all at extreme/record levels simultaneously. Historically, when all three (margin ATH + IPO records + ETF flow records) co-occur, the market is typically within 2-3 months of a significant top. Risk level is elevated — monitor whether HY OAS breaches the 3% threshold, which would be the true danger signal.