CNN Fear & Greed Analysis 2026-06-25
Composite index 25.9 fear zone; breadth+junk bonds+safe haven at extreme fear; credit spreads normal but margin+ETF inflows at record highs
CNN Fear & Greed Analysis — 2026-06-25
Composite Index
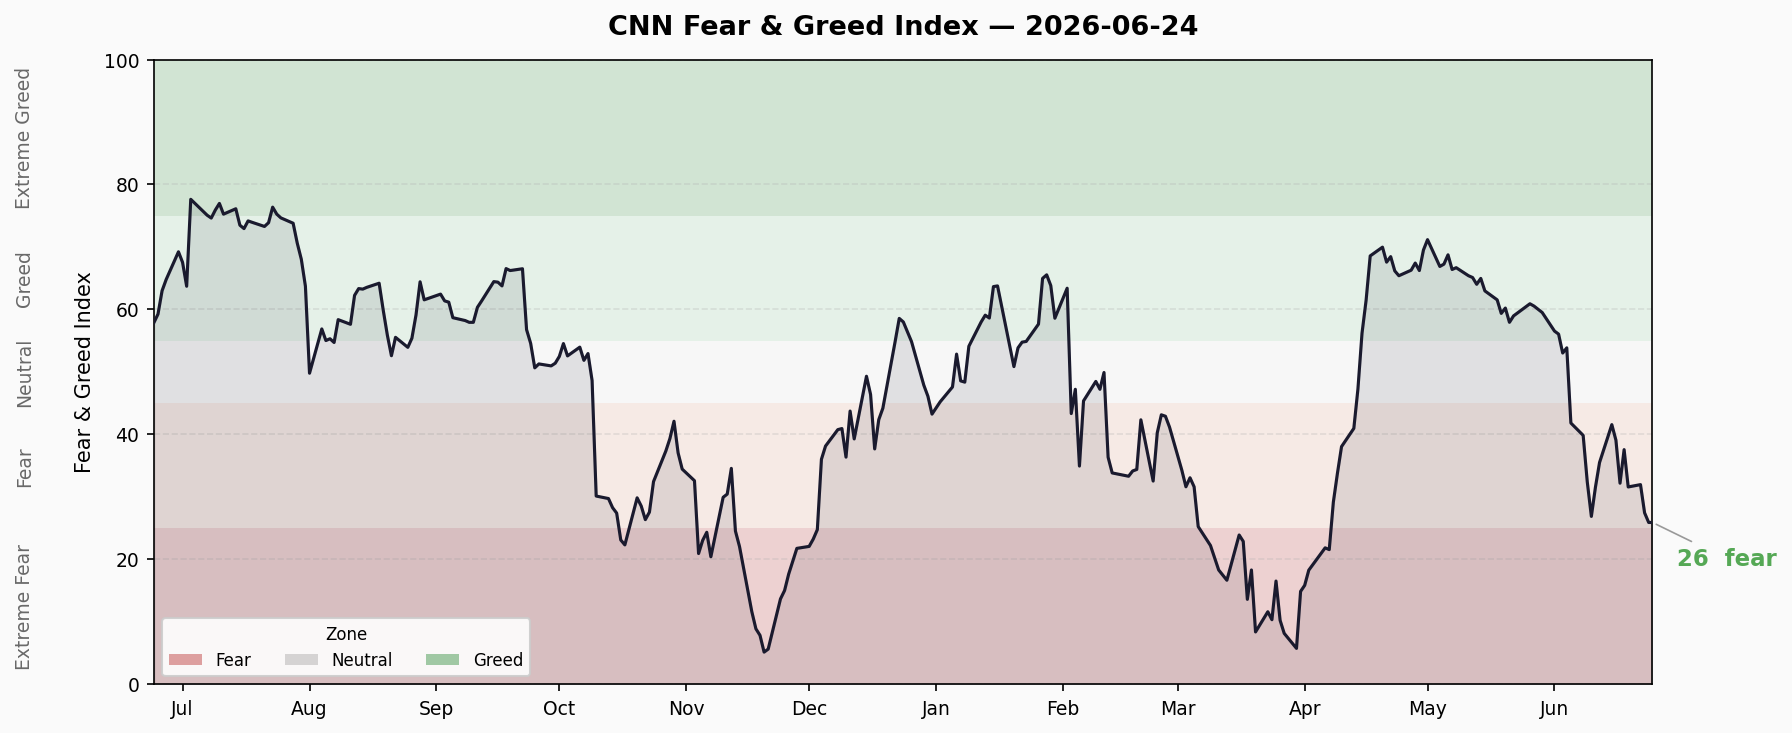
Current: 25.9 / 100 — Fear
| Metric | Value |
|---|---|
| Today | 25.9 |
| Yesterday | 27.5 |
| 1 Week Ago | 32.2 |
| 1 Month Ago | 59.0 |
| 1 Year Ago | 57.9 |
- Down -1.6 vs yesterday, continuing decline
- Down -6.3 vs one week ago, accelerating
- Down -33.1 vs one month ago, crashed from greed to fear
- Current fear streak: 5 consecutive trading days (6/19-6/25), 5.9 points from extreme fear (<20)
7 Sub-Indicators Scan
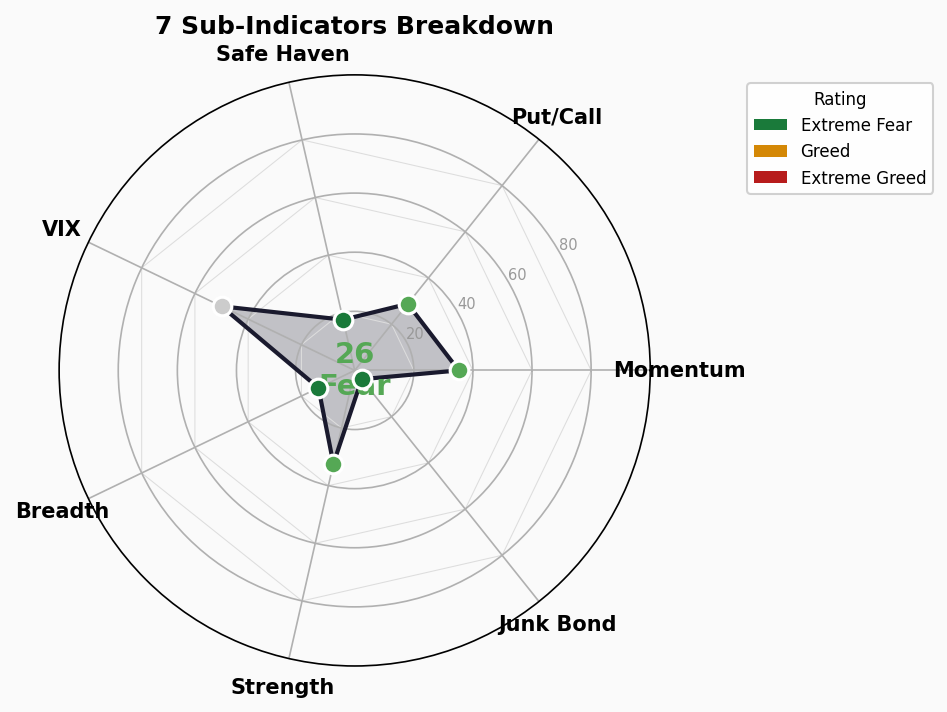
| # | Indicator | Score | Rating | Note |
|---|---|---|---|---|
| 1 | Market Breadth | 13.6 | 🔴 Extreme Fear | Below 20 threshold, decliners overwhelming advancers |
| 2 | Junk Bond Demand | 3.8 | 🔴 Extreme Fear | Near ice point, credit market panic selling |
| 3 | Safe Haven Demand | 17.6 | 🔴 Extreme Fear | Flight to safety into Treasuries/gold |
| 4 | Market Momentum | 35.2 | 🟡 Fear | S&P 500 well below 125-day MA |
| 5 | Put/Call Options | 28.8 | 🟡 Fear | Elevated put ratio, hedging demand rising |
| 6 | VIX Volatility | 50.0 | ⚪ Neutral | Volatility in neutral zone |
| 7 | Composite | 25.9 | 🟡 Fear | Weighted average of all 7 indicators |
Distribution:
- 🔴 Extreme Fear (<20): 3 — Breadth, Junk Bonds, Safe Haven
- 🟡 Fear (20-40): 3 — Momentum, Put/Call, Composite
- ⚪ Neutral: 1 — VIX
- 🟢 Greed/Extreme Greed: 0
Structural Divergence Analysis
Extreme Value Signals (>80 or <20):
| Indicator | Score | Status | Historical Implication |
|---|---|---|---|
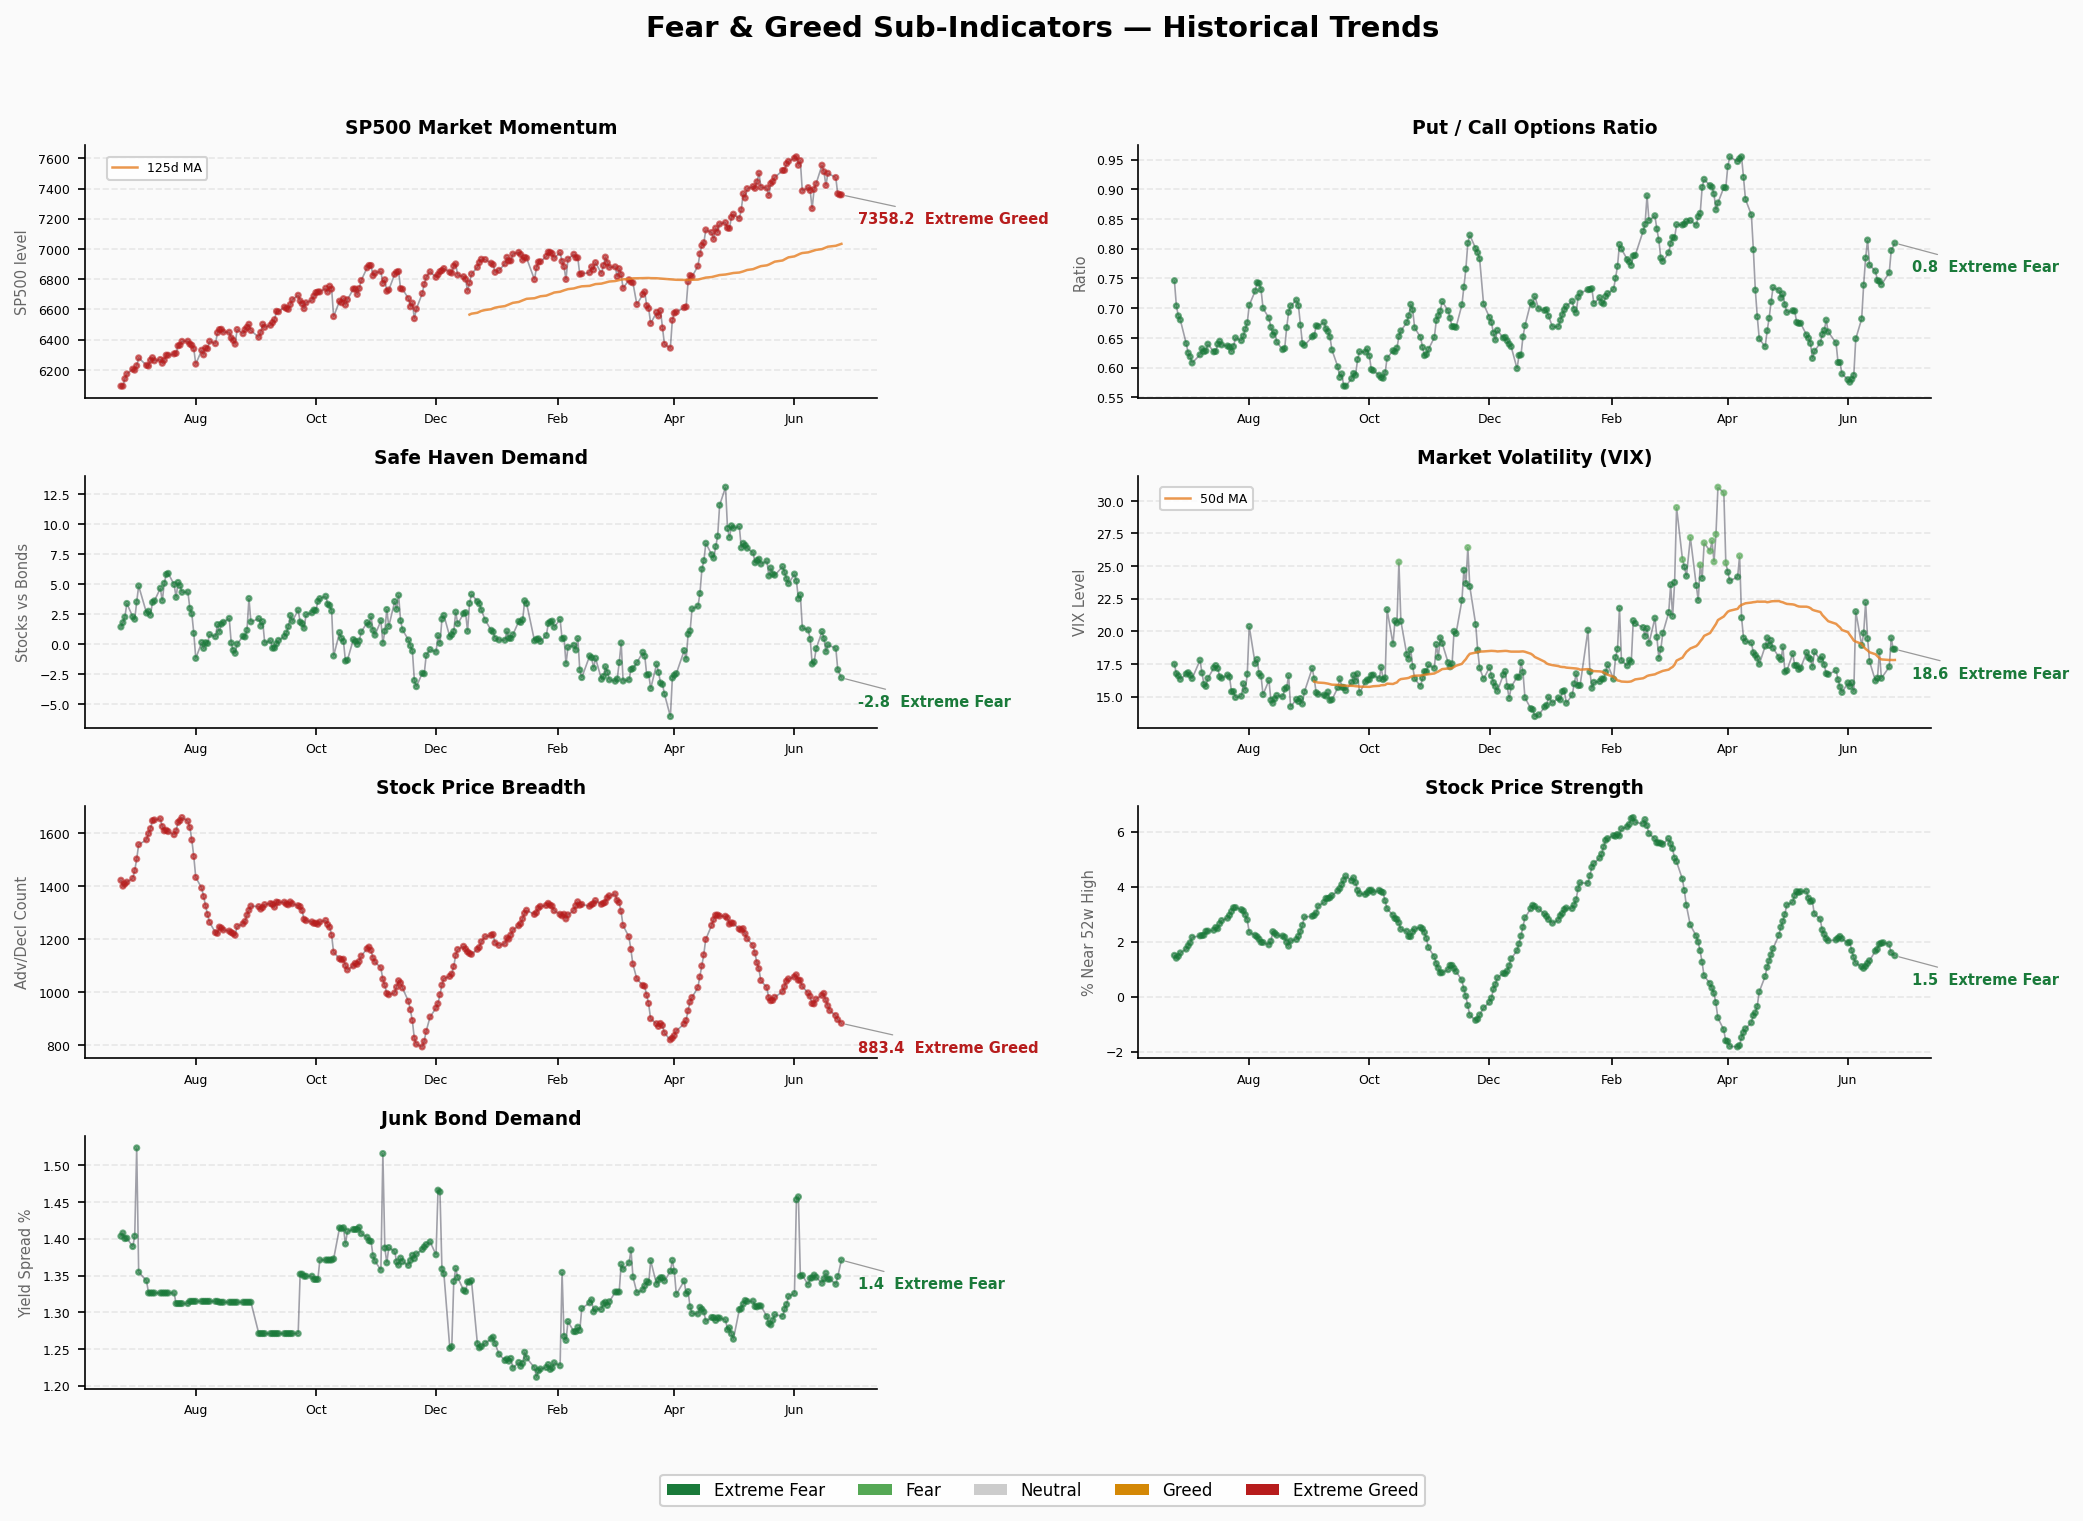
| Breadth | 13.6 | Extreme Fear | Typically near market bottoms (2018/12, 2020/3) |
| Junk Bond Demand | 3.8 | Extreme Fear | Credit market panic, leading indicator (hit <5 in 2020/3) |
| Safe Haven Demand | 17.6 | Extreme Fear | Max fear → contrarian signal (hit <10 in 2020/3) |
Divergence Signals:
- VIX vs Credit Spreads: VIX neutral (50) but HY OAS only 2.71% (normal) → Credit markets haven’t truly deteriorated, panic may be overdone
- Breadth vs Momentum: Breadth extreme fear (13.6) but momentum still fear (35.2) → Few large-caps masking broad individual stock decline
- Safe Haven vs Junk Bonds: Both extreme fear → Consistent risk-off, but credit spreads not yet confirming
Key Assessment: Three extreme fear indicators (breadth, junk bonds, safe haven) contrast sharply with one neutral indicator (VIX). This typically means the market is in a fear-spreading phase but hasn’t yet triggered systemic risk events (like a VIX spike).
Trend Analysis
Last 10 Trading Days:
| Date | Score | Rating |
|---|---|---|
| 6/12 | 35.5 | Fear |
| 6/15 | 41.6 | Fear |
| 6/16 | 39.1 | Fear |
| 6/17 | 32.2 | Fear |
| 6/18 | 37.6 | Fear |
| 6/19 | 31.6 | Fear |
| 6/22 | 32.0 | Fear |
| 6/23 | 27.5 | Fear |
| 6/24 | 25.9 | Fear |
| 6/25 | 25.9 | Fear |
Trend Assessment:
- Fear zone for 10 consecutive trading days (6/12 to present), declining from 35.5 to 25.9
- Decline accelerating: 5-day average 30.0 vs prior 5-day average 37.1
- 5.9 points from extreme fear threshold (20), likely to touch within 2-3 days at current pace
- Historical reference: FNG hit 2.5 (extreme fear bottom) in March 2020, then rapidly reversed
🚨 Crisis Early Warning Dashboard
1. Credit Spreads
- High Yield OAS: 2.71% | 🟢 Normal
- Investment Grade OAS: 0.74%
- Trend: Stable vs prior day
- Assessment: HY OAS below 3% warning line, credit markets haven’t deteriorated yet. But junk bond demand indicator (3.8) is already at extreme fear — investors actively reducing high-yield exposure. Spread widening likely imminent.
2. Yield Curve
- 10Y-2Y Spread: +30bp | 🟢 Normal, slightly flat
- 10Y: 4.50% | 2Y: 4.16% | 30Y: 4.94%
- Trend: Curve steepening slightly (30Y-10Y +44bp)
- Assessment: Yield curve normal, no inversion signal. 30Y-10Y spread +44bp indicates elevated long-end yields, inflation expectations still present.
3. Margin Debt
- Latest: $1.42T (May 2026, all-time high)
- YoY Change: +53.7%
- Status: 🔴 All-time high
- Assessment: Margin debt at record highs for second consecutive month, +8.5% MoM in May, +53.7% YoY. Leverage at historical extremes — market correction will trigger massive forced liquidations (2020/3 lesson).
4. IPO Count
- 2026 YTD: ~179
- vs Prior Year: Increasing (2020 full-year 480 was record pace)
- Status: 🟡 Warm to hot
- Assessment: IPO count at normal-to-elevated levels, not yet at 2020/2021 frenzy. But NYSE data shows 10 IPOs in last 30 days, pace accelerating.
5. Fund Flows
- 2026 YTD ETF Net Inflows: $830B (through May)
- Record: Yes ($70B active ETF inflows in May — single-month record)
- Status: 🔴 Euphoric
- Assessment: ETF inflows on record pace, $830B in just 5 months — annualized could exceed $2T. However, iShares notes March Q1-end flows slowed amid Middle East tensions, and much of inflow went to SGOV (short-term Treasury ETFs — defensive). Flow composition is diverging.
Summary Assessment
| Signal | Status | Risk Level |
|---|---|---|
| Credit Spreads | HY OAS 2.71% normal | 🟢 Low |
| Yield Curve | 10Y-2Y +30bp normal | 🟢 Low |
| Margin Debt | $1.42T all-time high +53.7% YoY | 🔴 High |
| IPO Count | ~179 warm-to-hot | 🟡 Medium |
| ETF Inflows | $830B record | 🔴 High |
Overall: 2🟢 / 1🟡 / 2🔴 — Structured risk. Credit spreads and yield curve temporarily safe, but margin leverage and fund inflows at historical extremes. Market in a “fear sentiment + leverage greed” paradox.Once triggered (geopolitical escalation, weak economic data), elevated leverage will amplify the decline. Current FNG fear zone (25.9) offers short-term bounce potential, but medium-term risks continue accumulating.