CNN Fear & Greed Analysis 2026-06-24
Composite 27.5 (Fear), Breadth extreme fear 14.8, Junk bond demand extreme fear 7; Margin debt record high $1.42T
CNN Fear & Greed Analysis — 2026-06-24
Source: CNN Business Fear & Greed Index API, FRED, FINRA. Updated daily.
Composite Index
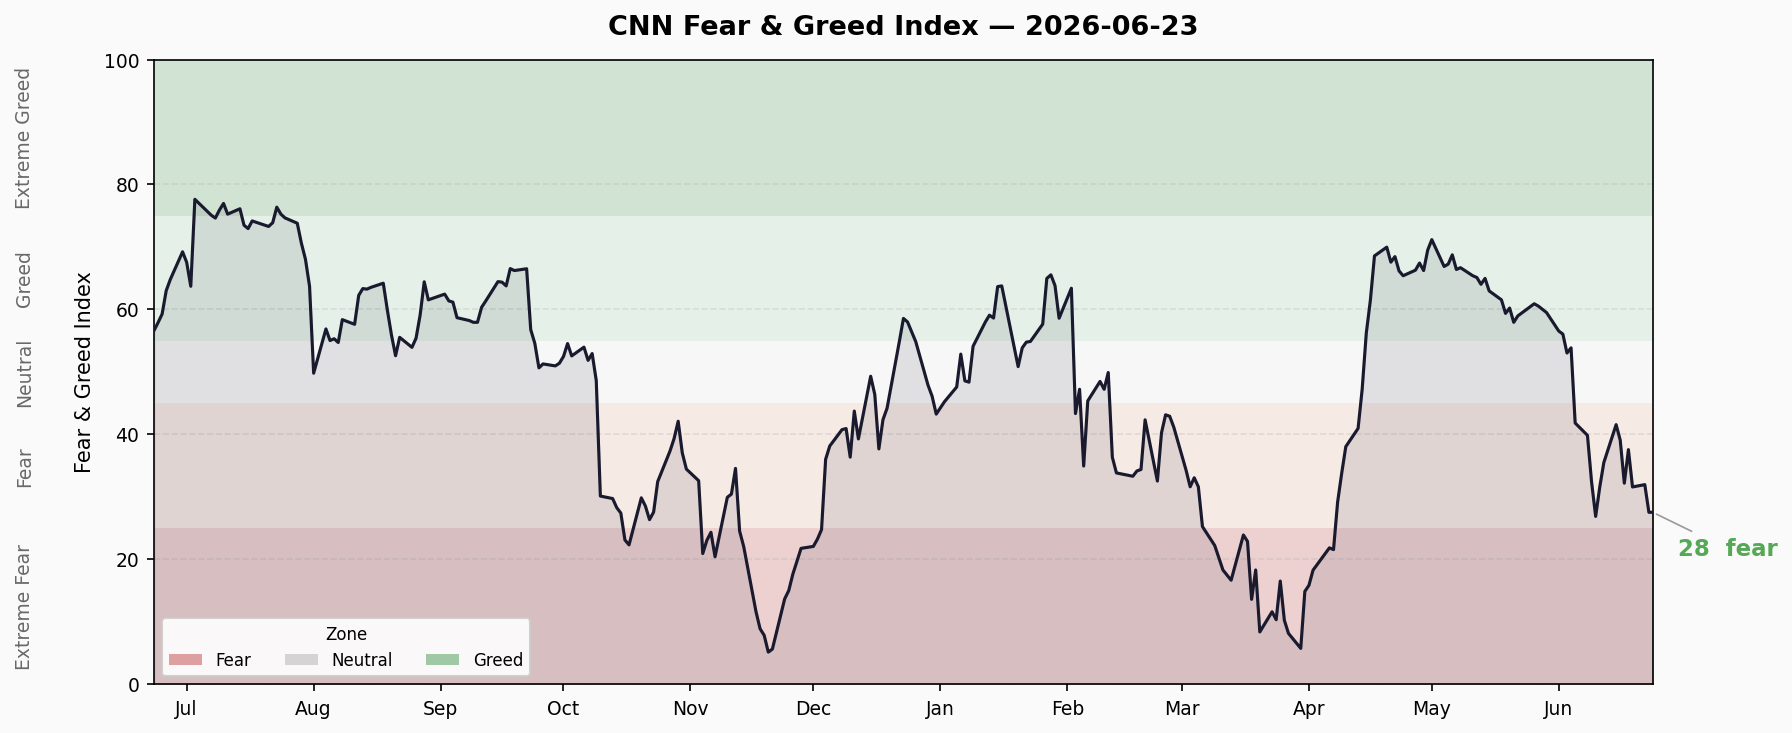
Current Score: 27.5 / 100 — Fear
- vs Previous Day: Flat (27.5 → 27.5)
- One week ago: 32.0 (Fear)
- Two weeks ago: 39.9 (Fear)
- Duration in zone: 13 trading days since entering Fear zone on Jun 5
- Trend: Declining channel, from 53.9 (Neutral) on Jun 4 to 27.5, approaching Extreme Fear territory
7 Sub-Indicators
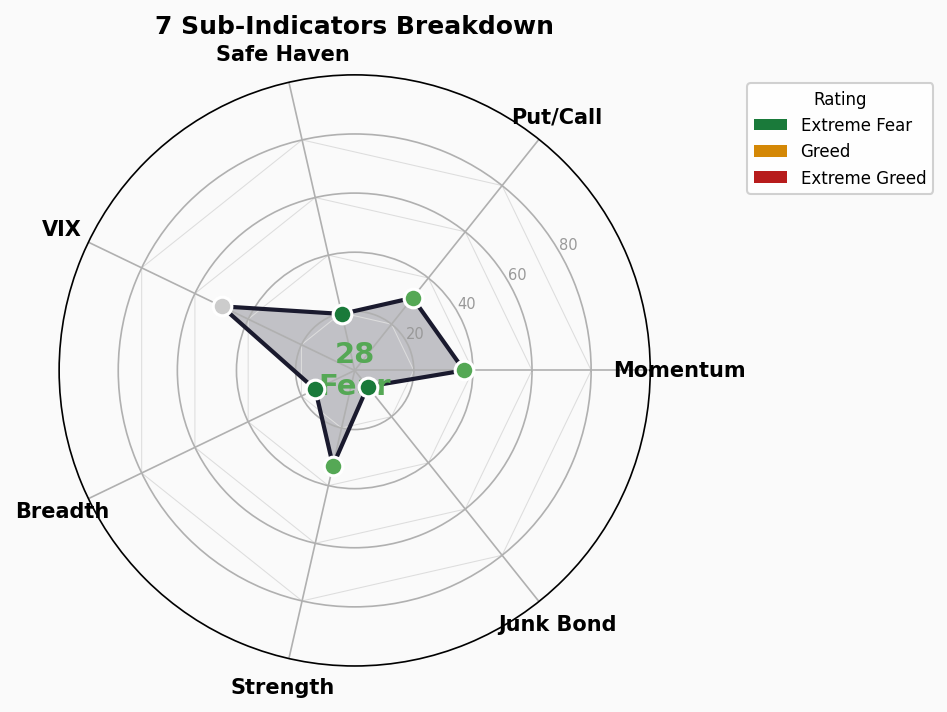
| Indicator | Score | Rating | Raw Value | Change | Signal |
|---|---|---|---|---|---|
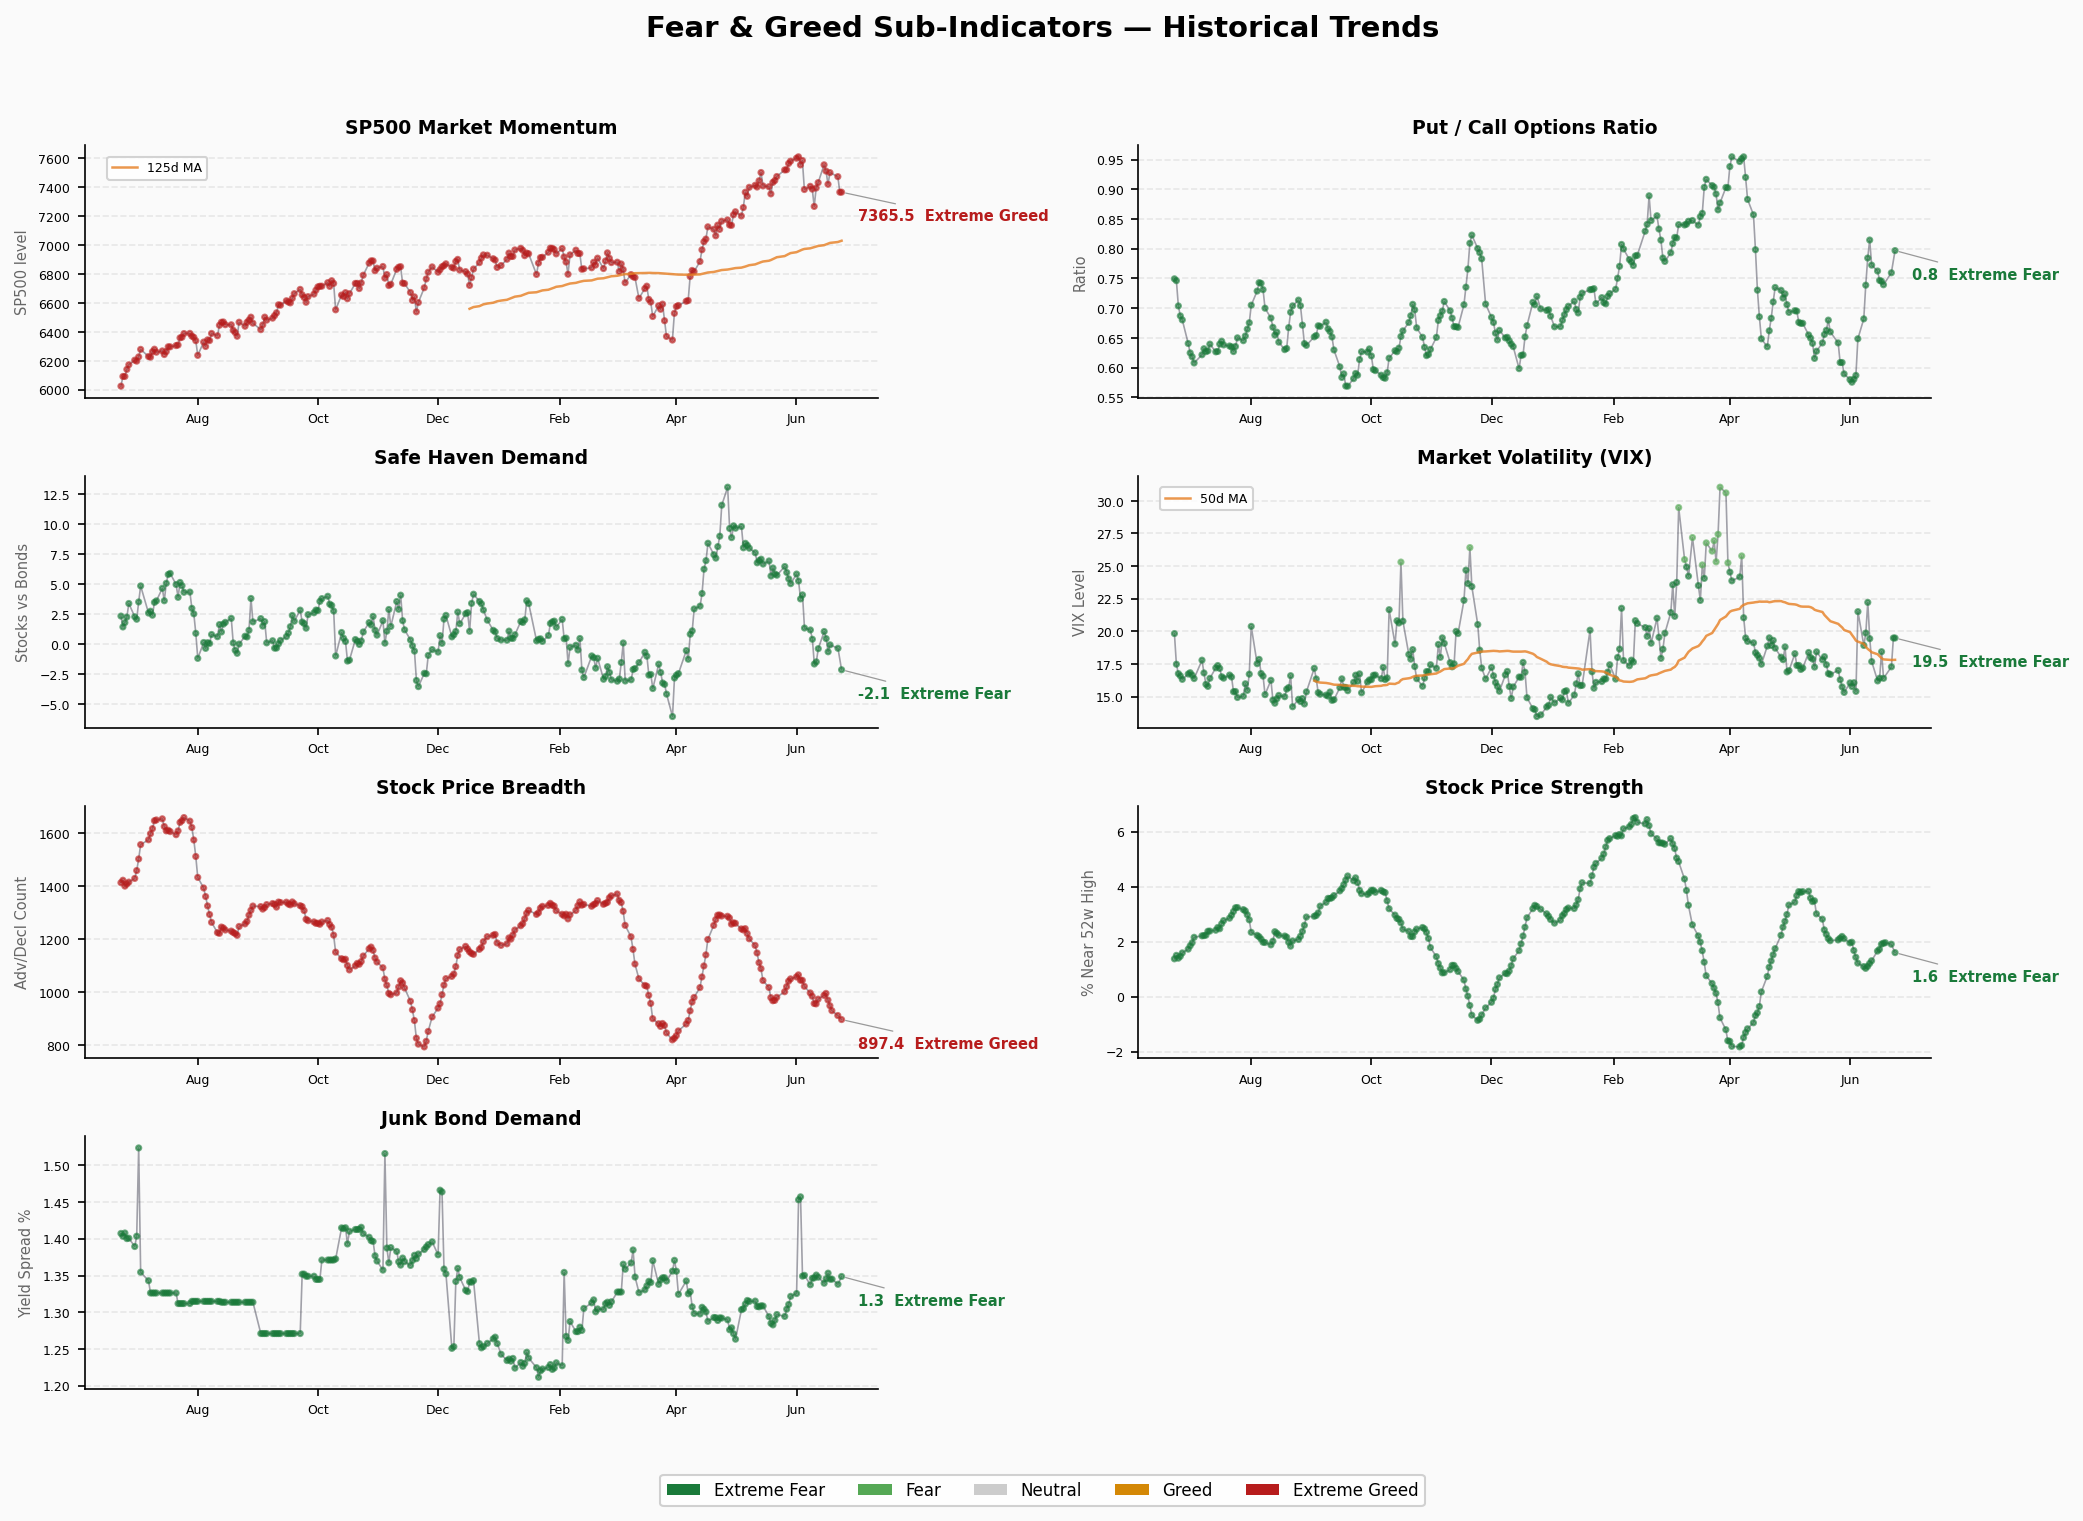
| Market Momentum (SPX) | 37 | 🟡 Fear | SPX 7,365 | Flat | SPX below 125-day MA |
| Market Momentum (SP125) | 37 | 🟡 Fear | 7,026 | Flat | Hovering near 125-day MA |
| Stock Price Strength | 33 | 🟡 Fear | 1.60 | ↓ | New highs/lows ratio declining |
| Stock Price Breadth | 14.8 | 🔴 Extreme Fear | 897 (AD line) | ↓-15.2 | Breadth deteriorating further |
| Put/Call Ratio | 31.4 | 🟡 Fear | 0.80 | ↑+0.04 | Put option ratio rising |
| VIX Volatility | 50 | ⚪ Neutral | 19.49 | Flat | VIX at moderate level |
| Junk Bond Demand | 7 | 🔴 Extreme Fear | 1.35 | ↑+0.01 | High-yield demand very weak |
| Safe Haven Demand | 19.6 | 🔴 Extreme Fear | -2.11 | ↓-1.79 | Flight to Treasuries/gold |
Structural Divergence Analysis
Extreme Readings (>80 or <20):
- 🔴 Breadth 14.8: Extreme Fear — advancing stocks far outnumbered by decliners; index masked by few large-caps
- 🔴 Junk Bond Demand 7: Extreme Fear — high-yield spreads widening, market极度 risk-averse
- 🔴 Safe Haven 19.6: Extreme Fear — frantic flight to Treasuries and gold
Divergence Signals:
- ⚠️ VIX Neutral (50) vs Breadth Extreme Fear (14.8) — volatility and breadth severely decoupled, meaning the market hasn’t truly priced tail risk yet
- ⚠️ Momentum Fear (37) vs Safe Haven Extreme Fear (19.6) — prices declining slowly, but capital already in panic mode seeking safety
Read: Classic “boiling frog” pattern — index declines are modest (VIX not elevated), but internal structure severely deteriorating (terrible breadth, credit market panic, flight from risk). When VIX finally catches up, acceleration likely.
Trend Assessment
- Zone Duration: Fear zone (20-40) for 13 trading days, nearing Extreme Fear (<20)
- Turning Point: Composite dropped from 53.9 to 27.5 with no sign of stabilization
- Momentum Direction: 5/7 sub-indicators in Fear or Extreme Fear; 2 Neutral (VIX + Momentum)
- Historical Parallel: Current pattern resembles pre-August 2024 “yen carry trade unwind” — credit markets deteriorating first, volatility lagging
🚨 Crisis Signal Dashboard
1. Credit Spreads
- HY OAS: 2.65% (2026-06-22) | 🟢 Normal
- IG OAS: 0.74%
- Trend: Stable at low levels, no warning triggered
- Analysis: Credit spreads healthy, but CNN junk bond demand already extreme fear — credit market showing split signals
2. Yield Curve
- 10Y-2Y Spread: +34bp | 🟢 Normal
- 10Y: 4.51% | 2Y: 4.24% | 30Y: 4.95%
- Trend: Curve normalized, no longer inverted
- Analysis: Yield curve out of inversion. 30Y-10Y spread at -44bp shows long-end pressure, cautious economic expectations
3. Margin Debt
- Latest: $1.42T (May 2026, All-Time High)
- YoY Change: +8.5% (from Apr $1.304T)
- Status: 🔴 All-Time High
- Analysis: FINRA margin debt at record for two consecutive months. Historically, ATH margin debt precedes violent corrections (Mar 2000, Oct 2007)
4. IPO Count
- 2026 YTD: ~73 (Renaissance Capital)
- Q1 2026: 22 traditional IPOs, $9.4B raised (vs 2025 Q1: 15/$7.9B)
- vs Last Year: +47% increase
- Status: 🟡 Moderately warm
- Analysis: IPO activity rising but not euphoric (2021 same period: 200+), pace manageable
5. Fund Flows
- 2026 YTD ETF Net Inflows: ~$830B (through May)
- Record?: Yes — Active ETFs single-month $70B all-time record
- Status: 🔴 Euphoric
- Analysis: $830B+ YTD inflows, active ETFs 73 consecutive months of net inflows. Money flooding in while breadth deteriorating — classic “smart money out, retail in” late-cycle signature
Overall Assessment
| Signal | Status | Risk |
|---|---|---|
| Credit Spreads | HY OAS 2.65% Normal | 🟢 Low |
| Yield Curve | 10Y-2Y +34bp Normal | 🟢 Low |
| Margin Debt | $1.42T ATH | 🔴 High |
| IPO Count | ~73 moderately warm | 🟡 Medium |
| Fund Flows | $830B record | 🔴 High |
Verdict: 2🟢 / 1🟡 / 2🔴 — Credit markets healthy, but leverage and fund flows in danger zone. ATH margin debt + euphoric ETF inflows + deteriorating breadth = classic “calm before the storm.” Watch VIX breaking above 25 as acceleration trigger.