CNN Fear & Greed Sentiment Analysis 2026-06-23
Composite index at 34.7 (Fear), 12 consecutive days in fear zone; credit spreads normal but margin debt hits all-time high
🧭 CNN Fear & Greed Sentiment Analysis — 2026-06-23
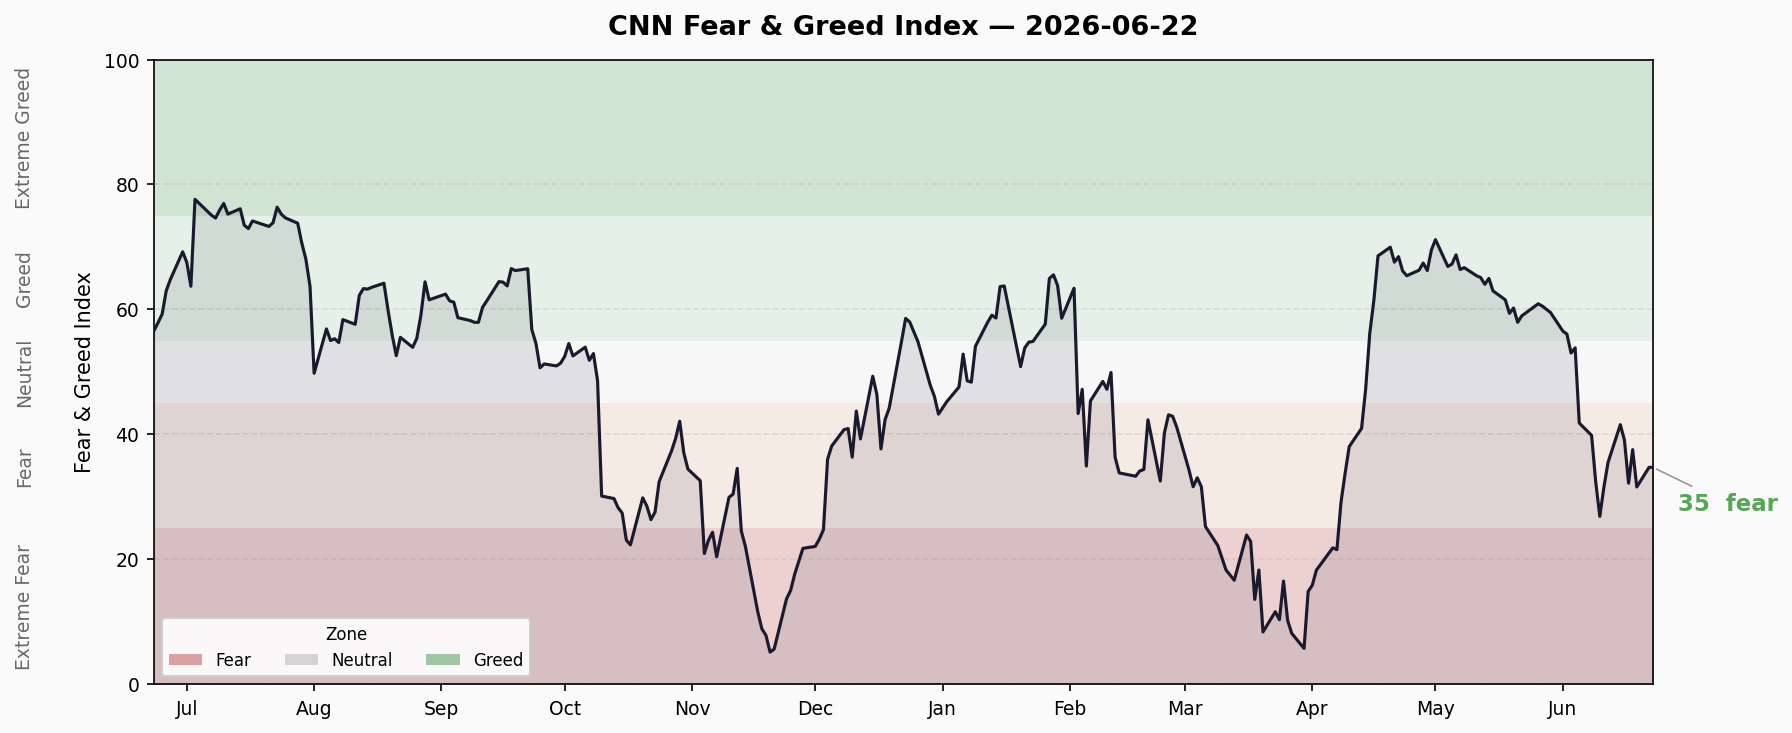
Composite Index
Current: 34.7 — Fear 😰
| Timeframe | Value | Change |
|---|---|---|
| Previous Close | 37.3 | -2.5 ⬇️ |
| 1 Week Ago | 41.6 | -6.9 ⬇️ |
| 1 Month Ago | 59.0 | -24.3 ⬇️ |
| 1 Year Ago | 54.5 | -19.8 ⬇️ |
10-Day Trend: 31.6 → 37.6 → 32.2 → 37.6 → 31.6 → 34.7 — Low-level oscillation, sustained fear zone
The composite index has been in the fear zone (<40) for 12 consecutive trading days, plummeting from 59 (Greed) in early June to 34.7. Down another 2.5 points from yesterday, downtrend intact.
7 Sub-Indicators Scan
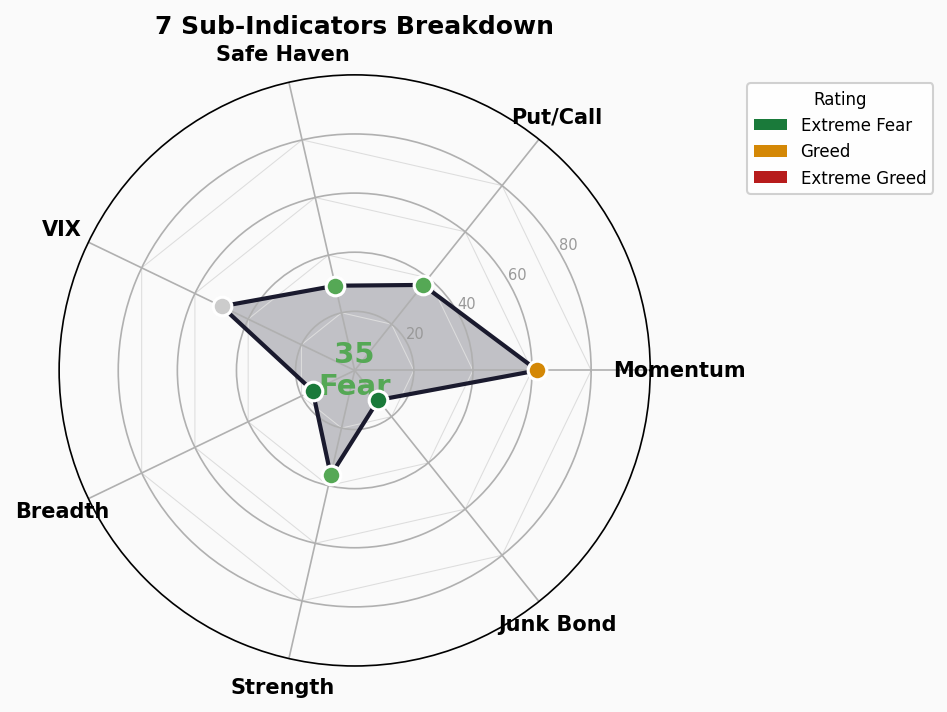
| # | Indicator | Score | Rating | Raw Value | Direction |
|---|---|---|---|---|---|
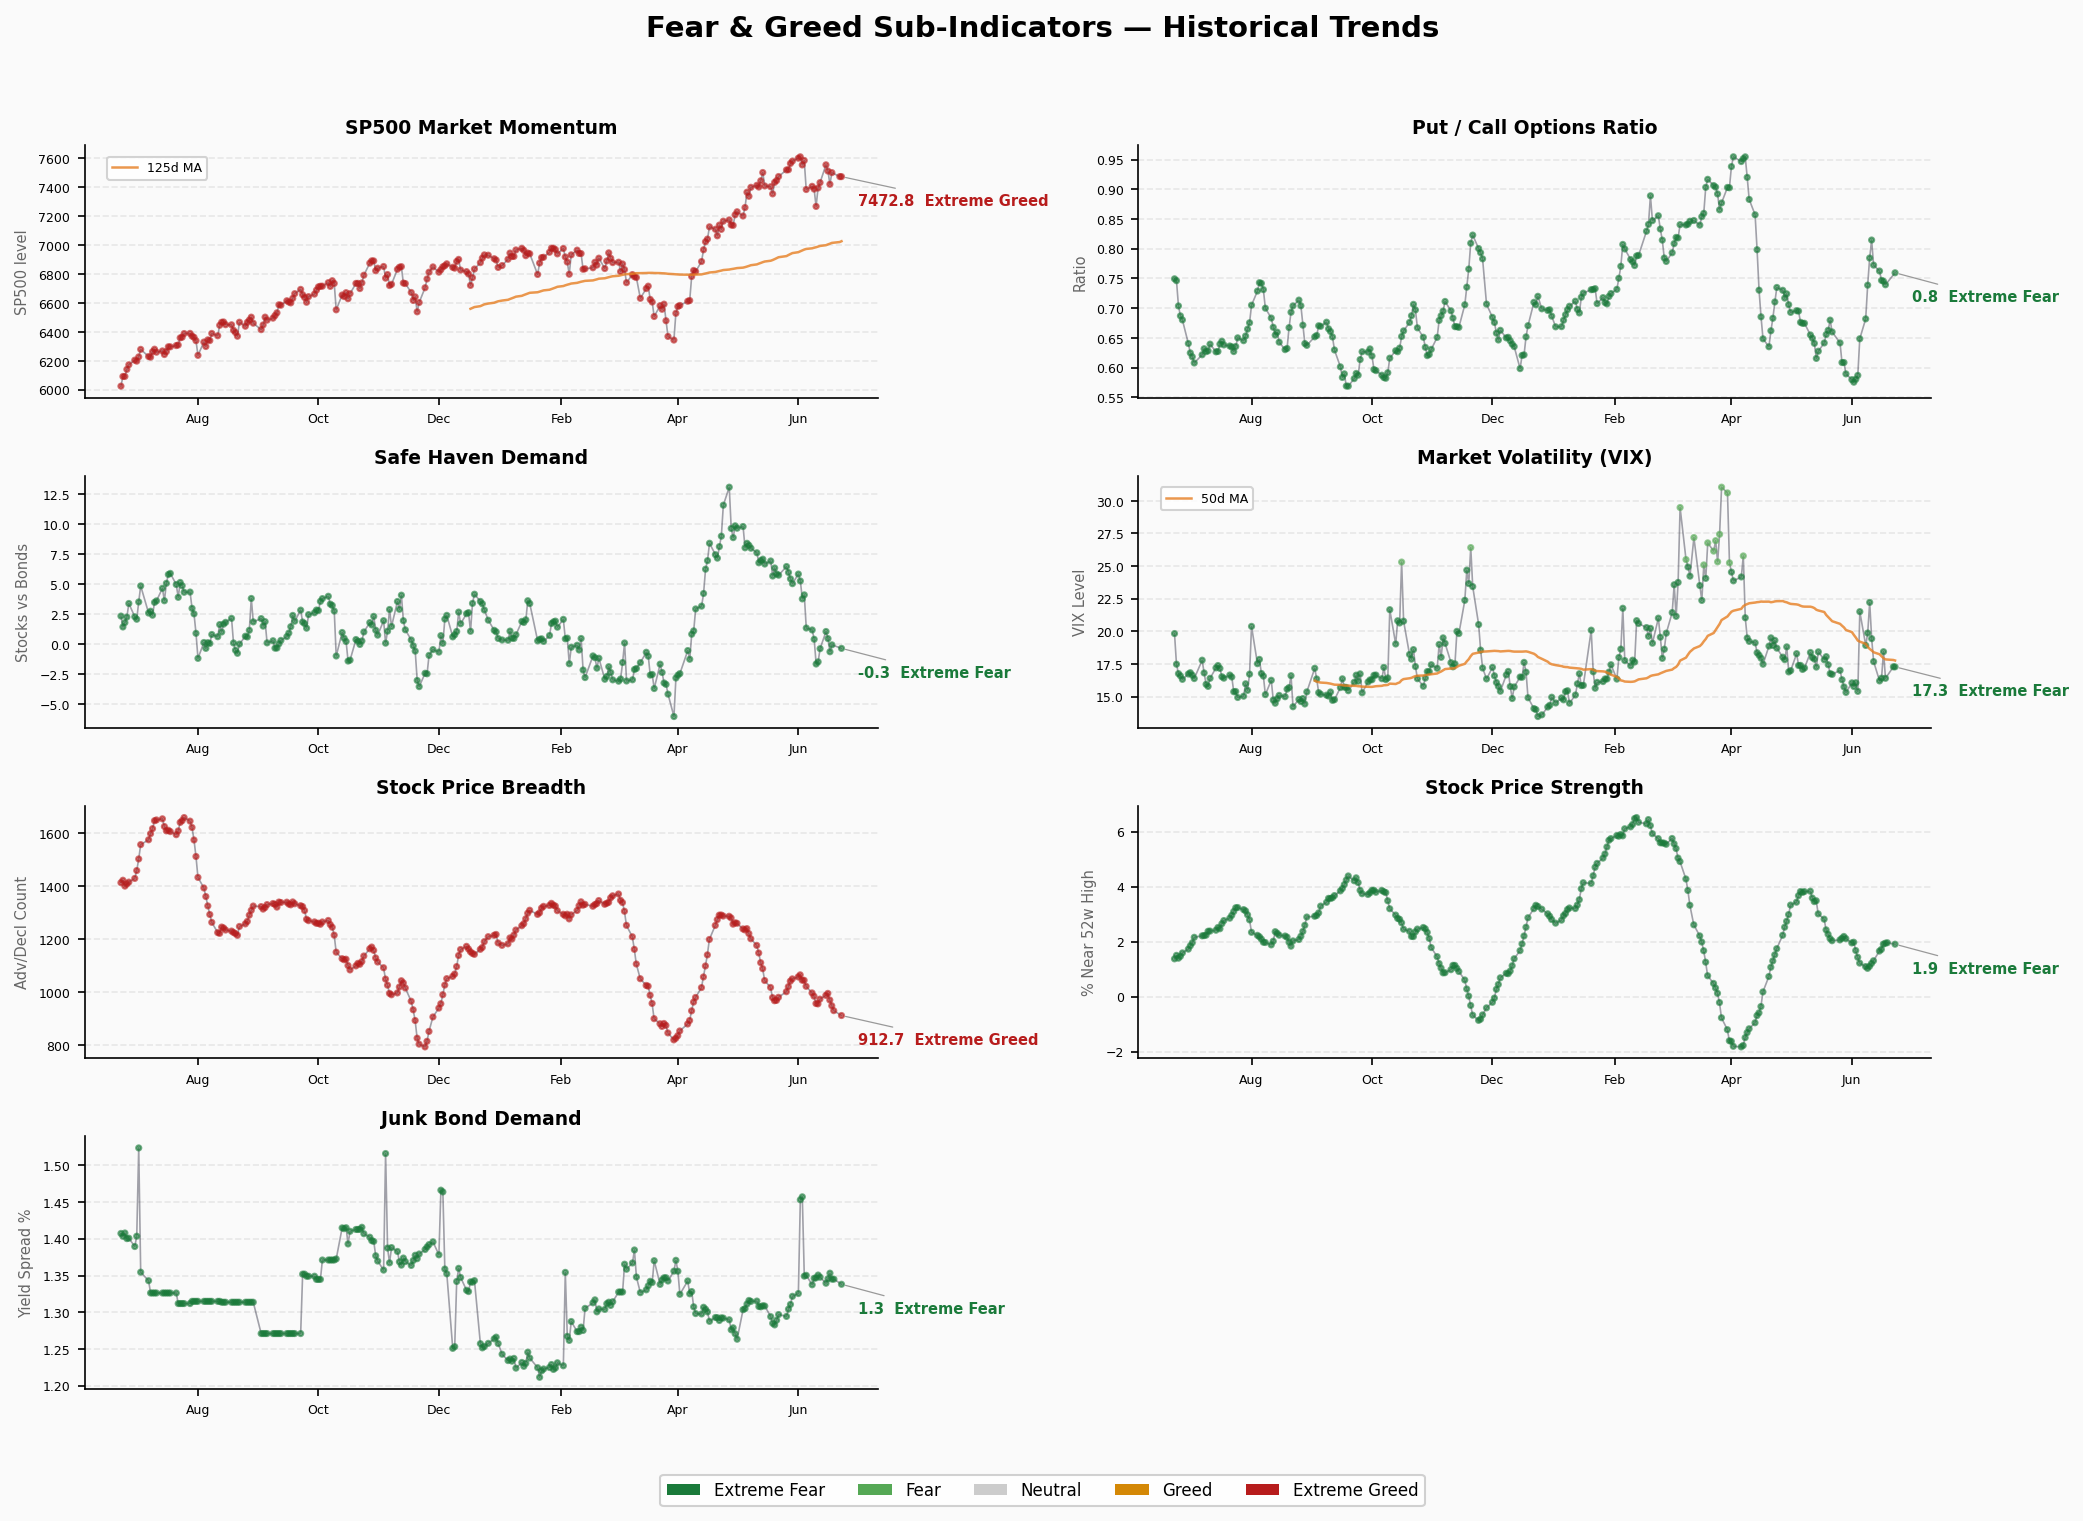
| 1 | Market Momentum (SP500) | 61.8 | 🟡 Greed | SPX 7,472.79 vs 125d MA | → Flat |
| 2 | Stock Price Strength | 36.4 | 😰 Fear | New highs vs new lows declining | ⬇️ Worsening |
| 3 | Stock Price Breadth | 15.8 | 🔴 Extreme Fear | Advancing issues shrinking fast | ⬇️ Worsening |
| 4 | Put/Call Options | 37.0 | 😰 Fear | Put/Call ratio rising | ⬇️ Worsening |
| 5 | Market Volatility (VIX) | 50.0 | ⚪ Neutral | VIX in mid-range | → Stable |
| 6 | Junk Bond Demand | 12.8 | 🔴 Extreme Fear | Capital fleeing high yield | ⬇️ Worsening |
| 7 | Safe Haven Demand | 29.4 | 😰 Fear | Capital flowing into treasuries | ⬇️ Worsening |
Structural Contradiction Analysis:
🔴 Extreme Value Signals:
- Stock Price Breadth at 15.8 (Extreme Fear): Advancing stocks have collapsed. Market breadth severely deteriorated — classic “few stocks propping up the index” pattern
- Junk Bond Demand at 12.8 (Extreme Fear): Credit market risk appetite collapsed, capital accelerating out of high-yield bonds
🟡 Divergence Signals:
- Market Momentum 61.8 (Greed) vs Breadth 15.8 (Extreme Fear): Index-level momentum still holds, but underlying breadth has crumbled — the hallmark of “mega-cap driven index” regime. S&P 500 maintained by mega-cap tech while majority of stocks decline
- VIX Neutral vs Put/Call Fear: Volatility index hasn’t panicked, but options market already pricing downside risk
Trend Assessment:
- Composite fell from Greed zone (59) in early June to Fear zone (34.7) over ~12 trading days
- Currently mid-fear zone; buffer to extreme fear (<20) remains
- Key Watch: If breadth continues deteriorating (<10), composite could break below 25 into extreme fear even without index decline
🚨 Crisis Early Warning Dashboard
1. Credit Spreads
- High Yield OAS: 2.66% | 🟢 Normal (<3% threshold)
- Investment Grade OAS: 0.74%
- Trend: Stable, no significant widening
- Analysis: Credit spreads still in safe zone, but watch closely — credit markets are often the last warning signal. When HY OAS breaks 4%, historical crash probability rises significantly
2. Yield Curve
- 10Y-2Y Spread: +27bp | 🟢 Normal (positive curve)
- 10Y: 4.46% | 2Y: 4.19% | 30Y: 4.90%
- 10Y-30Y Spread: -44bp (long-end inversion)
- Trend: Short end stable, long end under pressure
- Analysis: 10Y-2Y positive at 27bp, curve normalization sustained for months. But 10Y-30Y inversion of 44bp shows long-end pressured by inflation expectations — market still doubts long-term economic outlook
3. Margin Debt
- Latest: $1.42T (May 2026)
- YoY Change: +8.5% (sequential +8.5% from April)
- Status: 🔴 All-time high
- Analysis: FINRA margin debt hit record $1.42T in May, rising for second consecutive month. Leverage at extreme levels — classic late-bull indicator. In 2000 and 2007 crashes, margin debt was at historical peaks
4. IPO Count
- 2026 YTD: ~90 (estimated, operating companies)
- vs Prior Year: Increasing (2025 full-year ~90, 2026 at half-year pace already approaching)
- Status: 🟡 Warm to moderately hot
- Analysis: IPO market clearly recovering, but not yet at 2021 frenzy levels. Pace manageable, not构成 overheating signal
5. Fund Flows
- 2026 YTD ETF Net Inflows: $856.3B (through May)
- Record?: ✅ Yes (surpassed 2025 full-year $620.5B record)
- Status: 🔴 Frenzied
- Analysis: ETF inflows unprecedented — January alone $156B set monthly record. Active ETF YTD $320B on pace for $700B annual record. Liquidity extremely abundant, but this kind of frenzied inflow often marks late-cycle peaks
Overall Assessment
| Signal | Status | Risk Level |
|---|---|---|
| Credit Spreads | HY OAS 2.66% Normal | 🟢 Low |
| Yield Curve | 10Y-2Y +27bp Normal | 🟢 Low |
| Margin Debt | $1.42T All-time High | 🔴 High |
| IPO Count | ~90 Warm-hot | 🟡 Medium |
| ETF Fund Flows | $856.3B Record | 🔴 High |
Verdict: 2🟢 / 1🟡 / 2🔴 — Credit spreads and yield curve haven’t sounded alarms yet, but margin debt and ETF inflows are both at record-level overheating. The market exhibits a classic “calm surface, overheated undercurrent” pattern: index momentum maintained, but breadth collapsing, leverage at records, and capital pouring in at unprecedented rates. Watch credit spread marginal changes closely — it’s the last line of defense.
Sources: FRED (HY OAS, IG OAS, yield curve), FINRA (margin debt), ETFGI/Morningstar (ETF flows), Renaissance Capital (IPOs) | Generated: 2026-06-23 06:30 CST