CNN Fear & Greed Sentiment Analysis 2026-06-22
Composite index at 37.3 stays in Fear territory; junk bond demand plunges to extreme fear (9.4), market breadth continues deteriorating
📊 CNN Fear & Greed Sentiment Analysis | 2026-06-22
Composite Index
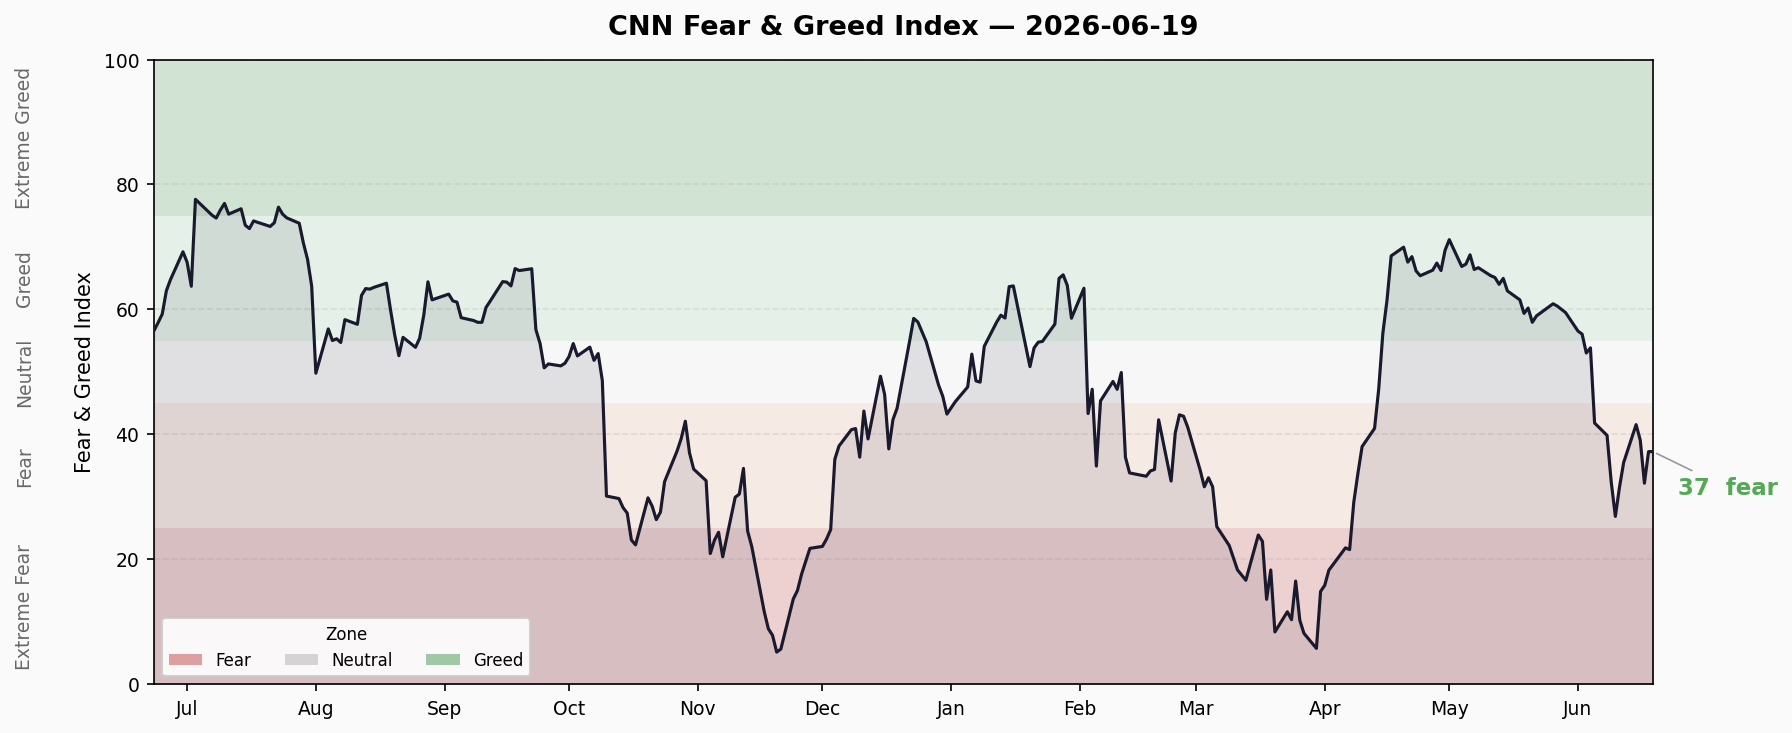
Current: 37.3 — 🟡 Fear
| Timeframe | Score | Status |
|---|---|---|
| Latest | 37.3 | Fear |
| Previous Close | 37.5 | Fear |
| 1 Week Ago | 35.5 | Fear |
| 1 Month Ago | 59.4 | Greed |
| 1 Year Ago | 54.3 | Greed |
Trend Assessment: Sentiment has declined from Greed territory (60+) in mid-May to Fear, where it has lingered for approximately 3 weeks. Recent trading shows a narrow 35-38 range with no clear reversal signal.
Seven Sub-Indicators Scan
| # | Indicator | Score | Rating | Raw Value | Direction |
|---|---|---|---|---|---|
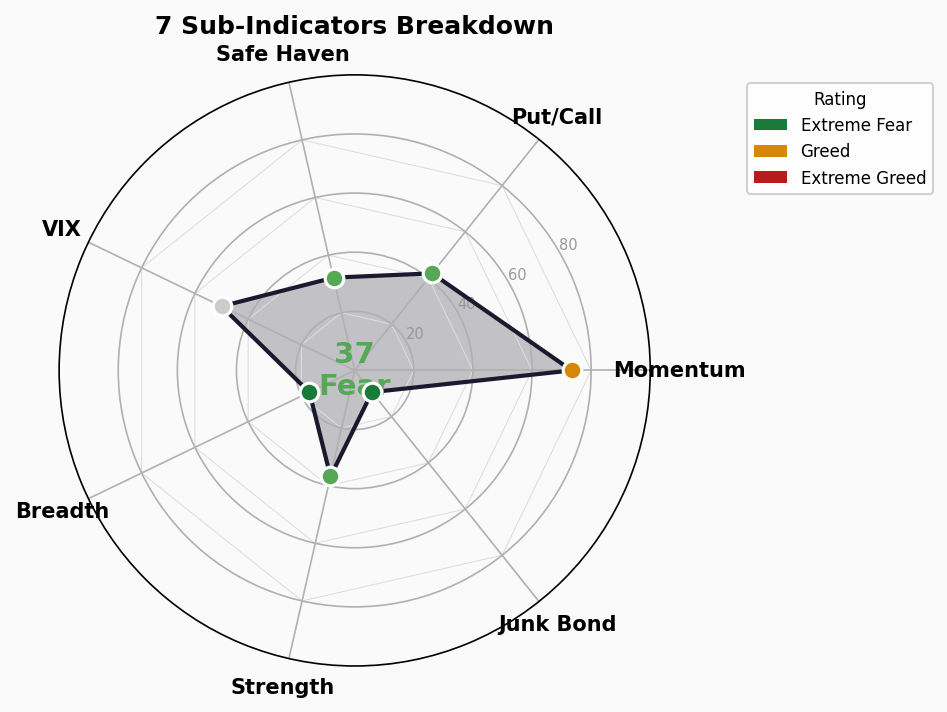
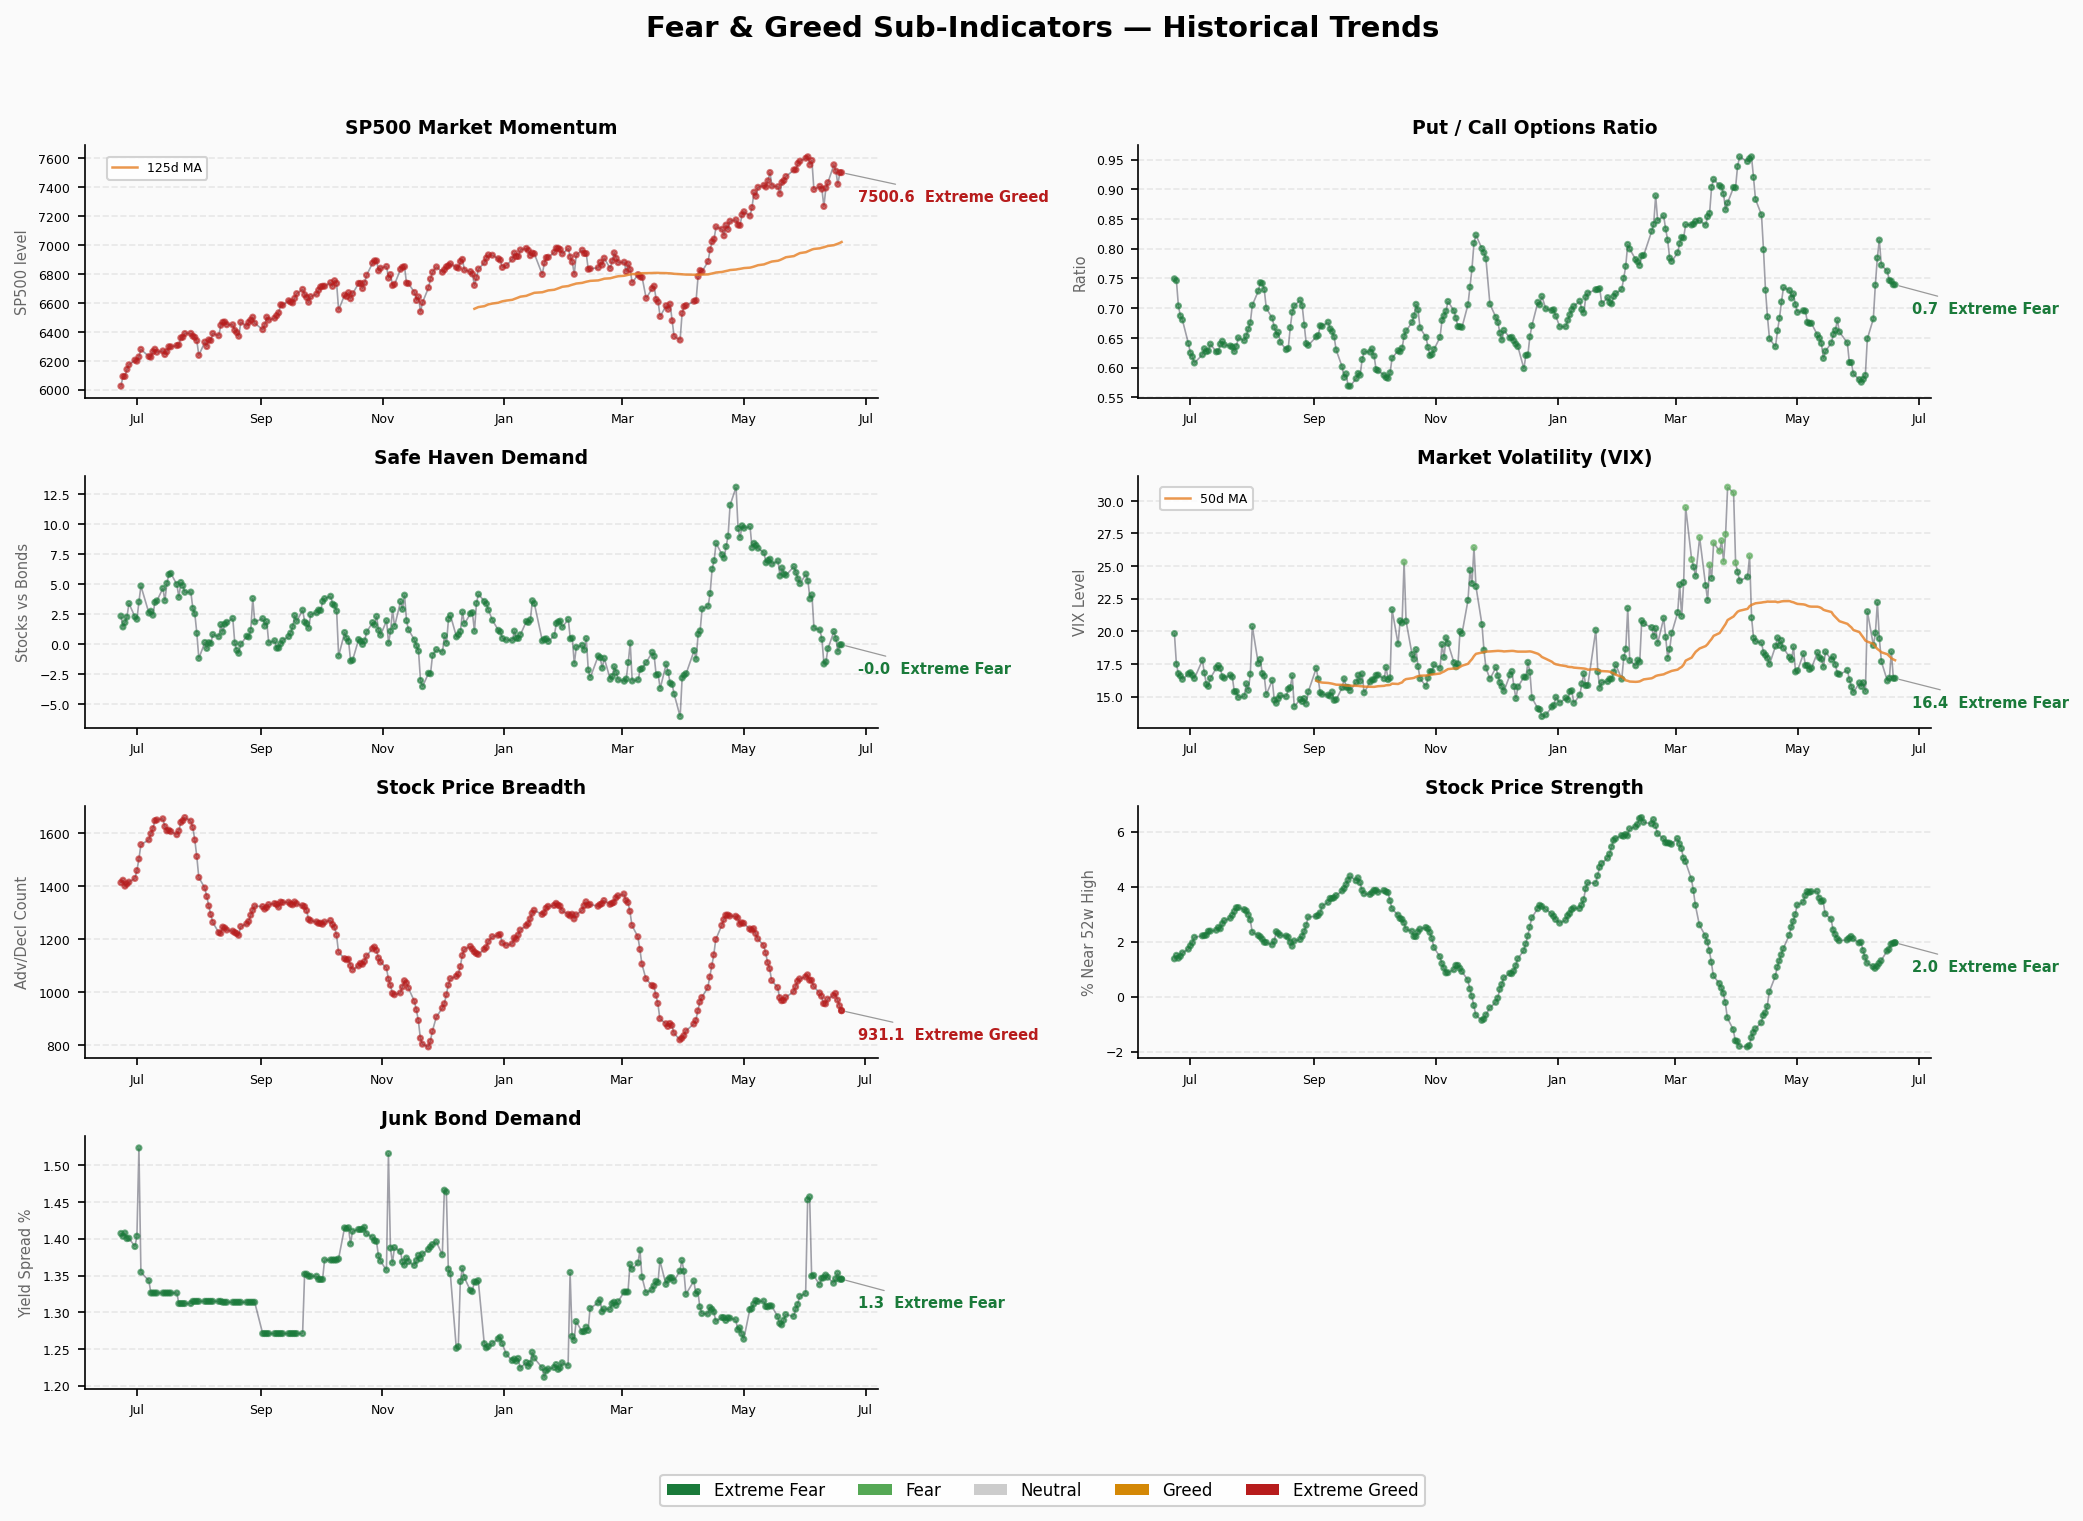
| 1 | Market Momentum (S&P500) | 73.4 | 🟢 Greed | 7500.58 | → |
| 2 | Stock Price Strength | 36.8 | 🟡 Fear | New High/Low = 1.96 | ↓ |
| 3 | Market Breadth | 17.0 | 🔴 Extreme Fear | A/D = 931 | ↓↓ |
| 4 | Put/Call Options | 42.0 | 🟡 Fear | P/C = 0.74 | ↑ |
| 5 | Market Volatility (VIX) | 50.0 | ⚪ Neutral | VIX = 16.4 | → |
| 6 | Junk Bond Demand | 9.4 | 🔴 Extreme Fear | Yield Spread = 1.35% | ↓↓ |
| 7 | Safe Haven Demand | 32.2 | 🟡 Fear | Stock/Bond = -0.025 | → |
Structural Contradictions
🔴 Key Tension: Momentum vs Breadth
- Market Momentum (73.4) and VIX (50.0) show the index still trades at elevated levels
- But Market Breadth (17.0) has plunged into Extreme Fear — decliners vastly outnumber advancers
- This means the index is being propped up by a handful of mega-caps while the majority of stocks are already in bear territory
🔴 Junk Bond Demand in Freefall
- Sub-indicator at just 9.4 — the weakest of all seven signals
- While absolute yield spread (1.35%) isn’t alarming, demand for junk bonds has evaporated
- This is typically an early warning of credit market deterioration
🟡 Put/Call Ratio Rising
- P/C ratio climbed from 0.65 to 0.74 as options markets begin building protection
- Not yet at extreme fear levels — panic selling hasn’t materialized
Trend Assessment
- Range Bound: FNG has traded in the 35-42 Fear zone for ~3 weeks — consolidation within fear
- Reversal Signal: Not yet. Breadth continues deteriorating (30→17) while momentum gradually weakens
- Extreme Readings: Junk Bond Demand (9.4) and Market Breadth (17.0) both at extreme fear. Historically this combination often precedes market bottoms
- Caveat: If breadth keeps worsening while the index catches up to the downside, FNG could break below 20
🚨 Crisis Signal Dashboard
1. Credit Spreads
- High-Yield OAS: 2.63% | 🟢 Normal
- Investment-Grade OAS: 0.74% | 🟢 Normal
- Trend: HY spreads remain compressed with no significant widening
- Analysis: Credit markets haven’t priced in risk yet, but junk bond demand is abnormally weak — watch for lagged spread widening
2. Yield Curve
- 10Y-2Y Spread: +27bp | 🟢 Normal (positive)
- 10Y: 4.49% | 2Y: 4.20% | 30Y: 4.93%
- Trend: Curve positive but flat (27bp), long-end rates elevated
- Analysis: Healthy curve shape with no inversion warning. However, 30Y-10Y spread at -44bp suggests long-end pricing is tight
3. Margin Debt
- Latest: $1.42T (May 2026, all-time record)
- YoY Change: +53% (from $0.93T a year ago)
- Status: 🔴 All-Time High
- Analysis: Margin debt surged 8.5% in one month — leveraged capital piling in at historic rates. Classic late-cycle behavior. Forced liquidation risk on any market turn
4. IPO Count
- 2026 YTD: ~178 (all types)
- vs Same Period Last Year: Increased (22 traditional IPOs in Q1 2026 vs 15 in Q1 2025)
- Status: 🟡 Moderate-to-Warm
- Analysis: IPO activity recovering but not yet euphoric (2020 had 480). Normal-to-warm zone
5. Fund Flows
- 2026 YTD ETF Net Inflows: $856B+ (on pace for record year)
- Record?: Yes — Active ETFs alone at $320B YTD, annualizing to $700B record
- Status: 🔴 Euphoric
- Analysis: ETF inflows at fastest pace ever recorded. Passive investing continues to suck in capital, but this one-way flow faces liquidity vacuum risk on reversal
Overall Assessment
| Signal | Status | Danger Level |
|---|---|---|
| Credit Spreads | 🟢 Normal | Low |
| Yield Curve | 🟢 Positive | Low |
| Margin Debt | 🔴 ATH | High |
| IPO Count | 🟡 Warm | Medium |
| Fund Flows | 🔴 Record Euphoric | High |
Summary: 2🟢 / 1🟡 / 2🔴 — Credit markets appear calm on the surface, but leverage and fund flows are both at extreme levels. If sentiment turns, “liquidity retreat” risk is significant. The key watchpoints: any inflection in margin debt or ETF flows.