CNN Fear & Greed Analysis 2026-06-21
Composite index 37.3 in Fear territory; breadth at 17 extreme fear; severe internal market divergence
📊 Composite Index
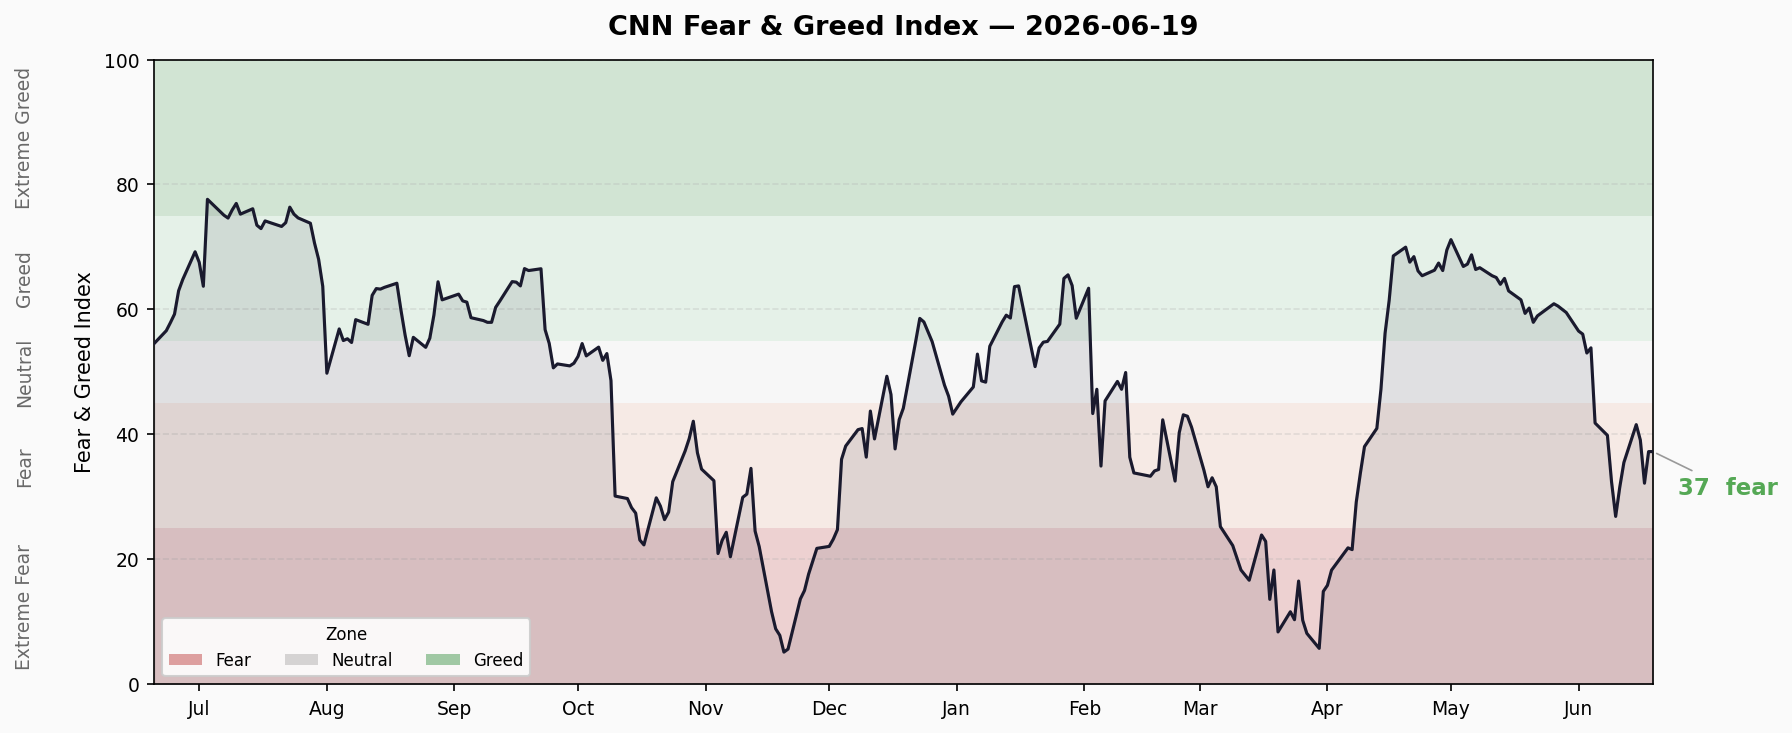
Current Reading: 37.3 — 🟡 Fear
| Time Window | Reading | Change |
|---|---|---|
| Previous Close | 37.5 | -0.2 |
| 1 Week Ago | 35.5 | +1.8 |
| 1 Month Ago | 59.4 | -22.1 |
| 1 Year Ago | 54.3 | -17.0 |
Trend: Plunged from 59.4 (Greedy) to 37.3 (Fear) over the past month — a 22-point collapse. Recent 10 days oscillating between 26.9-41.6; no clear bottoming signal yet.
Recent 10-Day Path:
| Date | Score | Zone |
|---|---|---|
| 06/09 | 32.4 | Fear |
| 06/10 | 26.9 | Fear (recent low) |
| 06/11 | 31.6 | Fear |
| 06/12 | 35.5 | Fear |
| 06/15 | 41.6 | Fear (recent high) |
| 06/16 | 39.1 | Fear |
| 06/17 | 32.2 | Fear |
| 06/18 | 37.3 | Fear |
| 06/19 | 37.3 | Fear |
🔍 Seven Sub-Indicators Scan
| # | Indicator | Score | Rating | Raw Value | Direction |
|---|---|---|---|---|---|
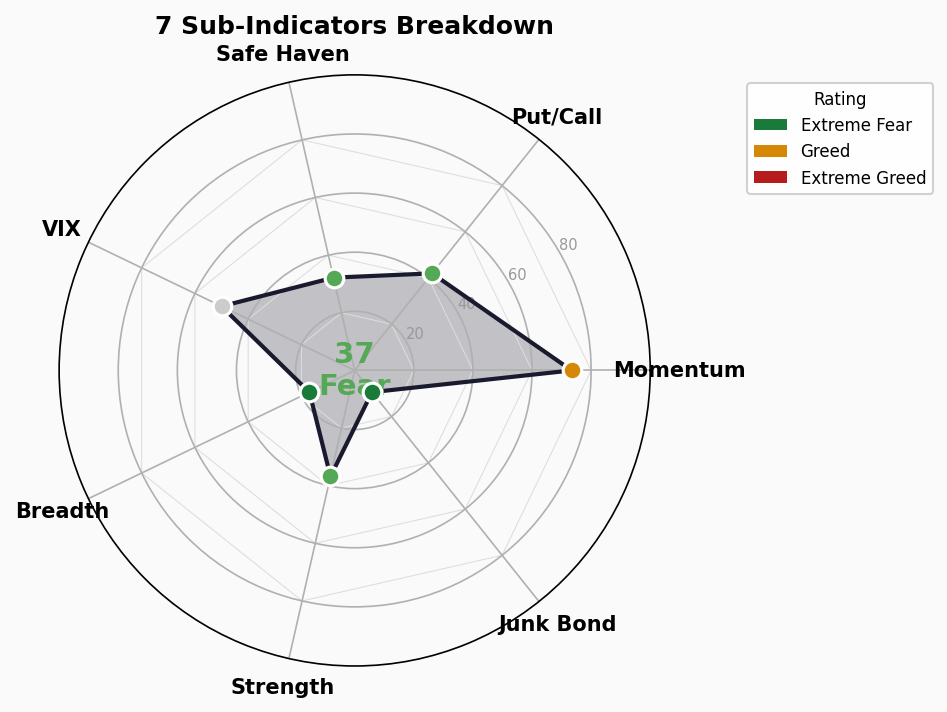
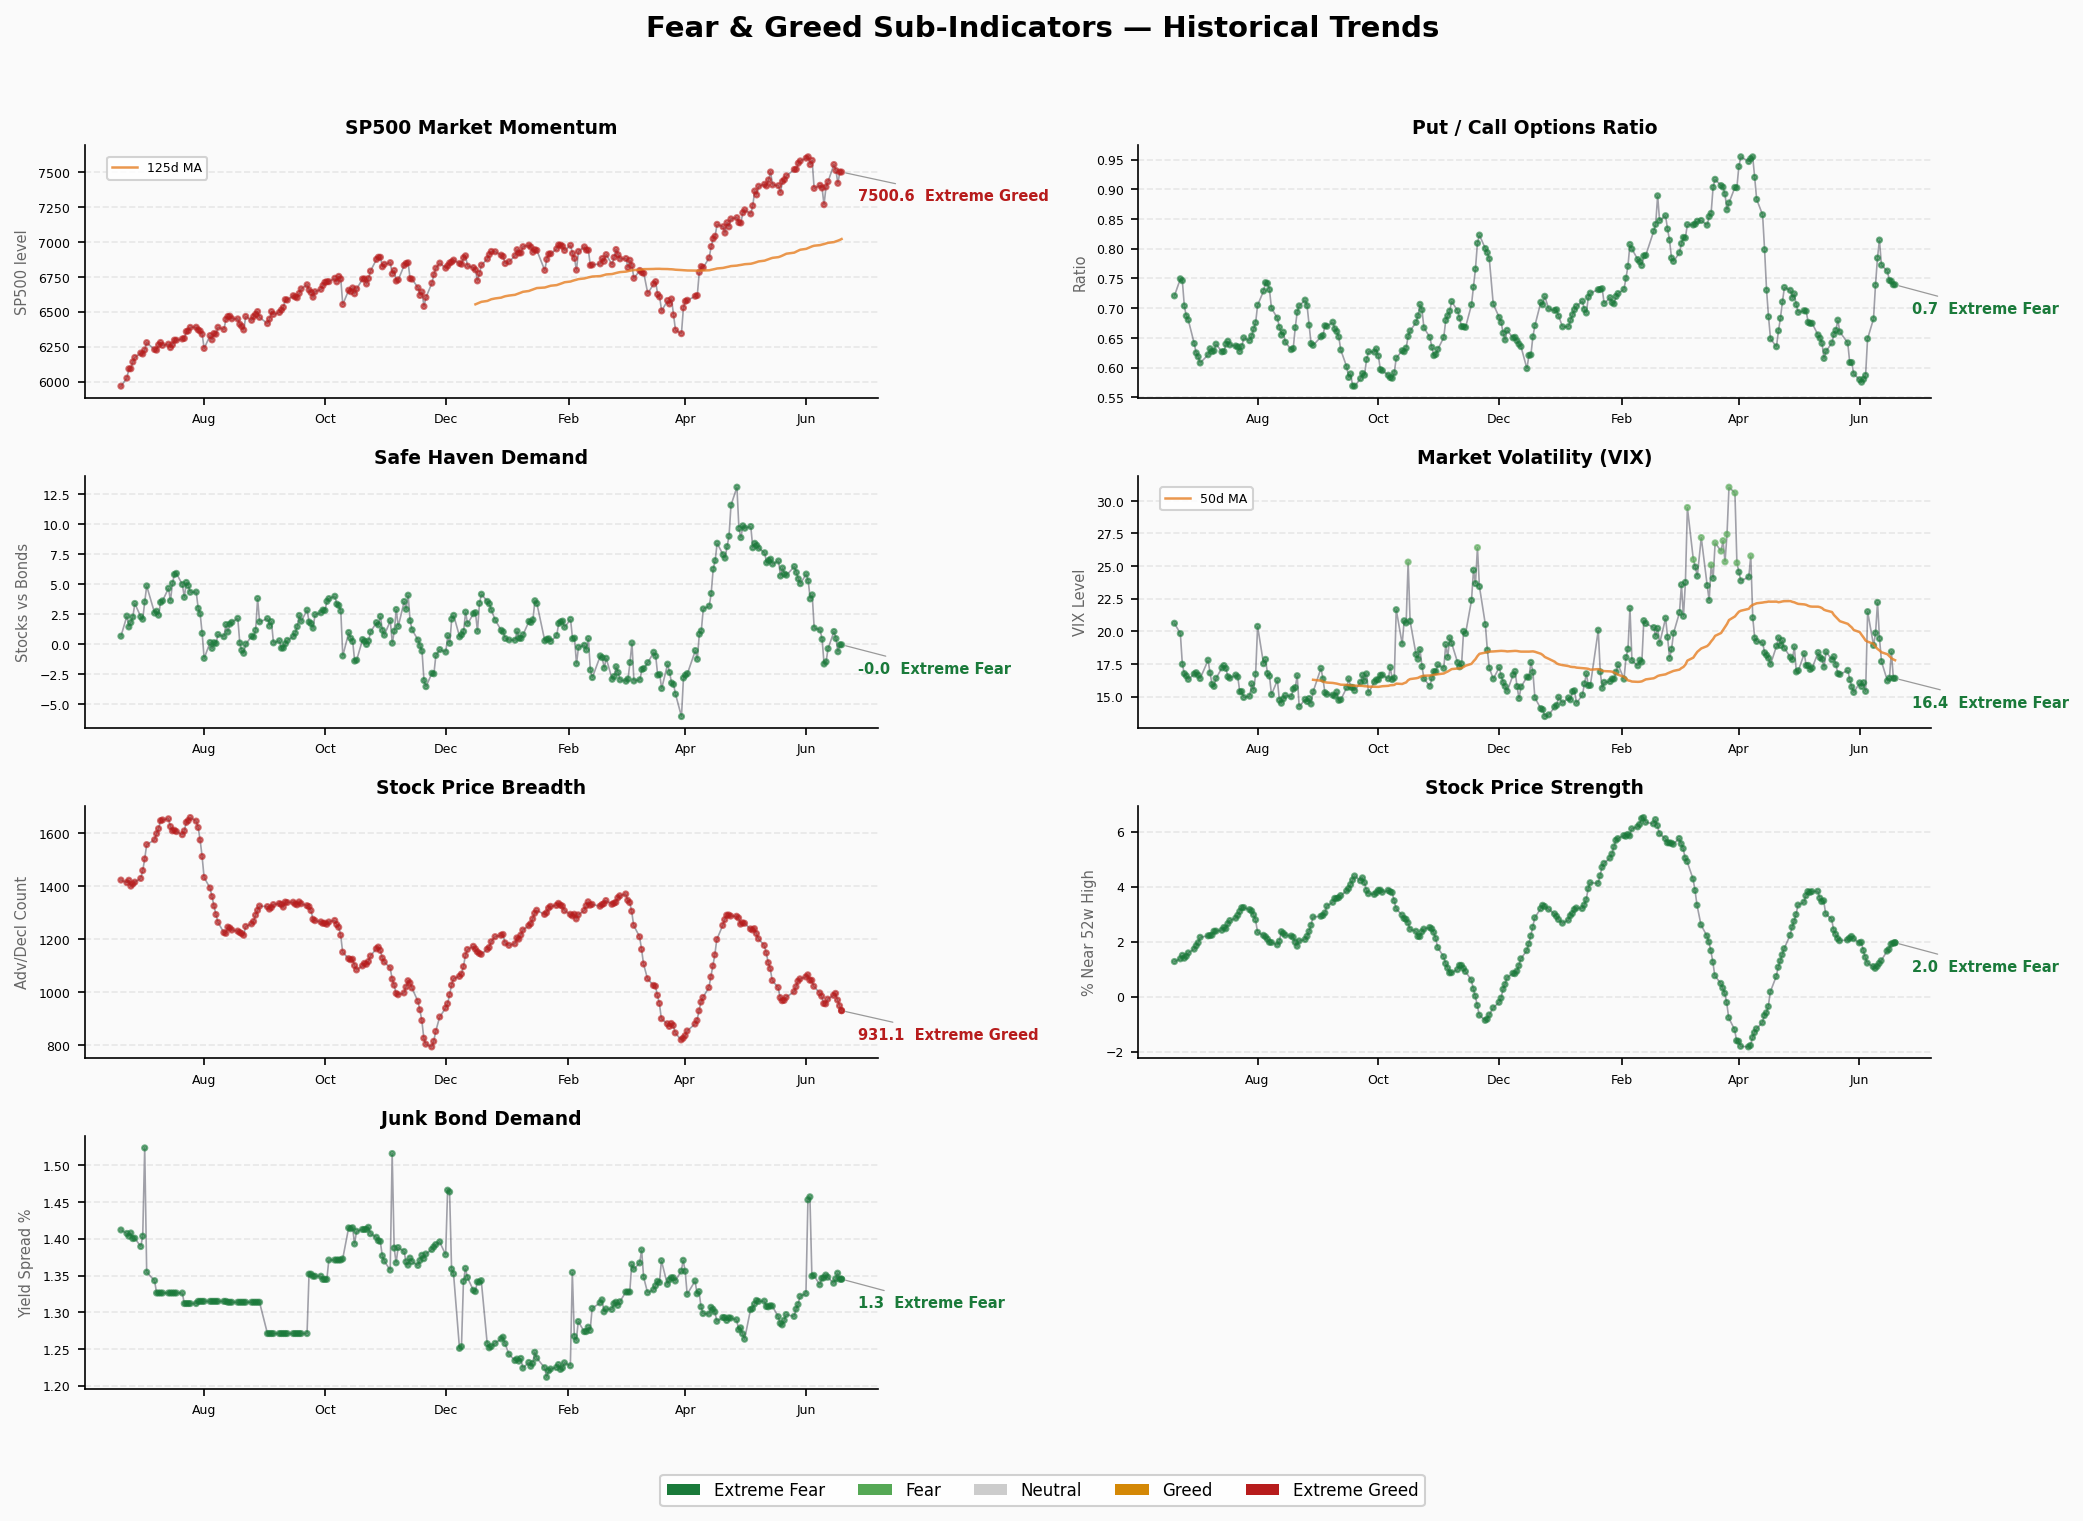
| 1 | Market Momentum (S&P 500) | 73.4 | 🟢 Greed | 7,500.58 | ↑ Still elevated |
| 2 | Stock Price Strength | 36.8 | 🟡 Fear | +1.96% | → Flat |
| 3 | Stock Price Breadth | 17.0 | 🔴 Extreme Fear | 931.07 | ↓ Deteriorating |
| 4 | Put/Call Options Ratio | 42.0 | 🟡 Fear | 0.739 | → Neutral-bearish |
| 5 | Market Volatility (VIX) | 50.0 | ⚪ Neutral | 16.4 | → Low range |
| 6 | Junk Bond Demand | 9.4 | 🔴 Extreme Fear | +1.35% | ↓ Sharp decline |
| 7 | Safe Haven Demand | 32.2 | 🟡 Fear | -2.48% | ↑ Risk appetite cooling |
⚠️ Structural Divergence Analysis
Extreme Value Scan
- Junk Bond Demand 9.4 (Extreme Fear): Credit market deeply averse to risk assets. OAS spread still at 2.63% but demand-side has collapsed — a classic early warning
- Stock Price Breadth 17.0 (Extreme Fear): Persistent deterioration means only a handful of mega-caps hold the index up; the majority of stocks are already lagging
Divergence Signals
- Momentum vs Breadth (73 vs 17): The most alarming divergence. S&P 500 sits at 7,500 but only a few constituents are pulling weight. This is textbook “index up, stocks down” distribution
- VIX 50 (Neutral) vs Breadth/Credit Extremes: VIX fails to capture internal fragility — implied vol is suppressed while real risk accumulates under the surface
- Safe Haven Decline vs Breadth Deterioration: Treasury/gold haven demand hasn’t surged, suggesting capital hasn’t panicked out yet — but the market structure is already severely damaged
Verdict: This “stable index, crumbling internals” divergence has historically preceded mid-cycle corrections. Breadth collapse + credit contraction is a combination worth watching closely.
🚨 Crisis Early-Warning Dashboard
1. Credit Spreads
- High Yield OAS: 2.63% | 🟢 Normal
- Investment Grade OAS: 0.74% | 🟢 Normal (<1%)
- Trend: Stable day-over-day
- Analysis: Spread levels remain benign, but junk bond demand (9.4 extreme fear) contradicts — low spreads may reflect liquidity withdrawal rather than calm. A “false peace” scenario
2. Yield Curve
- 10Y-2Y Spread: +27bp | 🟢 Normal (positive)
- 10Y: 4.49% | 2Y: 4.20% | 30Y: 4.93%
- Trend: Slight steepening
- Analysis: Curve fully un-inverted, +27bp in healthy range. 30Y-10Y +44bp normal. Rate environment manageable for banks and credit system
3. Margin Debt
- Latest Value: $1.304T (April 2026, FINRA monthly)
- YoY Change: ~+12% (estimated)
- Status: 🟡 Elevated (historical high range)
- Analysis: Margin debt above $1.3T is historically elevated. Leveraged capital concentration means a downturn would trigger forced liquidation cascades
4. IPO Activity
- 2026 YTD: ~73 IPOs (Renaissance Capital)
- vs Prior Year: Up (2025 same period ~60)
- Status: 🟡 Warm, mildly elevated
- Analysis: IPO pace recovering from 2024-2025 trough, not yet at 2021 “SPAC-every-day” mania levels
5. Fund Flows
- 2026 YTD ETF Net Flows: ~$856B (record level)
- Record?: Yes
- Status: 🔴 Record Inflows
- Analysis: ETF flows at all-time highs, far exceeding 2021 pace. Passive capital flooding into a narrow set of mega-cap names — the “ETF-driven rally” that reverses with high homogeneity
Composite Assessment
| Signal | Status | Risk Level |
|---|---|---|
| Credit Spreads | 🟢 Normal | Low (demand anomaly) |
| Yield Curve | 🟢 Normal | Low |
| Margin Debt | 🟡 Elevated | Medium |
| IPO Activity | 🟡 Warm | Medium |
| Fund Flows | 🔴 Record | High |
Overall: 2🟢 / 2🟡 / 1🔴 — Traditional crisis indicators (spreads, curve) haven’t triggered, but “record fund inflows + extreme breadth deterioration” is a combination demanding vigilance. The market is in a structurally fragile “prosperity index, depression beneath” state. Core risk isn’t macro shock — it’s liquidity reversal. If ETF flows slow or reverse, the highly concentrated holdings will face chain-liquidation.
Sources: CNN Fear & Greed Index, FRED, FINRA, Renaissance Capital, ETF.com Disclaimer: This analysis is for informational purposes only and does not constitute investment advice