CNN Fear & Greed Analysis 2026-06-20
Composite index 37 Fear; 12 consecutive fear sessions; junk bond demand 9.4 extreme fear; margin debt at all-time high
Composite Index
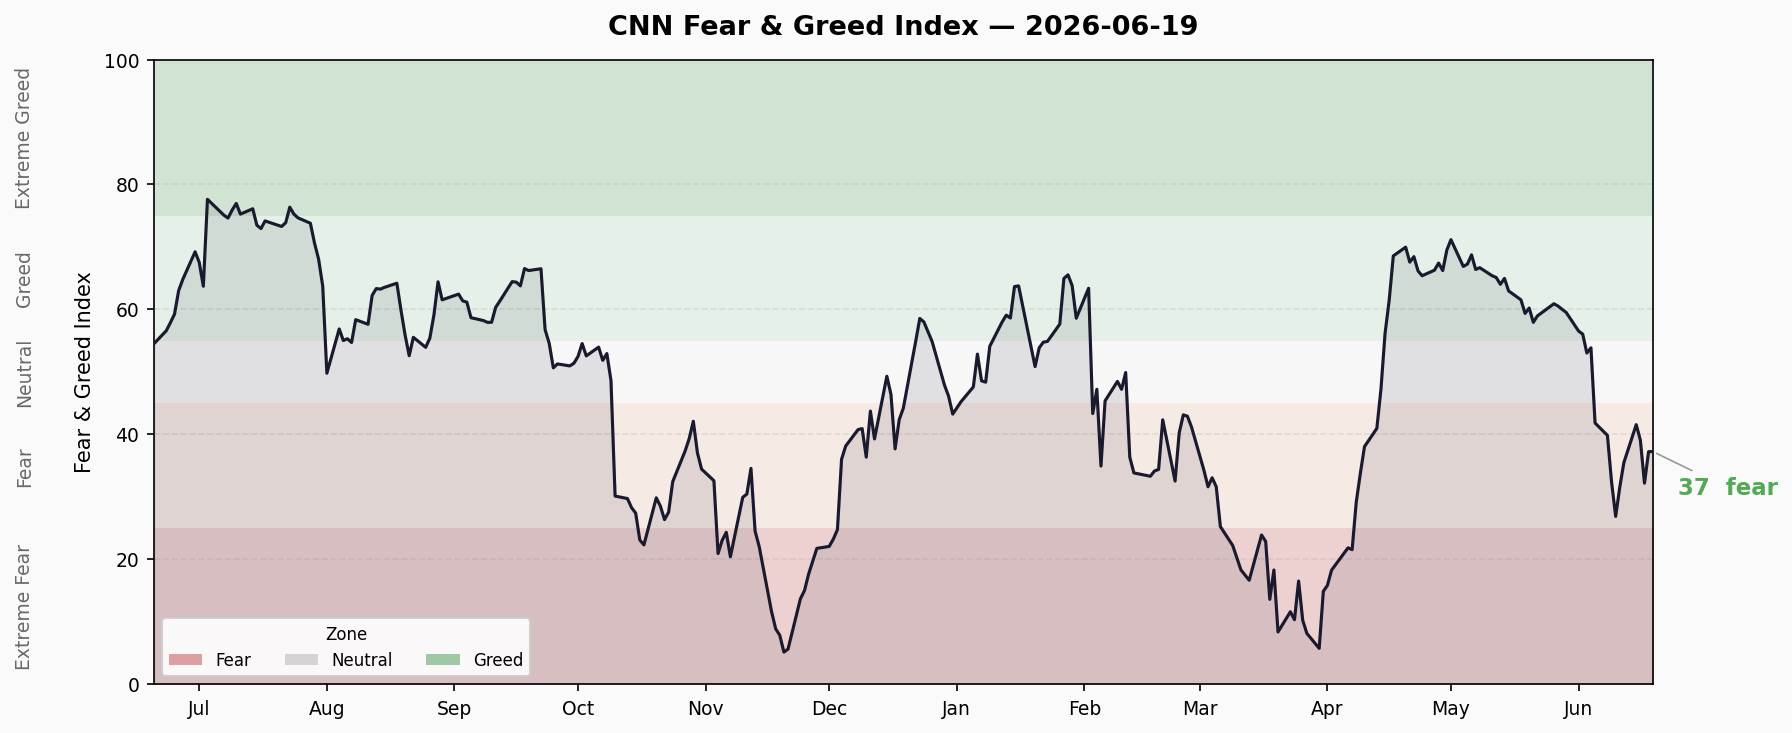
Current Score: 37.3 / 100 — 😰 Fear
| Timeframe | Score | Change |
|---|---|---|
| Today | 37.3 | — |
| Previous Day | 37.5 | -0.2 |
| 1 Week Ago | 35.5 | +1.8 |
| 1 Month Ago | 59.4 | -22.1 |
| 1 Year Ago | 54.3 | -17.0 |
10-Day Trend
Jun 02: 56.1  ██████████████████████████░░░░  greed
Jun 03: 53.0  ██████████████████████████░░░░  neutral
Jun 04: 53.9  ██████████████████████████░░░░  neutral
Jun 05: 41.8  ████████████████████░░░░░░░░░░  fear
Jun 08: 39.9  ███████████████████░░░░░░░░░░░  fear
Jun 09: 32.4  ████████████████░░░░░░░░░░░░░░  fear
Jun 10: 26.9  █████████████░░░░░░░░░░░░░░░░░  fear    ← Recent low
Jun 11: 31.6  ███████████████░░░░░░░░░░░░░░░  fear
Jun 12: 35.5  █████████████████░░░░░░░░░░░░░  fear
Jun 15: 41.6  ████████████████████░░░░░░░░░░  fear
Jun 16: 39.1  ███████████████████░░░░░░░░░░░  fear
Jun 17: 32.2  ████████████████░░░░░░░░░░░░░░  fear
Jun 18: 37.3  ██████████████████░░░░░░░░░░░░  fear
Jun 19: 37.3  ██████████████████░░░░░░░░░░░░  fear
Trend Assessment: Sharp decline from Greed territory in early June, bottoming at 26.9 on Jun 10 (near Extreme Fear). Bounced but failed to break above 40, now oscillating in 32-42 range. 12 consecutive sessions in Fear territory.
7 Sub-Indicators Scan
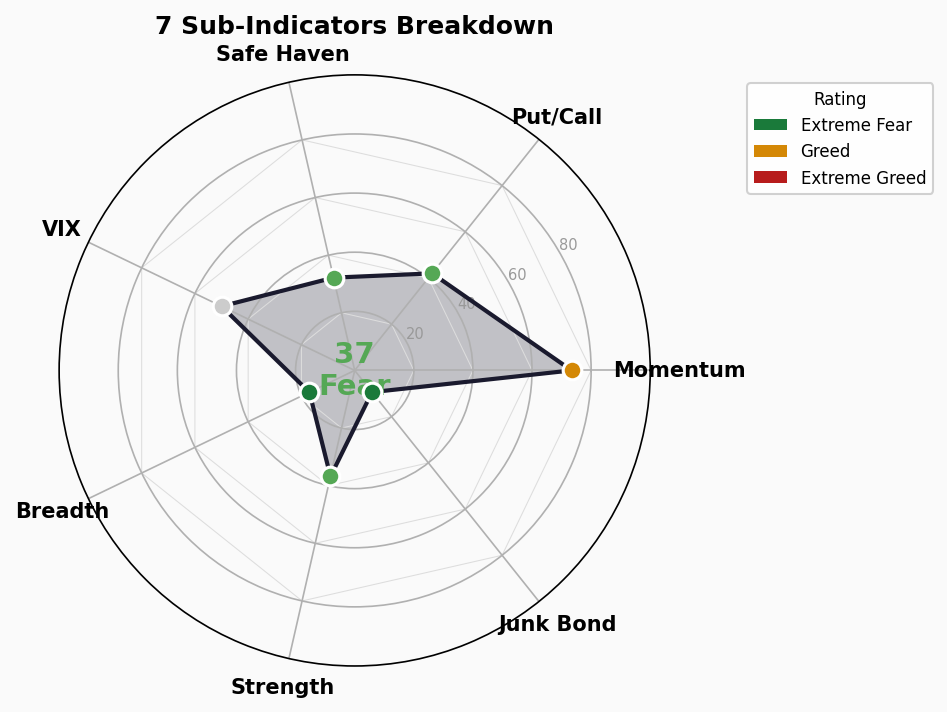
| # | Indicator | Score | Rating | Raw Value | Direction |
|---|---|---|---|---|---|
| 1 | Market Momentum (S&P vs 125MA) | 73.4 | 🟢 Greed | S&P 500: 7500.58 | → Above MA |
| 2 | Stock Price Strength (New Highs/Lows) | 36.8 | 🟡 Fear | Ratio: 1.96 | ↓ Deteriorating |
| 3 | Stock Price Breadth (A/D Line) | 17.0 | 🔴 Extreme Fear | A/D: 931.07 | ↓↓ Sharply worse |
| 4 | Put/Call Options | 42.0 | 🟡 Fear | P/C: 0.739 | ↓ Bearish hedging |
| 5 | Market Volatility (VIX) | 50.0 | ⚪ Neutral | VIX: 16.4 | → Stable |
| 6 | Junk Bond Demand (HY OAS) | 9.4 | 🔴 Extreme Fear | OAS: 1.35% | ↓↓ Deteriorating |
| 7 | Safe Haven Demand | 32.2 | 🟡 Fear | Diff: -0.025 | ↓ Flight to safety |
Sub-Indicator Deep Dive
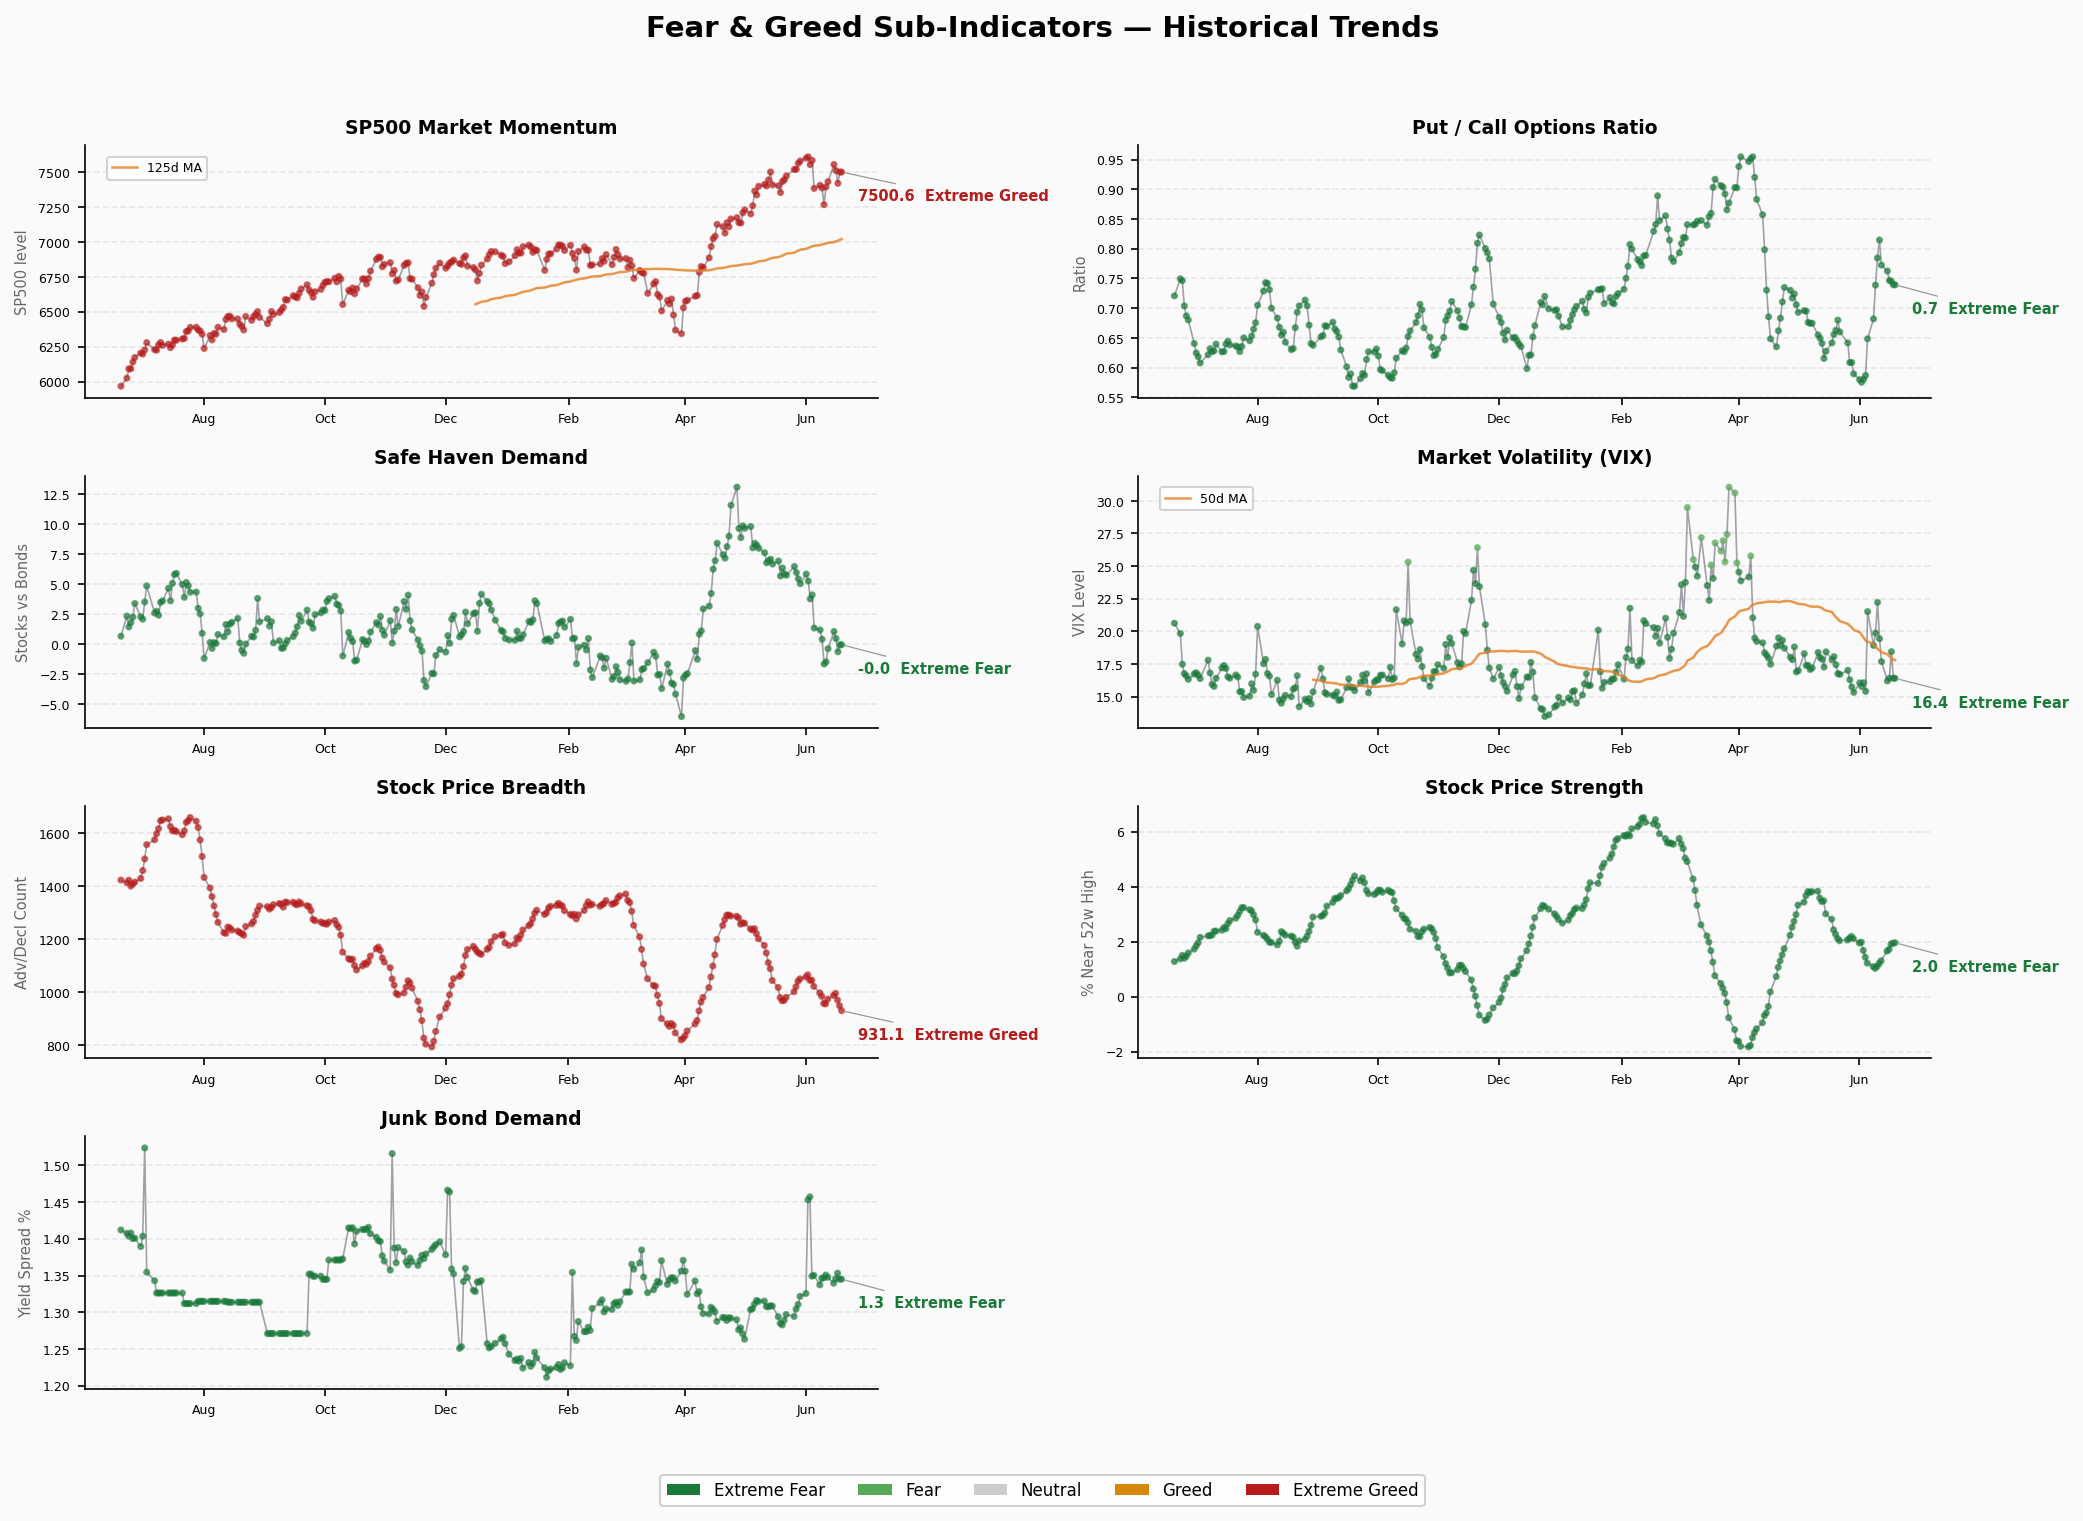
1. Market Momentum (73.4 — Greed) S&P 500 at 7500.58, still above its 125-day moving average. This is the only bullish signal among 7 indicators. However, momentum is a lagging indicator — price is high but internal structure is deteriorating.
2. Stock Price Strength (36.8 — Fear) New high/low ratio of just 1.96, well below healthy levels. Fewer stocks making new highs means narrowing market breadth. Slight rebound from extreme fear but still weak.
3. Stock Price Breadth (17.0 — Extreme Fear) Most dangerous signal. A/D line at 931 deep in negative territory — declining stocks vastly outnumber advancing ones. Lowest score among all 7 indicators. Classic “hollow market” — a few mega-caps hold up the index while the majority of stocks decline.
4. Put/Call Options (42.0 — Fear) P/C ratio at 0.739, elevated. Market participants are buying puts for hedging, reflecting caution. But not yet at extreme levels.
5. Market Volatility (50.0 — Neutral) VIX at 16.4, normal range. The only completely neutral indicator. Market is NOT pricing tail risk, which diverges sharply from the extreme fear in breadth.
6. Junk Bond Demand (9.4 — Extreme Fear) Second major danger signal. HY OAS at just 1.35% — extremely tight credit spreads. Market is pricing credit risk at near-zero levels. Investors are accepting minimal risk premium for holding junk bonds. If economic data weakens or a credit event occurs, spreads could blow out rapidly.
7. Safe Haven Demand (32.2 — Fear) Capital flowing into Treasuries and away from risk assets. Negative differential confirms risk-off sentiment dominates.
Structural Contradiction Analysis
Extreme Value Signals
| Indicator | Score | Zone | Signal |
|---|---|---|---|
| Breadth | 17.0 | <20 | ⚠️ Extreme Fear |
| Junk Bond Demand | 9.4 | <20 | ⚠️ Extreme Fear |
Two indicators in extreme fear, but with opposite implications:
- Breadth extreme fear: Market internals deteriorating — real selling pressure
- Junk bond extreme fear: Credit spreads too tight — excessive optimism, not panic
Divergence Signals
Key Divergence: Market Momentum (73.4) vs Breadth (17.0)
- S&P 500 near highs (7500+), but A/D line deeply negative
- Classic “few large caps holding up the index” pattern
- Historically, when momentum is high + breadth extremely low, markets are often topping
VIX (50.0) vs Breadth (17.0)
- VIX neutral — market not pricing volatility risk
- But breadth already in extreme fear
- Market has NOT yet priced in the coming volatility
Trend Assessment
Range Duration
- Fear zone: 12 consecutive sessions (since Jun 5)
- Dropped from Greed without transition
- Failed to break above 40 multiple times
Turning Indicators
- Bottomed at 26.9 on Jun 10 (near Extreme Fear)
- Bounced to 41.6 (Jun 15), then faded
- Current 37.3 below the 35.5 low from a week ago
- No clear reversal signal; still in downtrend
Key Observations
- Dropped from 59.4 (one month ago) to 37.3 — a 37% decline, very rapid
- 5 of 7 sub-indicators in Fear, 2 in Extreme Fear
- The sole bright spot (Market Momentum 73.4) is ironically the most dangerous — it’s a lagging indicator
🚨 Crisis Early Warning Dashboard
1. Credit Spreads
- HY OAS: 2.63% | 🟢 Normal
- IG OAS: 0.74%
- Trend: Stable vs prior day
- Analysis: OAS in normal range (<3%), credit markets haven’t signaled alarm. However, CNN FNG’s junk bond demand index at just 9.4 (Extreme Fear) shows participants are already exhibiting risk-averse behavior. Low spreads + rising caution = classic pre-storm calm.
2. Yield Curve
- 10Y-2Y Spread: +27bp | 🟢 Normal
- 10Y: 4.49% | 2Y: 4.20% | 30Y: 4.93%
- Trend: Normal positive slope
- Analysis: Yield curve is healthy, no inversion. 10Y-2Y at +27bp indicates market still has some near-term economic confidence. 30Y-10Y at +44bp, normal long-end premium. Overall rate environment is neutral.
3. Margin Debt
- Latest: $1.42T (May 2026)
- YoY Change: +8.5% (vs April)
- Status: 🔴 All-time high
- Analysis: FINRA margin debt hit $1.42 trillion in May, a new record. This is extremely dangerous — retail and institutional leverage has surpassed the 2021 bubble peak. When markets fall, forced liquidation accelerates selling, creating a “leverage stampede.”
4. IPO Count
- 2026 YTD: ~73 IPOs
- vs Same Period Last Year: Higher (2025 was ~50)
- Status: 🟡 Moderate-to-warm
- Analysis: IPO market active but not euphoric (2021 had 200+ at this point). 73 IPOs indicate strong corporate financing intent and open market windows. Normal-to-warm range.
5. Fund Flows
- 2026 YTD ETF Net Inflows: $830 billion
- Record?: Yes (ETFGI confirms all-time high)
- Status: 🔴 Euphoric
- Analysis: ETF year-to-date net inflows of $830B smash all previous records. May alone saw $185B — second highest monthly total ever. Sustained massive inflows indicate retail and institutional investors are aggressively adding exposure. This is classic “last hurrah” — when everyone is piling in, it’s often the most dangerous moment.
Comprehensive Assessment
| Signal | Status | Risk Level |
|---|---|---|
| Credit Spreads (HY OAS 2.63%) | 🟢 Normal | Low |
| Yield Curve (10Y-2Y +27bp) | 🟢 Normal | Low |
| Margin Debt ($1.42T ATH) | 🔴 All-time High | High |
| IPO Count (73) | 🟡 Moderate | Medium |
| ETF Inflows ($830B Record) | 🔴 Euphoric | High |
Overall Assessment: 2🟢 / 1🟡 / 2🔴 — Surface calm, underlying risk accumulating.
Margin debt and ETF inflows simultaneously at all-time highs mean both leverage and participation are at extreme levels. Credit spreads remain low but FNG sub-indicators show risk-averse behavior has begun. Once a trigger materializes (weaker data, geopolitical escalation), the combination of high leverage and concentrated positioning could produce rapid drawdowns.
Core Contradiction: S&P 500 at 7500+ highs, but stock price breadth (A/D line) in extreme fear territory. A handful of mega-caps hold up the index while most stocks are already declining. This is the classic pattern seen before the 2000 dot-com bust and 2007 financial crisis.
Data sources: CNN Business, FRED, FINRA, ETFGI, State Street Global Advisors, Advisor Perspectives | 2026-06-20