CNN Fear & Greed Analysis 2026-06-19
Composite index 37.5 in Fear zone; market breadth and junk bond demand at extreme fear; momentum vs breadth divergence persists
📉 Composite Index
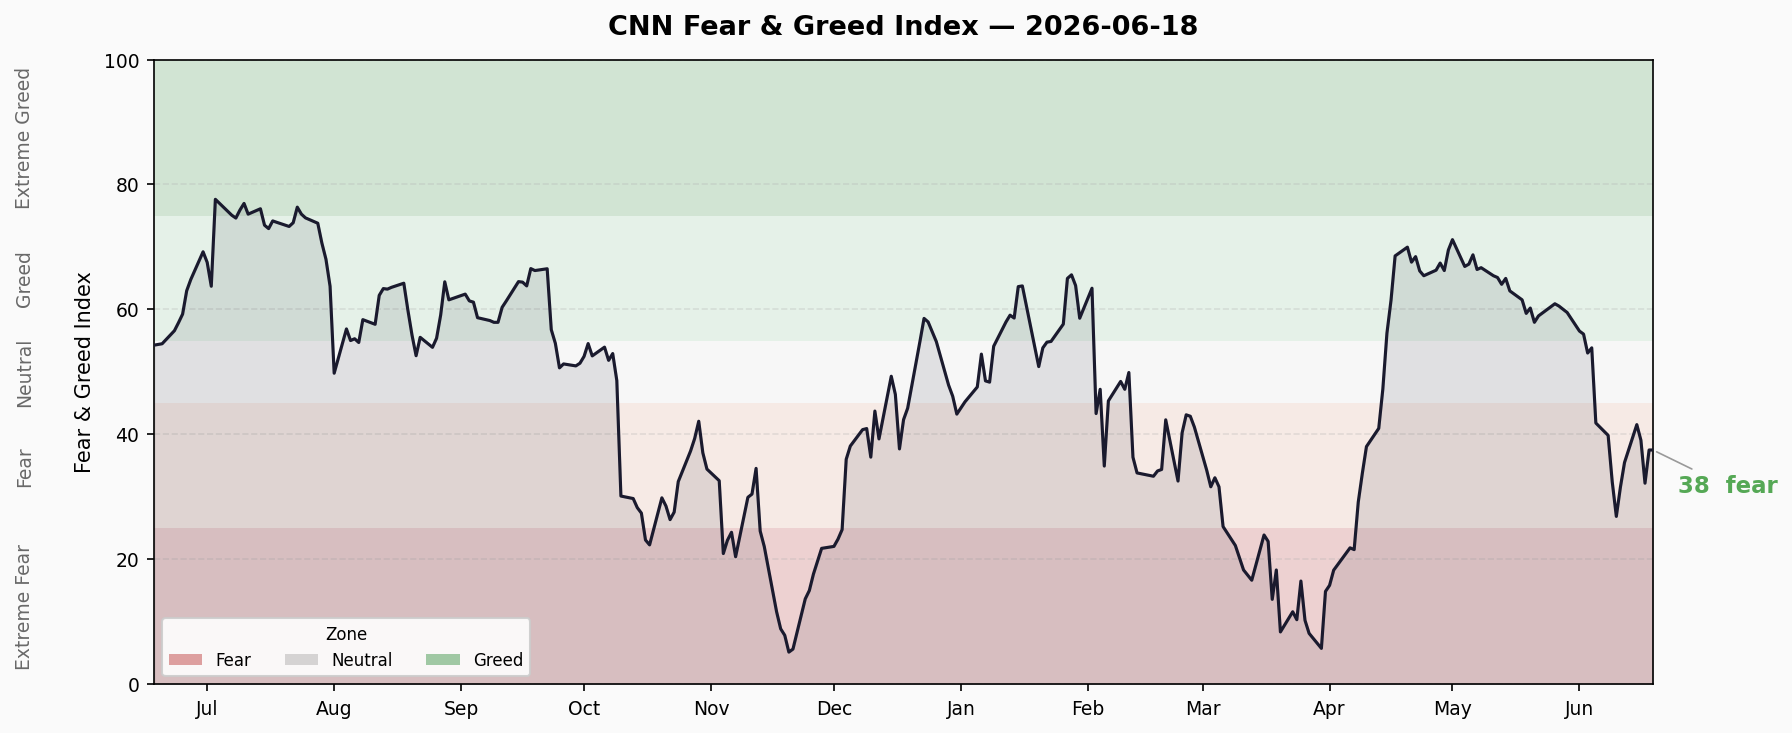
Current Reading: 37.5 / 100 — Fear
The Fear & Greed Index has been lingering in Fear territory for over two weeks, declining from ~39.9 to 37.5 over the past 10 days. No clear reversal signal has emerged.
🔍 Seven Sub-Indicators Scan
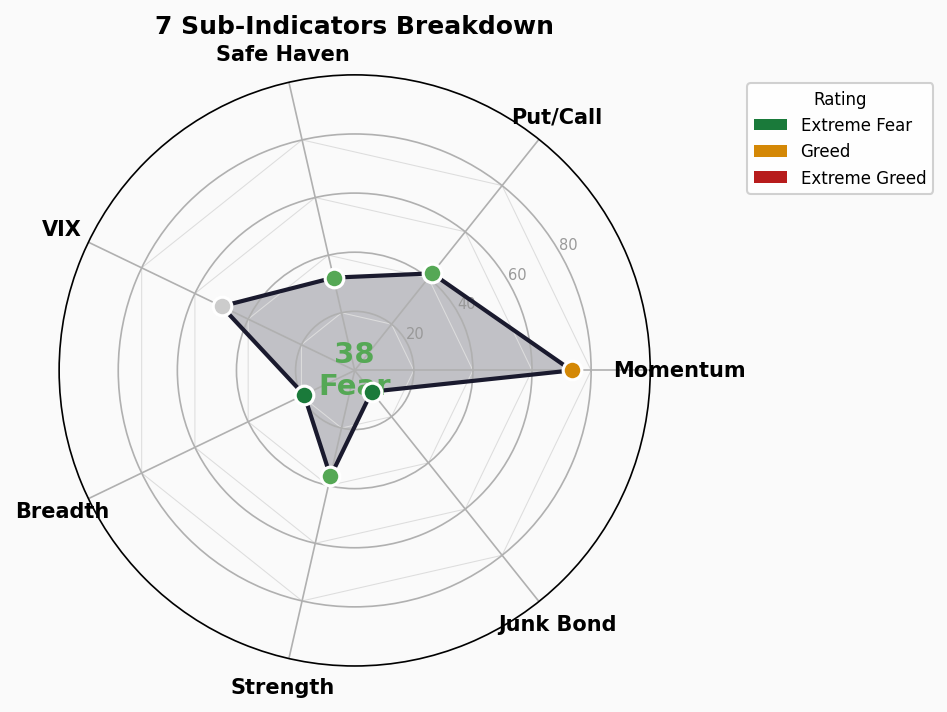
| # | Indicator | Score | Rating | Raw Value | Direction |
|---|---|---|---|---|---|
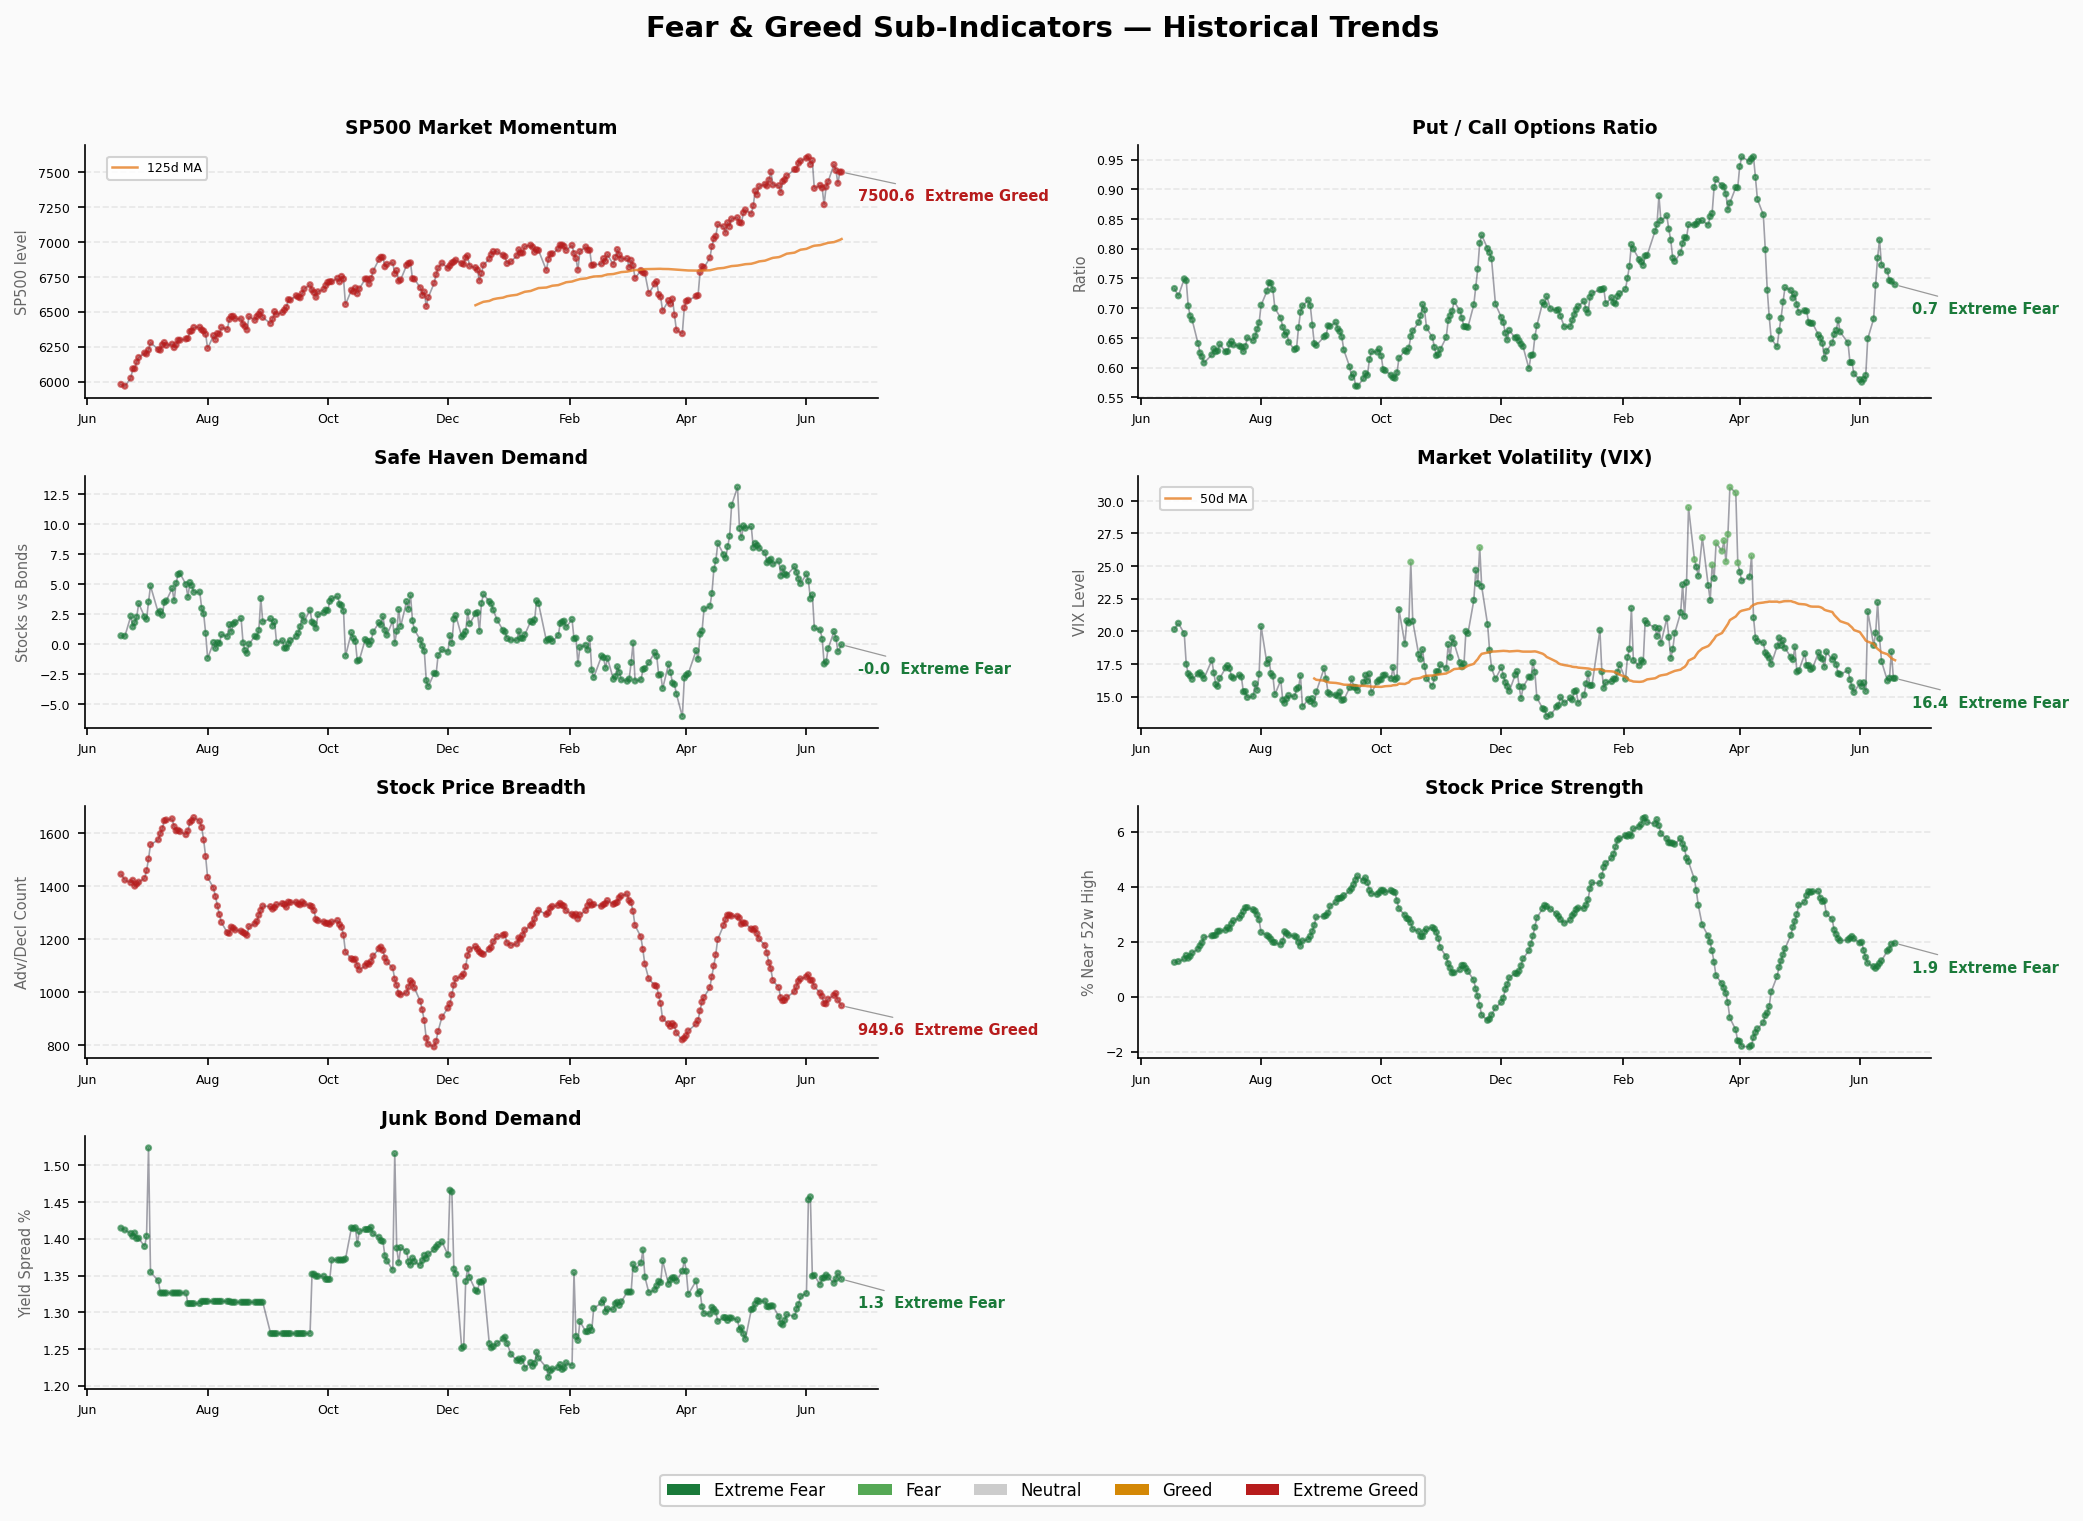
| 1 | Market Momentum (S&P500) | 73.4 | 🟡 Greed | 7,500.58 (vs 125d MA) | ↗️ Rising |
| 2 | Stock Price Strength | 36.8 | 🟡 Fear | 1.95 (New High-Low) | ↘️ Fading |
| 3 | Market Breadth | 19.0 | 🔴 Extreme Fear | 949.6 (A/D Line) | ↘️ Declining |
| 4 | Put/Call Ratio | 42.0 | 🟡 Fear | 0.739 | ↗️ Hedging up |
| 5 | Volatility (VIX) | 50.0 | ⚪ Neutral | 16.4 | → Flat |
| 6 | Junk Bond Demand | 9.2 | 🔴 Extreme Fear | 1.35 (HY OAS) | ↘️ Spreading |
| 7 | Safe Haven Demand | 32.2 | 🟡 Fear | -0.025 (Equity-Bond spread) | ↘️ Flight to bonds |
Key Readings
Market Breadth (19.0, Extreme Fear) — The most alarming signal. A/D line at 949.6 is deep in extreme fear territory. The index is rising on narrowing participation — classic “few stocks lifting the index.”
Junk Bond Demand (9.2, Extreme Fear) — The lowest score across all indicators. Credit markets have entered risk-off mode with HY OAS at 1.35%. Credit typically leads equities by 2-6 months.
Market Momentum (73.4, Greed) — S&P 500 at 7,500.58 sits well above the 125-day MA of 7,014.95. This remains the most optimistic indicator but is increasingly isolated.
⚠️ Structural Contradiction Analysis
Contradiction 1: Momentum vs Breadth
- Market Momentum (73.4, Greed) vs Market Breadth (19.0, Extreme Fear) = massive divergence
- Index rising on narrow leadership; large-caps (especially tech giants) dominate
- Historical pattern: narrow rallies are often early signals of market tops
Contradiction 2: Credit vs Equity Markets
- Junk Bond Demand (9.2, Extreme Fear) shows credit markets already in risk-off mode
- But equity momentum remains in Greed territory
- Credit markets typically lead equities by 2-6 months
Extreme Value Scan
- <20 Extreme Fear: Market Breadth (19.0), Junk Bond Demand (9.2)
- >80 Extreme Greed: None
- Current extreme count: 2 extreme fear, 0 extreme greed
🚨 Crisis Signal Dashboard
1. Credit Spreads
- HY OAS: 2.63% | 🟢 Normal
- IG OAS: 0.74%
- Trend: Spreads still low but showing early widening signs
- Analysis: Absolute levels safe (<3%), but junk bond demand indicator (9.2) signals rapidly shrinking risk appetite in credit markets. Watch for break above 3% threshold.
2. Yield Curve
- 10Y-2Y Spread: +27bp | 🟢 Normal (not inverted)
- 10Y: 4.49% | 2Y: 4.20% | 30Y: 4.93%
- Trend: Curve maintains positive slope
- Analysis: Normal curve with +27bp 10Y-2Y spread suggests low recession probability. The -44bp 10Y-30Y spread is slightly unusual, reflecting elevated long-end pricing.
3. Margin Debt
- Latest: $1.42T (May 2026, FINRA monthly)
- YoY Change: +53.7%
- Status: 🔴 All-time high
- Analysis: Consecutive monthly records (Apr $1.304T → May $1.42T, +8.5% MoM). 53.7% YoY growth indicates rapid retail leverage accumulation — a hallmark of late-stage bull markets seen in 2021.
4. IPO Activity
- 2026 YTD: ~173 (including SPACs)
- vs Prior Year: Increased (2025 Q1 had only 22 traditional IPOs)
- Status: 🟡 Warm to hot
- Analysis: IPO pace is moderate but accelerating. Not yet at 2020-21 overheating levels (480+/year). Watch for SPAC surge signals.
5. Fund Flows
- 2026 YTD ETF Net Flows: ~$830B (as of 5/29, State Street)
- Record: Yes — fastest inflow pace on record
- Status: 🔴 Frenzied
- Analysis: 2026 ETF inflow speed is historically unprecedented. Active ETF Q1 inflows hit $245B (+70% YoY), May alone saw $70B in active ETF inflows (new monthly record). Capital is flooding in at an extraordinary pace.
Summary Assessment
| Signal | Status | Danger Level |
|---|---|---|
| Credit Spreads | Normal but widening | 🟡 Medium |
| Yield Curve | Normal | 🟢 Low |
| Margin Debt | All-time high | 🔴 High |
| IPO Activity | Warm to hot | 🟡 Medium |
| Fund Flows | Record frenzy | 🔴 High |
Overall: 2🟢 / 2🟡 / 2🔴 — Market leverage and fund inflows in danger zone, but credit spreads and yield curve haven’t emitted crisis signals yet. Current risk level is “elevated warning,” not “imminent crisis,” but the marginal trajectory is deteriorating.
Risk Assessment
Risk Level: 🟡 Elevated Warning
The market displays classic late-stage bull characteristics:
- Index rising on narrowing breadth (few stocks lifting the index)
- Margin debt and ETF inflows at all-time highs (leverage + FOMO)
- Credit markets beginning to tighten (junk bond demand extreme fear)
- Momentum factors extremely effective while value factors fail (one-sided market)
Vigilant but not panicked: Credit spreads and yield curve remain in safe zones — still some distance from true crisis signals. However, extreme leverage and fund flow levels mean that once a catalyst appears, the correction could be sharp.
Key monitoring points:
- HY OAS breaking above 3%
- Margin debt growth deceleration
- Market breadth stabilizing
- Momentum factor ICIR declining from current extremes