CNN Fear & Greed Analysis 2026-06-18
Composite index 32.66 Fear; junk bond demand at extreme low (5.4); market breadth only 21.4%; margin debt $1.42T at record
CNN Fear & Greed Analysis — 2026-06-18
Composite Index
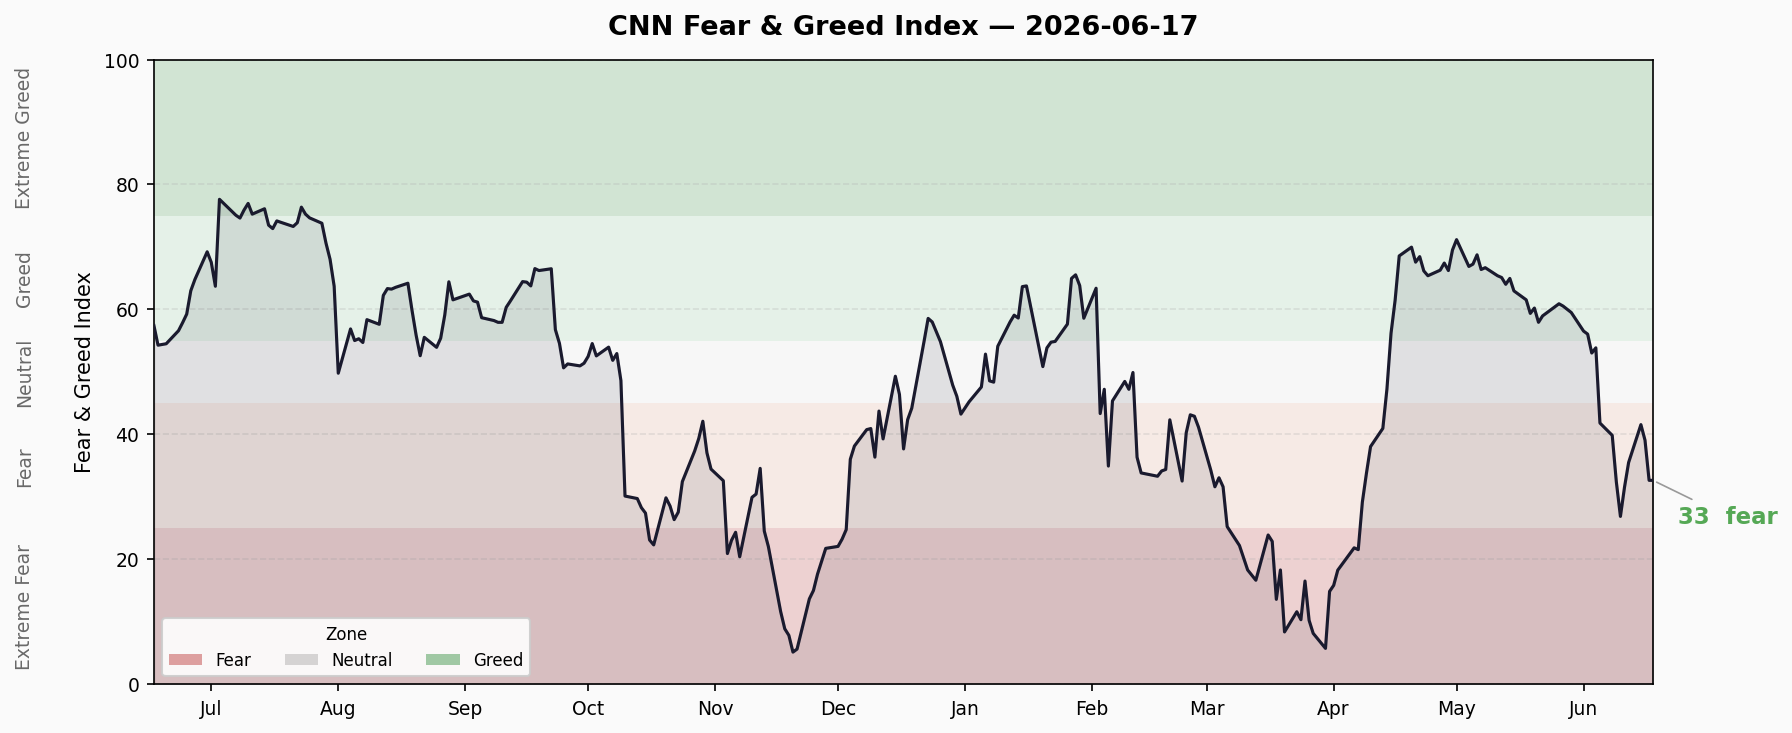
Current Reading: 32.66 — Fear
| Timeframe | Reading | Change |
|---|---|---|
| Current | 32.66 | — |
| Previous Close | 39.29 | ⬇ -6.63 |
| 1 Week Ago | 26.89 | ⬆ +5.77 |
| 1 Month Ago | 62.97 | ⬇ -30.31 |
| 1 Year Ago | 57.43 | ⬇ -24.77 |
Trend: Composite index plummeted from Greed (62.97) to Fear (32.66) over the past month. Last 10 trading days oscillated violently between 26.89–41.83 with a downward bias. Sentiment has completed a rapid regime shift from greed to fear.
7 Sub-Indicators
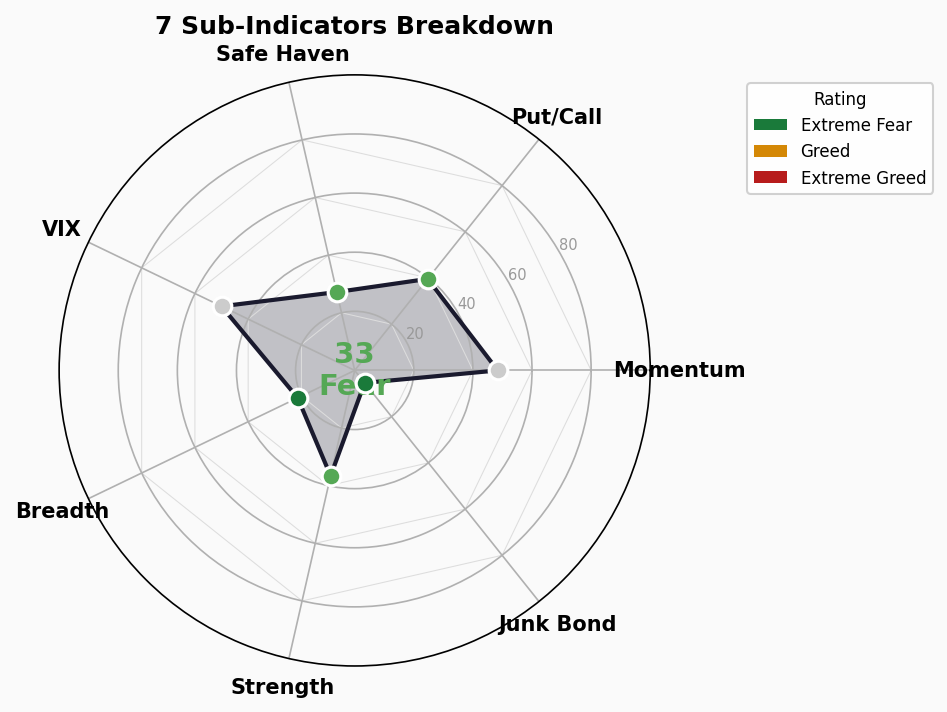
| # | Indicator | Score | Rating | Direction |
|---|---|---|---|---|
| 1 | Market Momentum (S&P 500) | 48.4 | ⚪ Neutral | S&P at 7,420 near 125-day MA, momentum fading |
| 2 | Stock Price Strength | 36.6 | 🟡 Fear | New highs declining, new lows increasing |
| 3 | Stock Price Breadth | 21.4 | 🔴 Extreme Fear | Only ~21% of stocks advancing, severe market divergence |
| 4 | Put/Call Options | 39.6 | 🟡 Fear | Put activity rising, hedging demand elevated |
| 5 | Market Volatility (VIX) | 50.0 | ⚪ Neutral | VIX in neutral zone, no panic spike yet |
| 6 | Junk Bond Demand | 5.4 | 🔴 Extreme Fear | Investors fleeing high-yield bonds; credit Risk-Off confirmed |
| 7 | Safe Haven Demand | 27.2 | 🟡 Fear | Clear flight to treasury bonds |
Structural Divergence Analysis
⚠️ Core Divergence: High Index vs. Frozen Credit
This is the most concerning signal in today’s market:
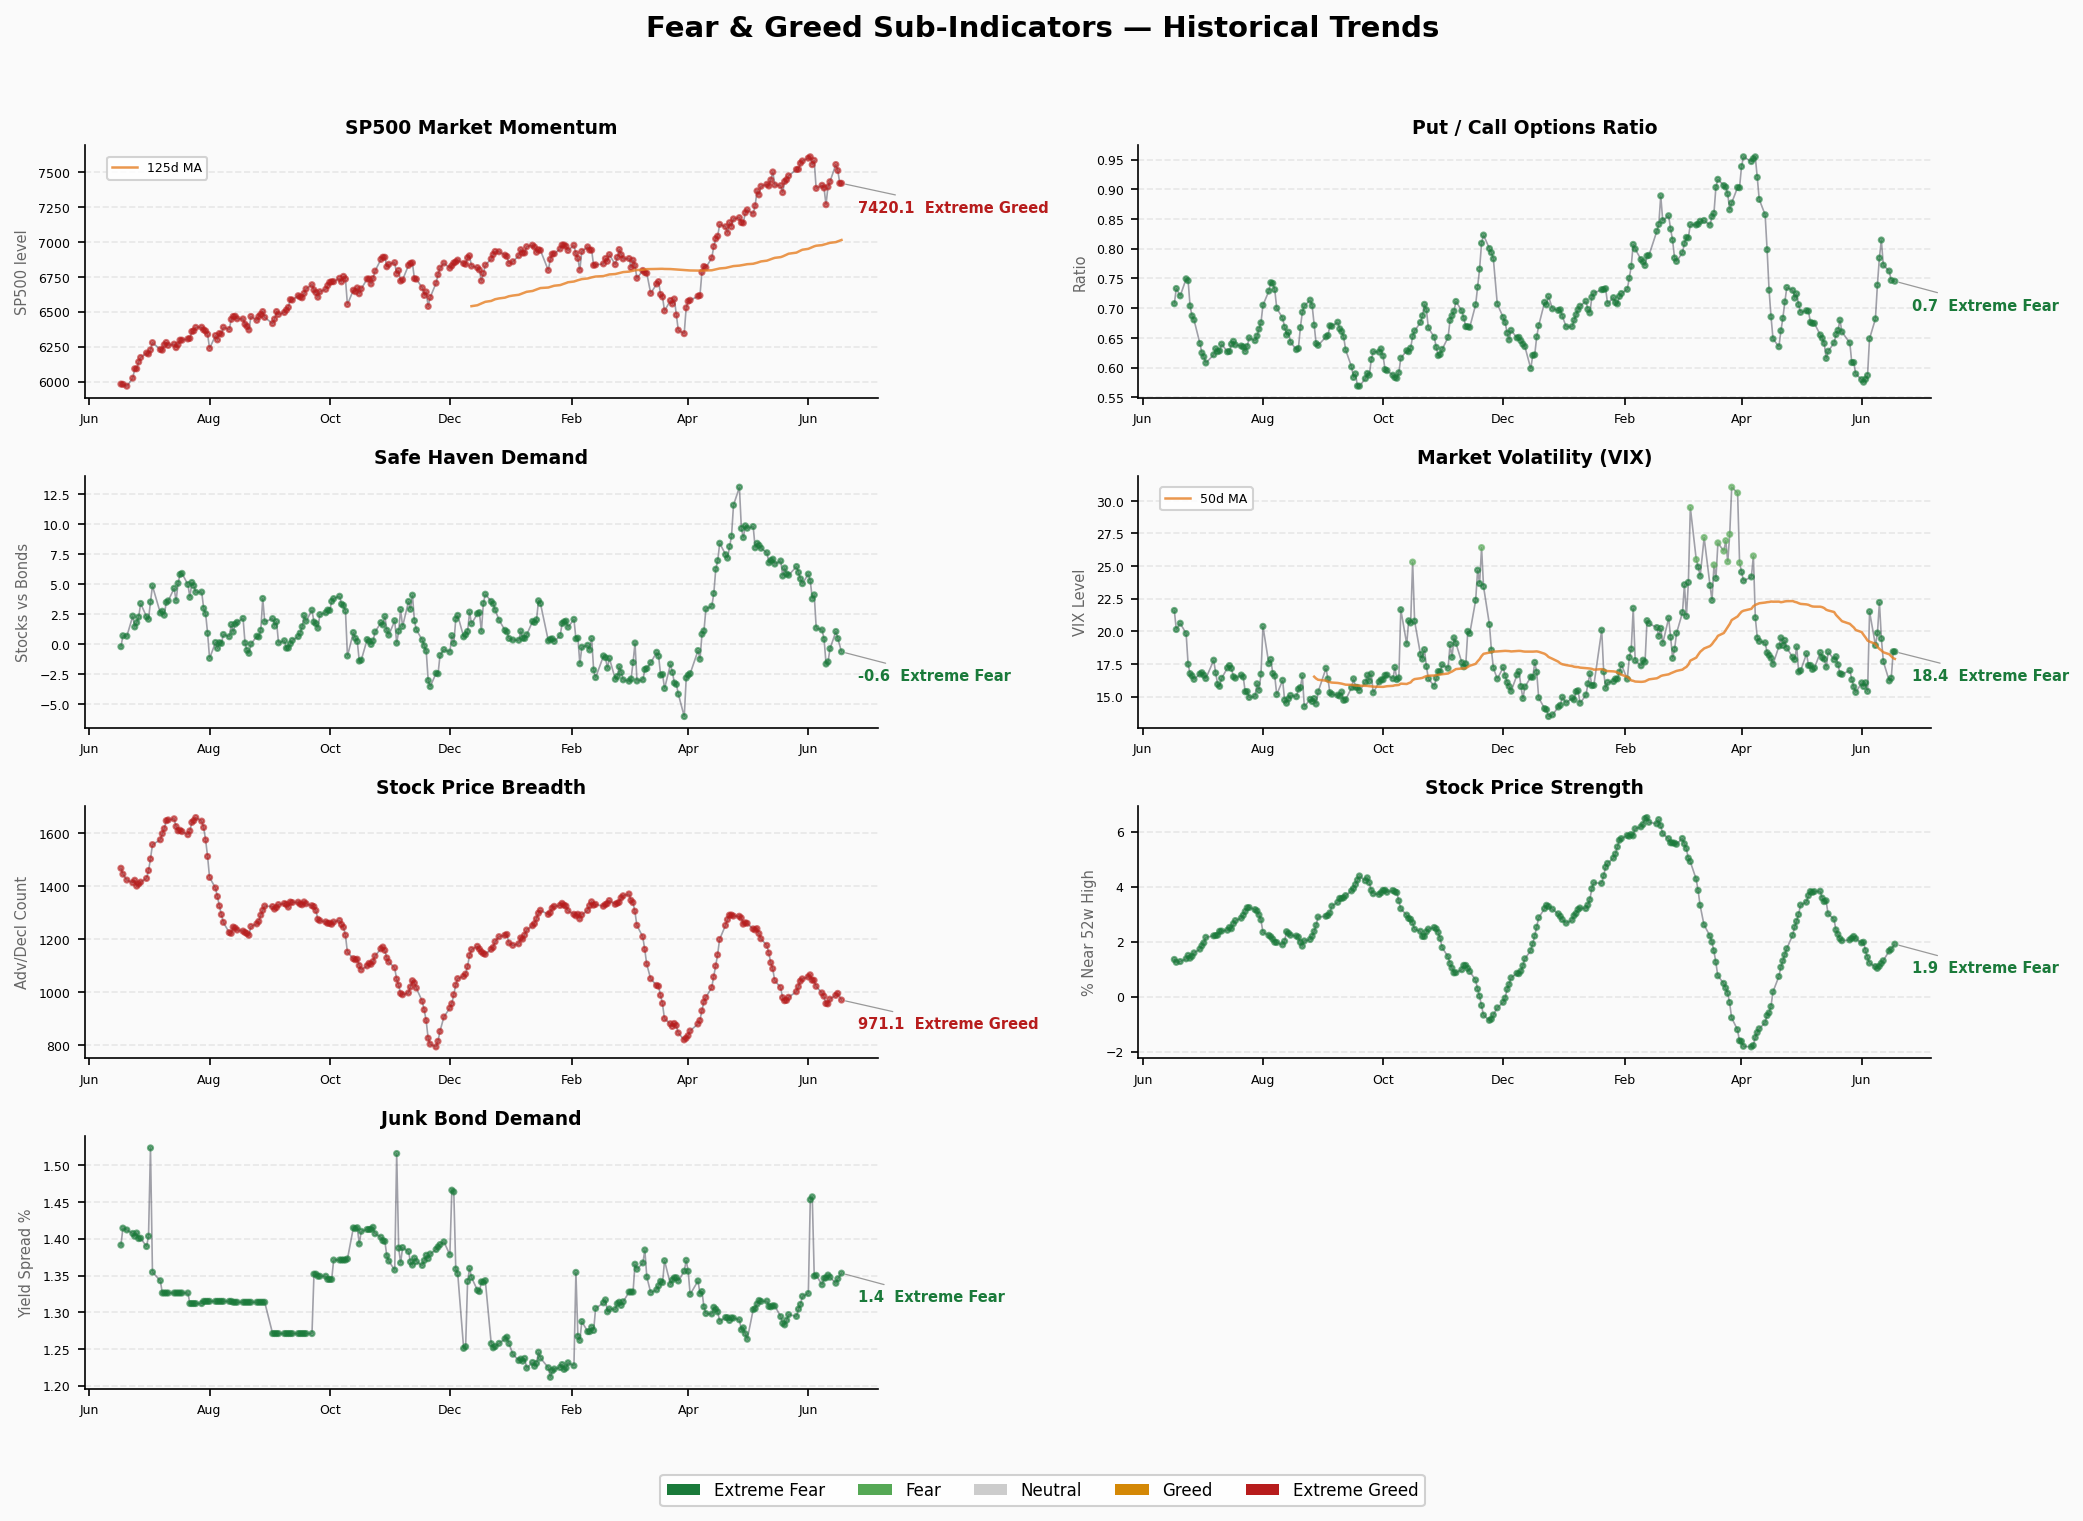
S&P 500 still near 7,420 (market momentum 48.4 neutral), yet junk bond demand at just 5.4 (extreme fear). Equities appear fine on the surface, but credit markets are already pricing in recession risk.
Market breadth 21.4 (extreme fear) — ~79% of stocks are declining. This is a textbook “Narrow Market” pattern, historically a precursor to broader selloffs.
Put/Call 39.6 + Safe Haven 27.2 both in fear territory — investors hedging tail risk, rotating from equities to treasuries.
VIX still neutral (50) — the last indicator not yet signaling fear. If VIX breaks higher, panic could accelerate.
Divergence Summary: Credit markets (junk bonds) and breadth indicators are screaming “danger,” but index and VIX haven’t fully reflected it. This “leading indicators lead, lagging indicators follow” pattern typically means the market is in early stages of a selloff or on the verge of one.
Trend Assessment
- Range Duration: Composite has been in Fear territory for 12 consecutive trading days since breaking below 50 on June 2. Hasn’t yet reached Extreme Fear (<25).
- Turning Points: Briefly touched 26.89 last week (near Extreme Fear), then bounced to 32.66, but failed to reclaim 40. Weak bounce = weak recovery.
- Year-over-Year: Last year 57.43 (Greed), today 32.66 (Fear) — market sentiment completed a full greed-to-fear cycle in 12 months.
🚨 Crisis Precursor Dashboard
1. Credit Spreads
- High Yield OAS: 2.71% | 🟢 Normal
- Investment Grade OAS: 0.75%
- Trend: Stable, no significant widening
- Analysis: Credit spreads haven’t breached the 3% warning level, but junk bond demand is extremely low (FNG sub-indicator 5.4) — may foreshadow imminent spread widening.
2. Yield Curve
- 10Y-2Y Spread: +29bp | 🟢 Normal (flat)
- 10Y: 4.43% | 2Y: 4.05% | 30Y: 4.93%
- Trend: Curve positive but flat
- Analysis: No inversion; elevated long-end reflects inflation expectations. 10Y-30Y at -50bp signals weak confidence in long-term growth.
3. Margin Debt
- Latest: $1.42T (May 2026) — 🔴 All-Time Record
- YoY Change: +53.7%
- MoM Change: +8.5% (second consecutive monthly increase)
- Status: 🔴 Extremely overheated
- Analysis: Margin debt at $1.42T all-time high with 53.7% YoY surge. Leverage far exceeds the 2021 bubble peak. Forced liquidation risk on any market decline is extreme. This is the most dangerous precursor indicator right now.
4. IPO Count
- 2026 YTD: ~73 (Renaissance Capital, ≥$50M market cap)
- vs. Prior Year: -21.5%
- Status: 🟢 Normal / subdued
- Analysis: IPO count declining, not overheating. Far below the 2021 frenzy of 1,035 IPOs. Primary market not signaling excess.
5. Fund Flows
- 2026 YTD ETF Net Inflows: ~$843.2B (through May)
- Record Pace: Yes — on track to breach $1T by late June
- May Monthly Inflows: $199.4B (second-highest month ever)
- Status: 🔴 Frenzied
- Analysis: Capital flooding into ETFs at record pace. Active ETFs alone at $320B YTD, tracking for a $700B annual record. Fixed income ETFs surged to 30% of May flows ($60.3B). Liquidity conditions extremely loose.
Composite Assessment
| Signal | Status | Danger |
|---|---|---|
| Credit Spread (HY OAS) | 2.71% Normal | 🟢 |
| Yield Curve (10Y-2Y) | +29bp Flat | 🟢 |
| Margin Debt | $1.42T ATH | 🔴 |
| IPO Count | 73 subdued | 🟢 |
| Fund Flows | $843B record | 🔴 |
Overall: 2 🟢 / 0 🟡 / 3 🔴 — Elevated Risk
Margin debt at all-time highs + ETF inflows at record pace + FNG junk bond demand at extreme lows (5.4) — triple convergence pointing to the same conclusion: market leverage and liquidity are overheated, while credit markets are already pricing in risk. Credit spreads and yield curve haven’t deteriorated yet, but these are lagging indicators — by the time they flash red, it’s usually too late.
Two key trigger factors to monitor:
- VIX breaking higher (currently neutral; once panic spreads, decline accelerates)
- HY OAS breaking 3% (credit spread widening would trigger a leverage liquidation spiral)
Sources: CNN Fear & Greed Index, FRED, FINRA, Renaissance Capital, State Street, FactSet | Generated: 2026-06-18 06:30 CST