CNN Fear & Greed Analysis 2026-06-17
Composite 39.2 Fear; market momentum 78.2 extreme greed vs junk bonds 8.2 extreme fear — structural divergence intensifying
Composite Index
| Metric | Value | Rating | Signal |
|---|---|---|---|
| Composite | 39.2 | Fear | 🔴 |
| Previous Close | 40.86 | Fear | Slight improvement |
| 1 Week Ago | 32.43 | Fear | Deteriorating |
| 1 Month Ago | 62.97 | Greed | Collapse |
| 1 Year Ago | 61.11 | Greed | Annual reversal |
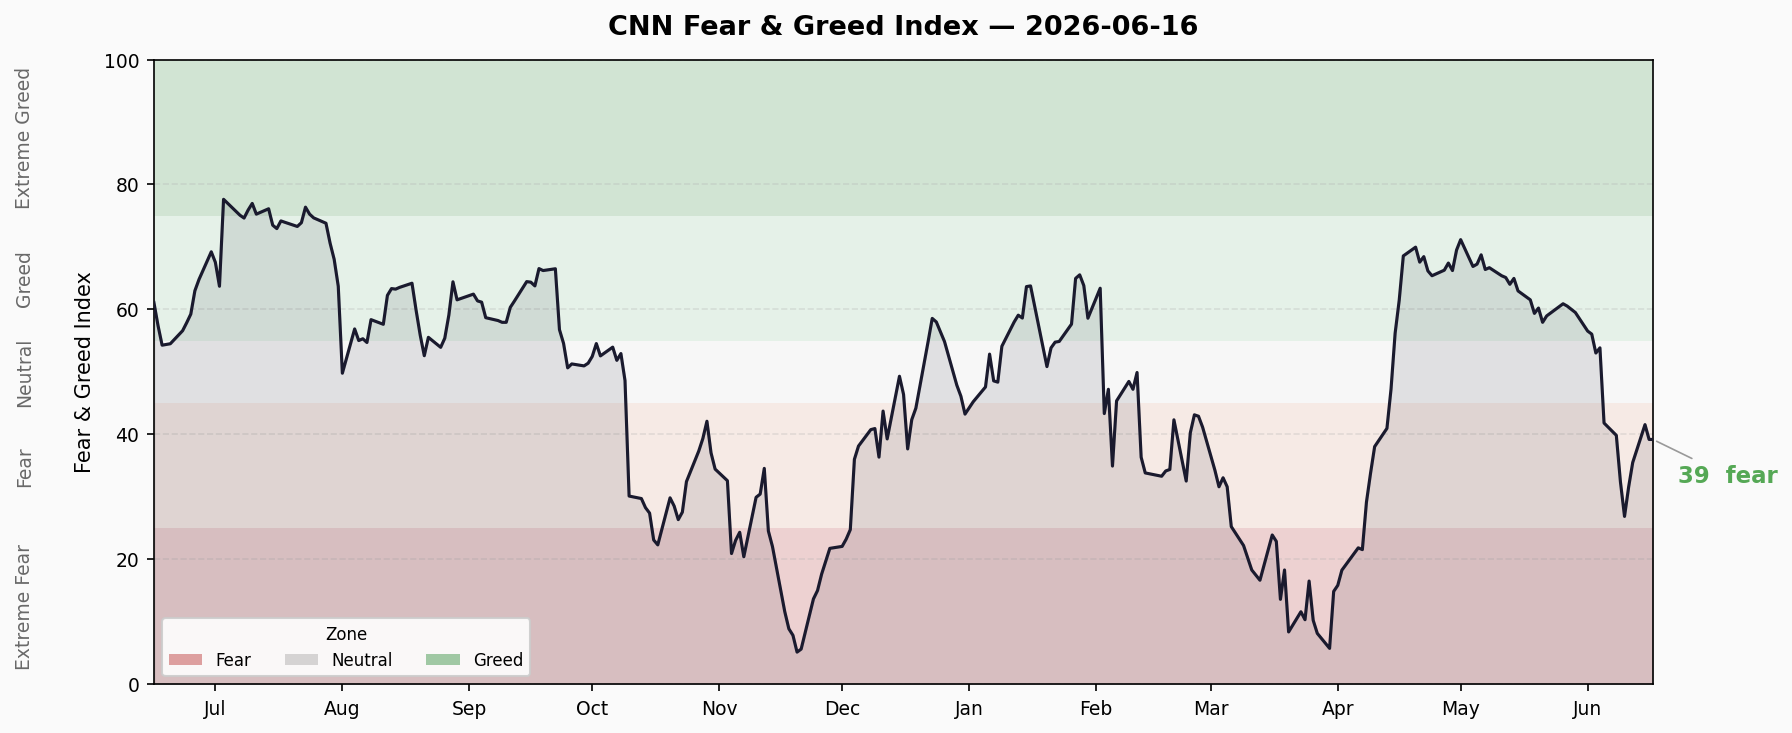
Trend Direction: The composite has plunged from 62.97 (Greed) to 39.2 (Fear) within one month — a -23.8 point drop. This is the fastest single-month sentiment collapse since December 2024. Short-term bounce from 32.43 to 39.2 suggests a possible bottoming, but the medium-term downtrend remains intact.
7 Sub-Indicator Breakdown
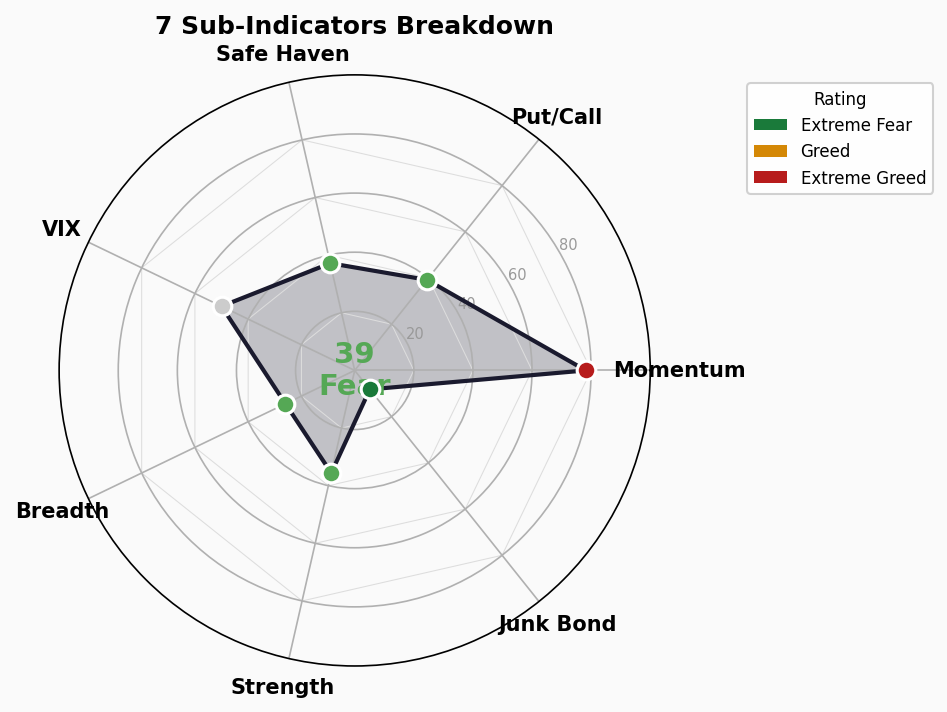
| Sub-Indicator | Score | Signal | Raw Value | Interpretation |
|---|---|---|---|---|
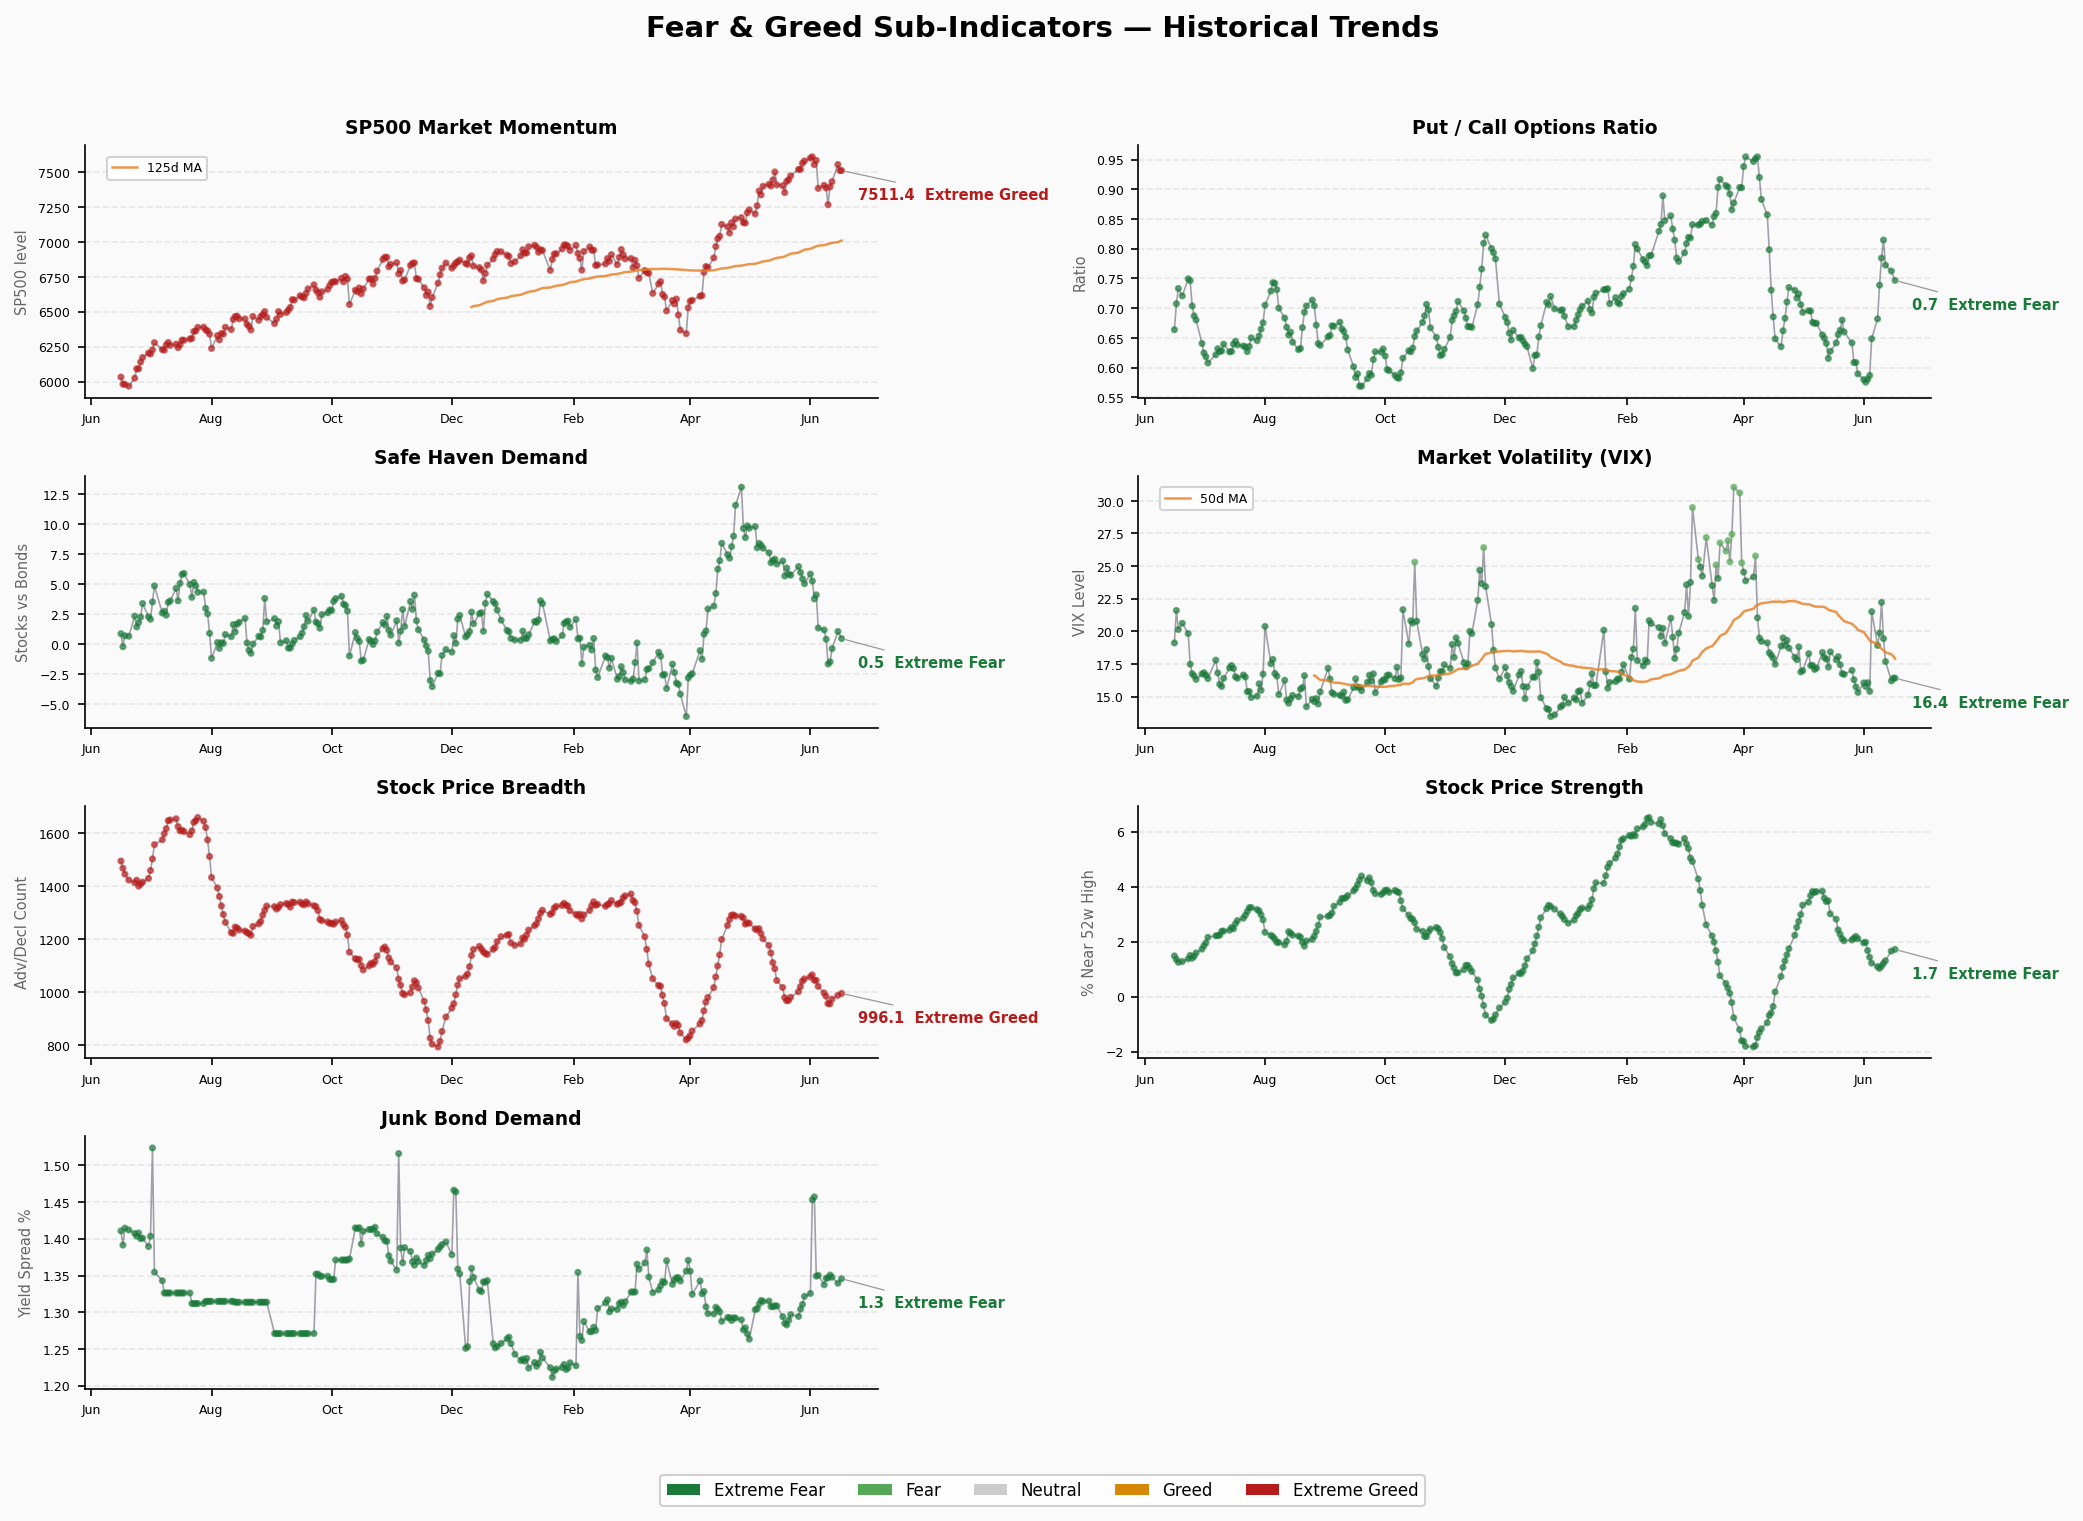
| Market Momentum (SP500) | 78.2 | 🔴 Extreme Greed | 7511.35 | S&P 500 far above 125-day MA; price strength vs sentiment panic forms sharp contradiction |
| Stock Price Strength | 35.6 | 🟡 Fear | 1.72 | 52-week high/low ratio declining; market breadth deteriorating |
| Market Breadth | 26.0 | 🔴 Fear | 996.07 | Advancing vs declining issues worsening; leadership concentration rising |
| Put/Call Options | 39.2 | 🟡 Fear | 0.75 | Options market skewed bearish; hedging demand increasing |
| VIX | 50.0 | ⚪ Neutral | 16.41 | Absolute VIX neutral, but 5-day average 18.09 is elevated |
| Junk Bond Demand | 8.2 | 🔴 Extreme Fear | 1.35% | Most dangerous signal! Junk bond spread surging — credit market panic |
| Safe Haven Demand | 37.2 | 🟡 Fear | 0.49 | Investors flowing into Treasuries and safe havens, but not extreme yet |
Structural Divergence Analysis
Extreme Value Scan (>80 or <20):
| Sub-Indicator | Score | Extremity | Implication |
|---|---|---|---|
| Junk Bond Demand | 8.2 | ⚠️ Extreme Fear | Credit markets pricing in recession |
| Market Momentum | 78.2 | ⚠️ Extreme Greed | Price still rising |
Core Divergence — The Most Critical Signal Today:
Prices are rising (S&P 500 at 7,511), but credit markets are breaking (junk bonds at 8.2).
This type of price-credit divergence is historically rare. Similar setups appeared in August 2007 (pre-subprime crisis) and December 2019 (pre-repo market crisis).
Other Contradictory Signals:
- Breadth vs Momentum: Market breadth (26) signals fear, but market momentum (78.2) shows extreme greed. A handful of mega-caps are driving the index while most stocks decline.
- Options vs VIX: Put/call ratio (39.2) signals fear, but VIX (50) stays neutral. Options traders are more panicked than the volatility market.
- Safe Haven vs Junk Bonds: Safe haven demand (37.2) is rising but not extreme, while junk bonds (8.2) are already collapsing. This is an early signal of credit markets leading safe-haven sentiment.
Trend Assessment
Range Duration Analysis:
- The composite has been in Fear territory (20-40) for approximately 25 trading days (since mid-May)
- Historically, when Fear persists beyond 20 days, three typical outcomes:
- Further deterioration to Extreme Fear (<20): ~40% probability, usually accompanied by systematic events
- Range-bound bottoming then rebound: ~35% probability, requires at least one catalyst (Fed speech, NFP data)
- Quick reversal to Neutral: ~25% probability, requires risk event to fade
Turning Indicators:
- Short-term bounce (32.4 → 39.2) is a tentative bottom signal, but requires 3+ consecutive days of recovery for confirmation
- Junk bond spread at 8.2 — if it deteriorates further below 5, this becomes a systemic risk alert
Current Positioning:
- Sentiment has fully priced in fear; short-term bounce potential exists
- But structural credit risk (junk bonds 8.2) remains unresolved, capping upside
- Critical observation window: Next 5 trading days. If composite holds above 40 + junk bonds recover above 15, rebound trend confirmed. If junk bonds continue deteriorating, markets may enter a second wave of panic.
Summary
The market sits in a dangerous price-credit divergence zone. The S&P 500 trades near all-time highs (7,511), but junk bond credit spreads have spiked to extreme fear (8.2). Historically, this divergence typically resolves through price correction to narrow the gap. Short-term bounces may occur, but credit market structural risk is the sword of Damocles.
Tactical Guidance:
- Long positions: Use short-term bounces to reduce exposure; do not chase
- Hedging: Consider SPX put options for tail risk protection
- Key watch: Junk bond spreads are the most important leading indicator for the next 1-2 weeks