CNN Fear & Greed Analysis 2026-06-16
Composite 40.9 in fear; extreme greed vs extreme fear divergence between momentum and breadth
Composite Index
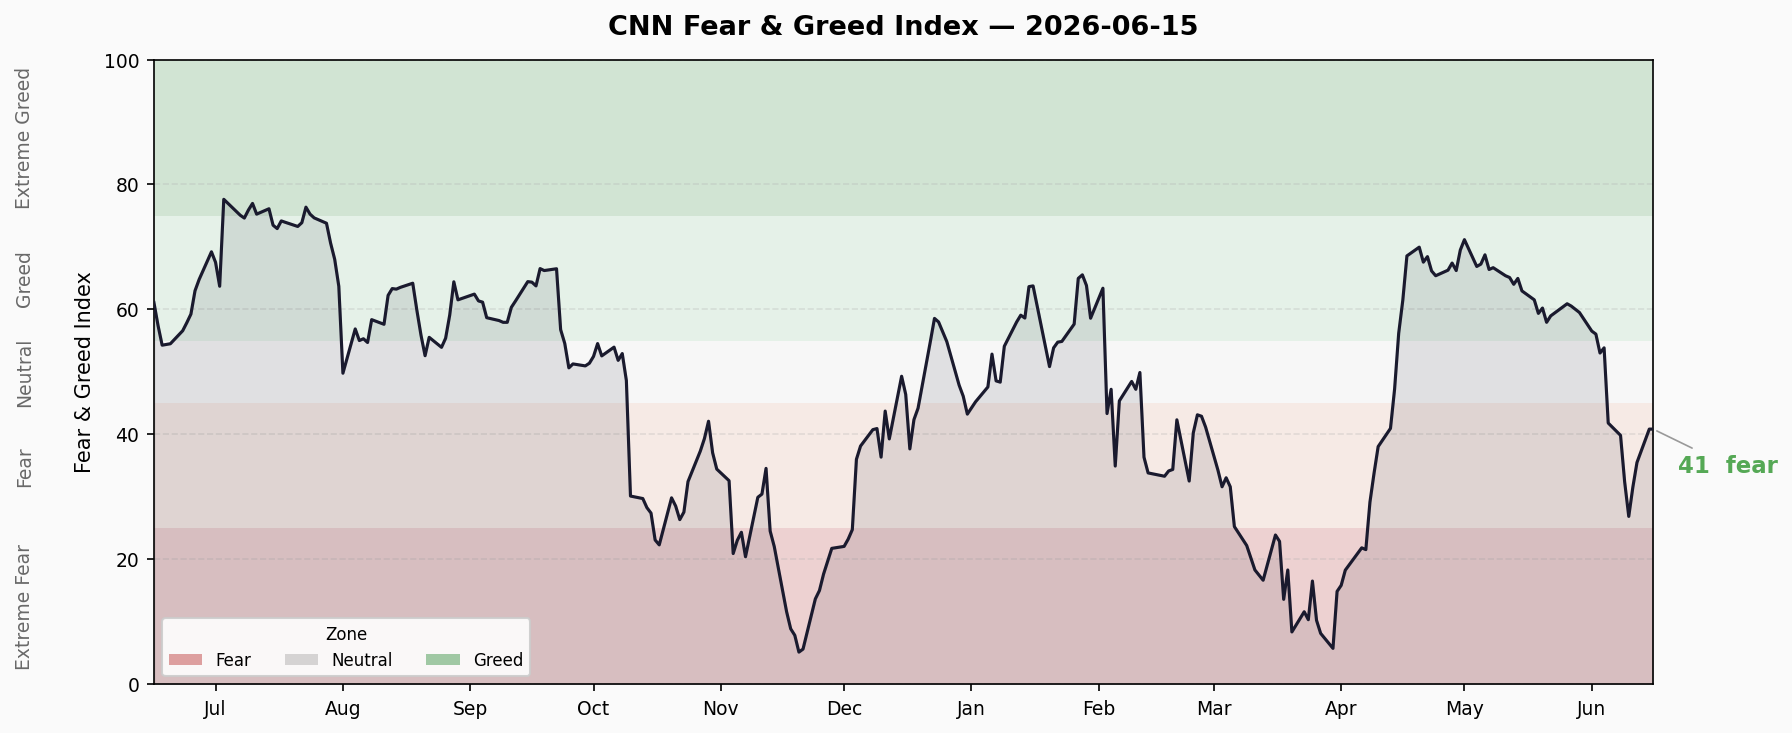
Current reading: 40.9 (Fear)
| Timeframe | Score | Rating |
|---|---|---|
| Today | 40.9 | Fear |
| Previous close | 34.0 | Fear |
| 1 week ago | 39.9 | Fear |
| 1 month ago | 63.0 | Greed |
| 1 year ago | 59.5 | Greed |
The composite has dropped 22.1 points from 63.0 (greed) one month ago. The last three sessions have oscillated between 34-41. Today bounced +6.9 from the prior close but remains in fear territory.
7 Sub-Indicators Scan
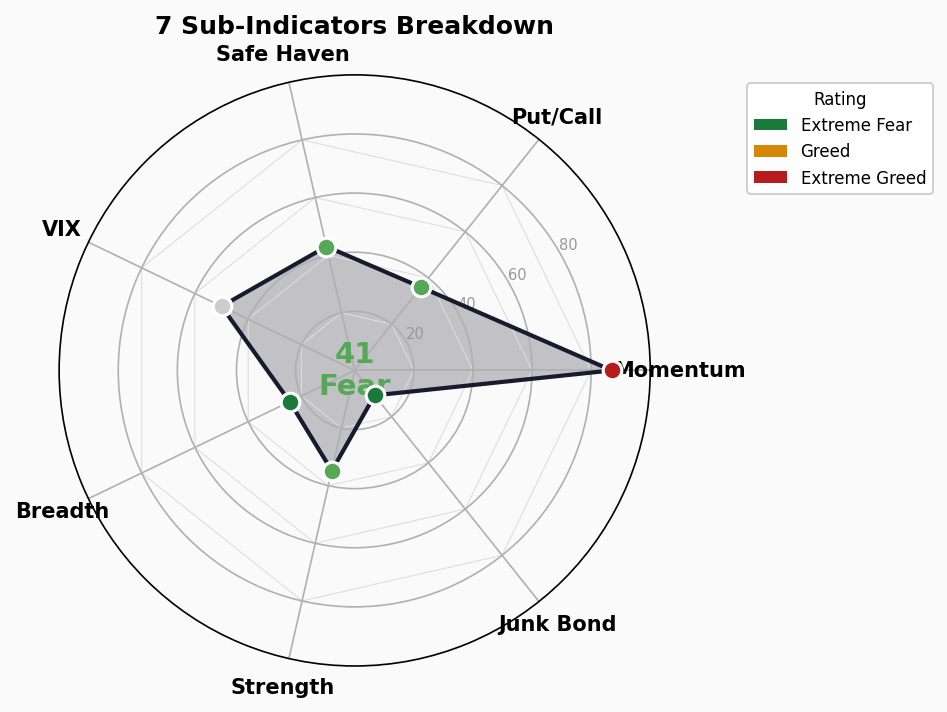
| Indicator | Score | Rating | Raw Value | Direction |
|---|---|---|---|---|
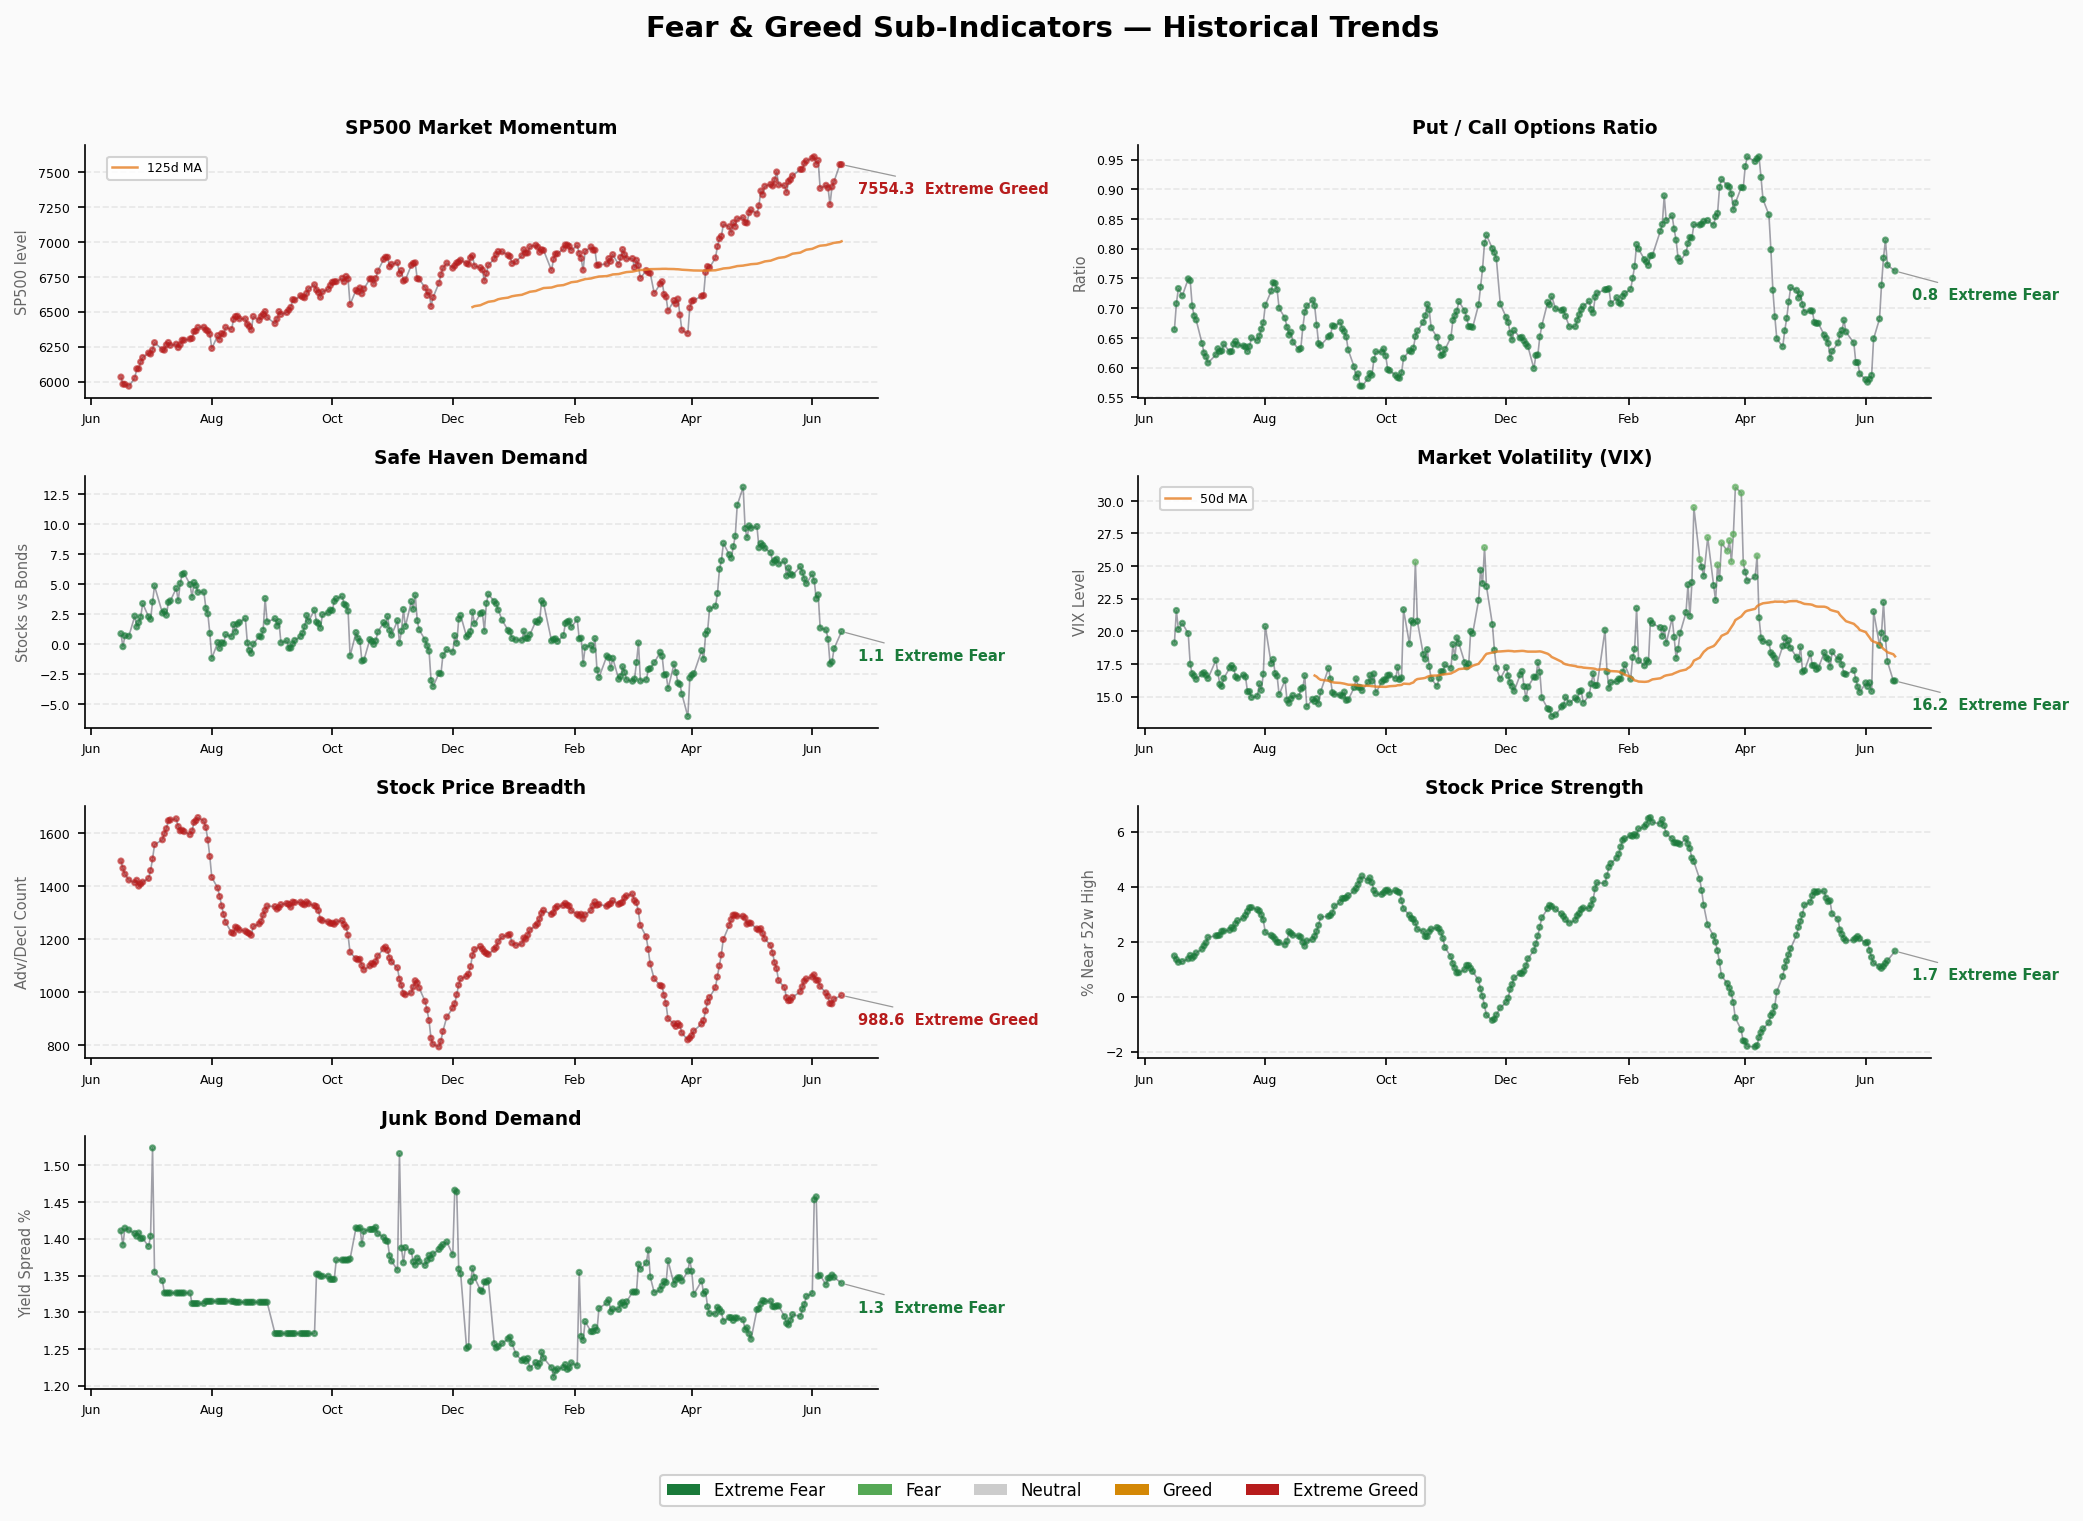
| Market Momentum (S&P500) | 87 | 🟢 Extreme Greed | 7,554.29 (above 125MA) | → Holding high |
| Stock Price Strength | 34.8 | 🔴 Fear | 52W High-Low spread 1.66% | ↓ Deteriorating |
| Stock Price Breadth | 24.4 | 🔴 Extreme Fear | AD line 988.6 | ↓ Languishing |
| Put/Call Options | 36 | 🔴 Fear | P/C ratio 0.76 | → Sideways |
| Market Volatility (VIX) | 50 | ⚪ Neutral | VIX 16.2 | → Stable |
| Junk Bond Demand | 10.8 | 🔴 Extreme Fear | Yield spread 1.34% | ↓ Historical low |
| Safe Haven Demand | 43 | 🔴 Fear | Stocks lag bonds by -7.6% | → Low & flat |
Structural Divergence Analysis
🔴 Extreme Signals (>80 or <20)
Market Momentum 87 (Extreme Greed) vs Stock Price Breadth 24.4 (Extreme Fear)
This is the core contradiction in today’s market. The S&P500 stands well above its 125-day moving average (7,554 vs ~6,000), giving an extreme greed reading on momentum. But the Advance-Decline line sits at just 988 — extreme fear territory.
Interpretation: The index is being lifted by a handful of mega-cap names (tech giants), while the majority of stocks aren’t following. This is a classic “index prosperity, individual stock divergence” pattern seen repeatedly during the 2024-2025 AI bull market. When the megacaps stop rising, breadth deterioration will accelerate declines.
Junk Bond Demand 10.8 (Extreme Fear)
The yield spread at 1.34% is at historical lows — the market is offering minimal compensation for credit risk. This typically means either:
- Extreme optimism about economic outlook (spread compression)
- Liquidity tightening distorting credit market pricing
Given VIX at just 16.2 suggesting “calm,” the extreme fear reading in junk bonds more likely reflects the latter — credit markets are already issuing warnings that risk asset prices haven’t yet priced in.
⚠️ Divergence Signals
VIX Neutral (50) + Stock Price Strength Fear (34.8)
VIX at 16.2 is at historical median — seemingly “normal.” But stock price strength (52-week high-low spread) at just 1.66% shows buying power at the individual stock level has significantly eroded. VIX reflects options market implied volatility expectations; stock price strength reflects actual trading behavior. When actual buying shrinks but implied vol hasn’t risen, the market may be in “the calm before the storm.”
Trend Assessment
Range Duration
The composite has been stuck in the fear zone for 8 consecutive trading days since breaking below 50 on June 5. This is far more persistent than the brief touch in mid-May (only 2 days).
Historical reference:
- March-April 2026 extreme fear: index lingered at 5-25 for ~6 weeks
- Then rebounded to greed zone (58-66) for ~3 weeks
- Currently in a second pullback, but hasn’t reached extreme fear levels
Turning Signals
- Positive: Previous close 34.0 → Today 40.9, single-day bounce of +6.9 points from fear zone bottom
- Negative: One month 63.0 → Today 40.9, cumulative drop of 22 points, downtrend not reversed
- Key observation: Junk bond and breadth indicators still deteriorating; internal market structure is weaker than headline index suggests
Overall Assessment
The market is in a “technical bounce within the fear zone” phase. The composite recovered from 34 to 40.9, but 5 of 7 sub-indicators remain in fear/extreme fear territory. The core divergence — extreme greed momentum vs extreme fear breadth — historically resolves through breadth repair (megacaps catching down).
Strategy implications: Fear zone windows are opportunities for contrarian positioning, but wait for structural improvement (especially junk bond spread and breadth stabilization) before sizing up. Current phase suits small left-side positions; not the time for aggressive bottom-fishing.