CNN Fear & Greed Analysis 2026-06-15
Composite at 34 (Fear), junk bond spread in extreme fear, market breadth deteriorating, panic sentiment spreading
CNN Fear & Greed Analysis — 2026-06-15
Composite Index
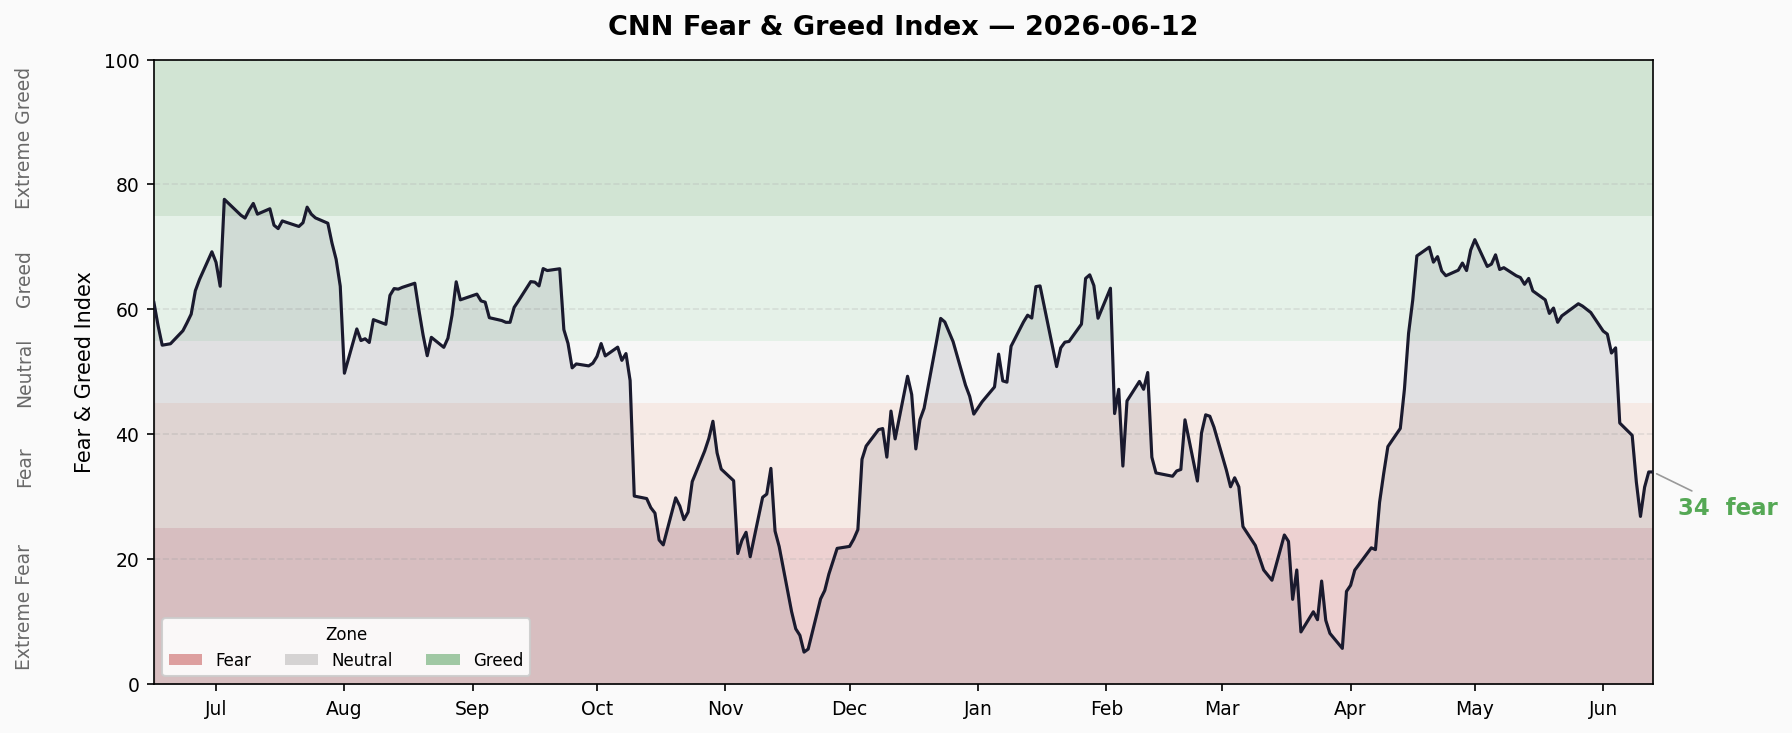
Latest: 34 (Fear) | Previous close: 29.6 | 1 week ago: 41.8 | 1 month ago: 65.1
Composite rebounded +4.4 points from the prior close but remains in fear territory. Last 10 trading days:
| Date | Score | Rating |
|---|---|---|
| Jun 02 | 56.1 | Greed |
| Jun 03 | 53.0 | Neutral |
| Jun 04 | 53.9 | Neutral |
| Jun 05 | 41.8 | Fear |
| Jun 08 | 39.9 | Fear |
| Jun 09 | 32.4 | Fear |
| Jun 10 | 26.9 | Fear |
| Jun 11 | 31.6 | Fear |
| Jun 12 | 34.0 | Fear |
| Jun 13 | 34.0 | Fear |
Trend: Declined from 56.1 (greed) on 6/2 to 26.9 (deep fear) on 6/10, then modestly rebounded to 34. Currently 8 trading days in fear zone — bottom appears to be forming but not yet escaped.
7 Sub-Indicators Scan
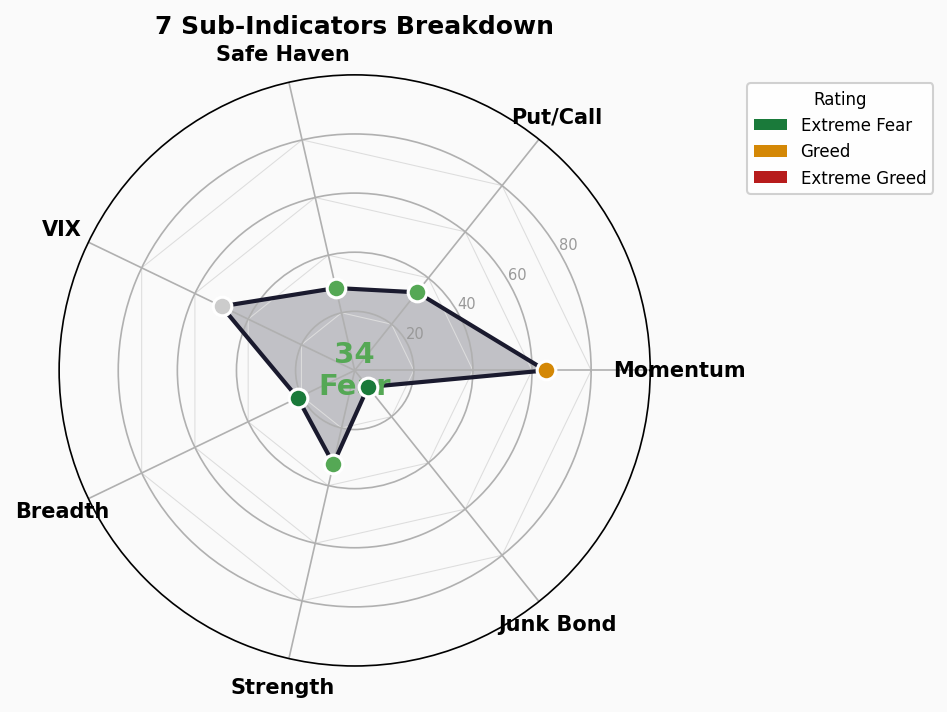
| Indicator | Score | Rating | Raw Value | Direction |
|---|---|---|---|---|
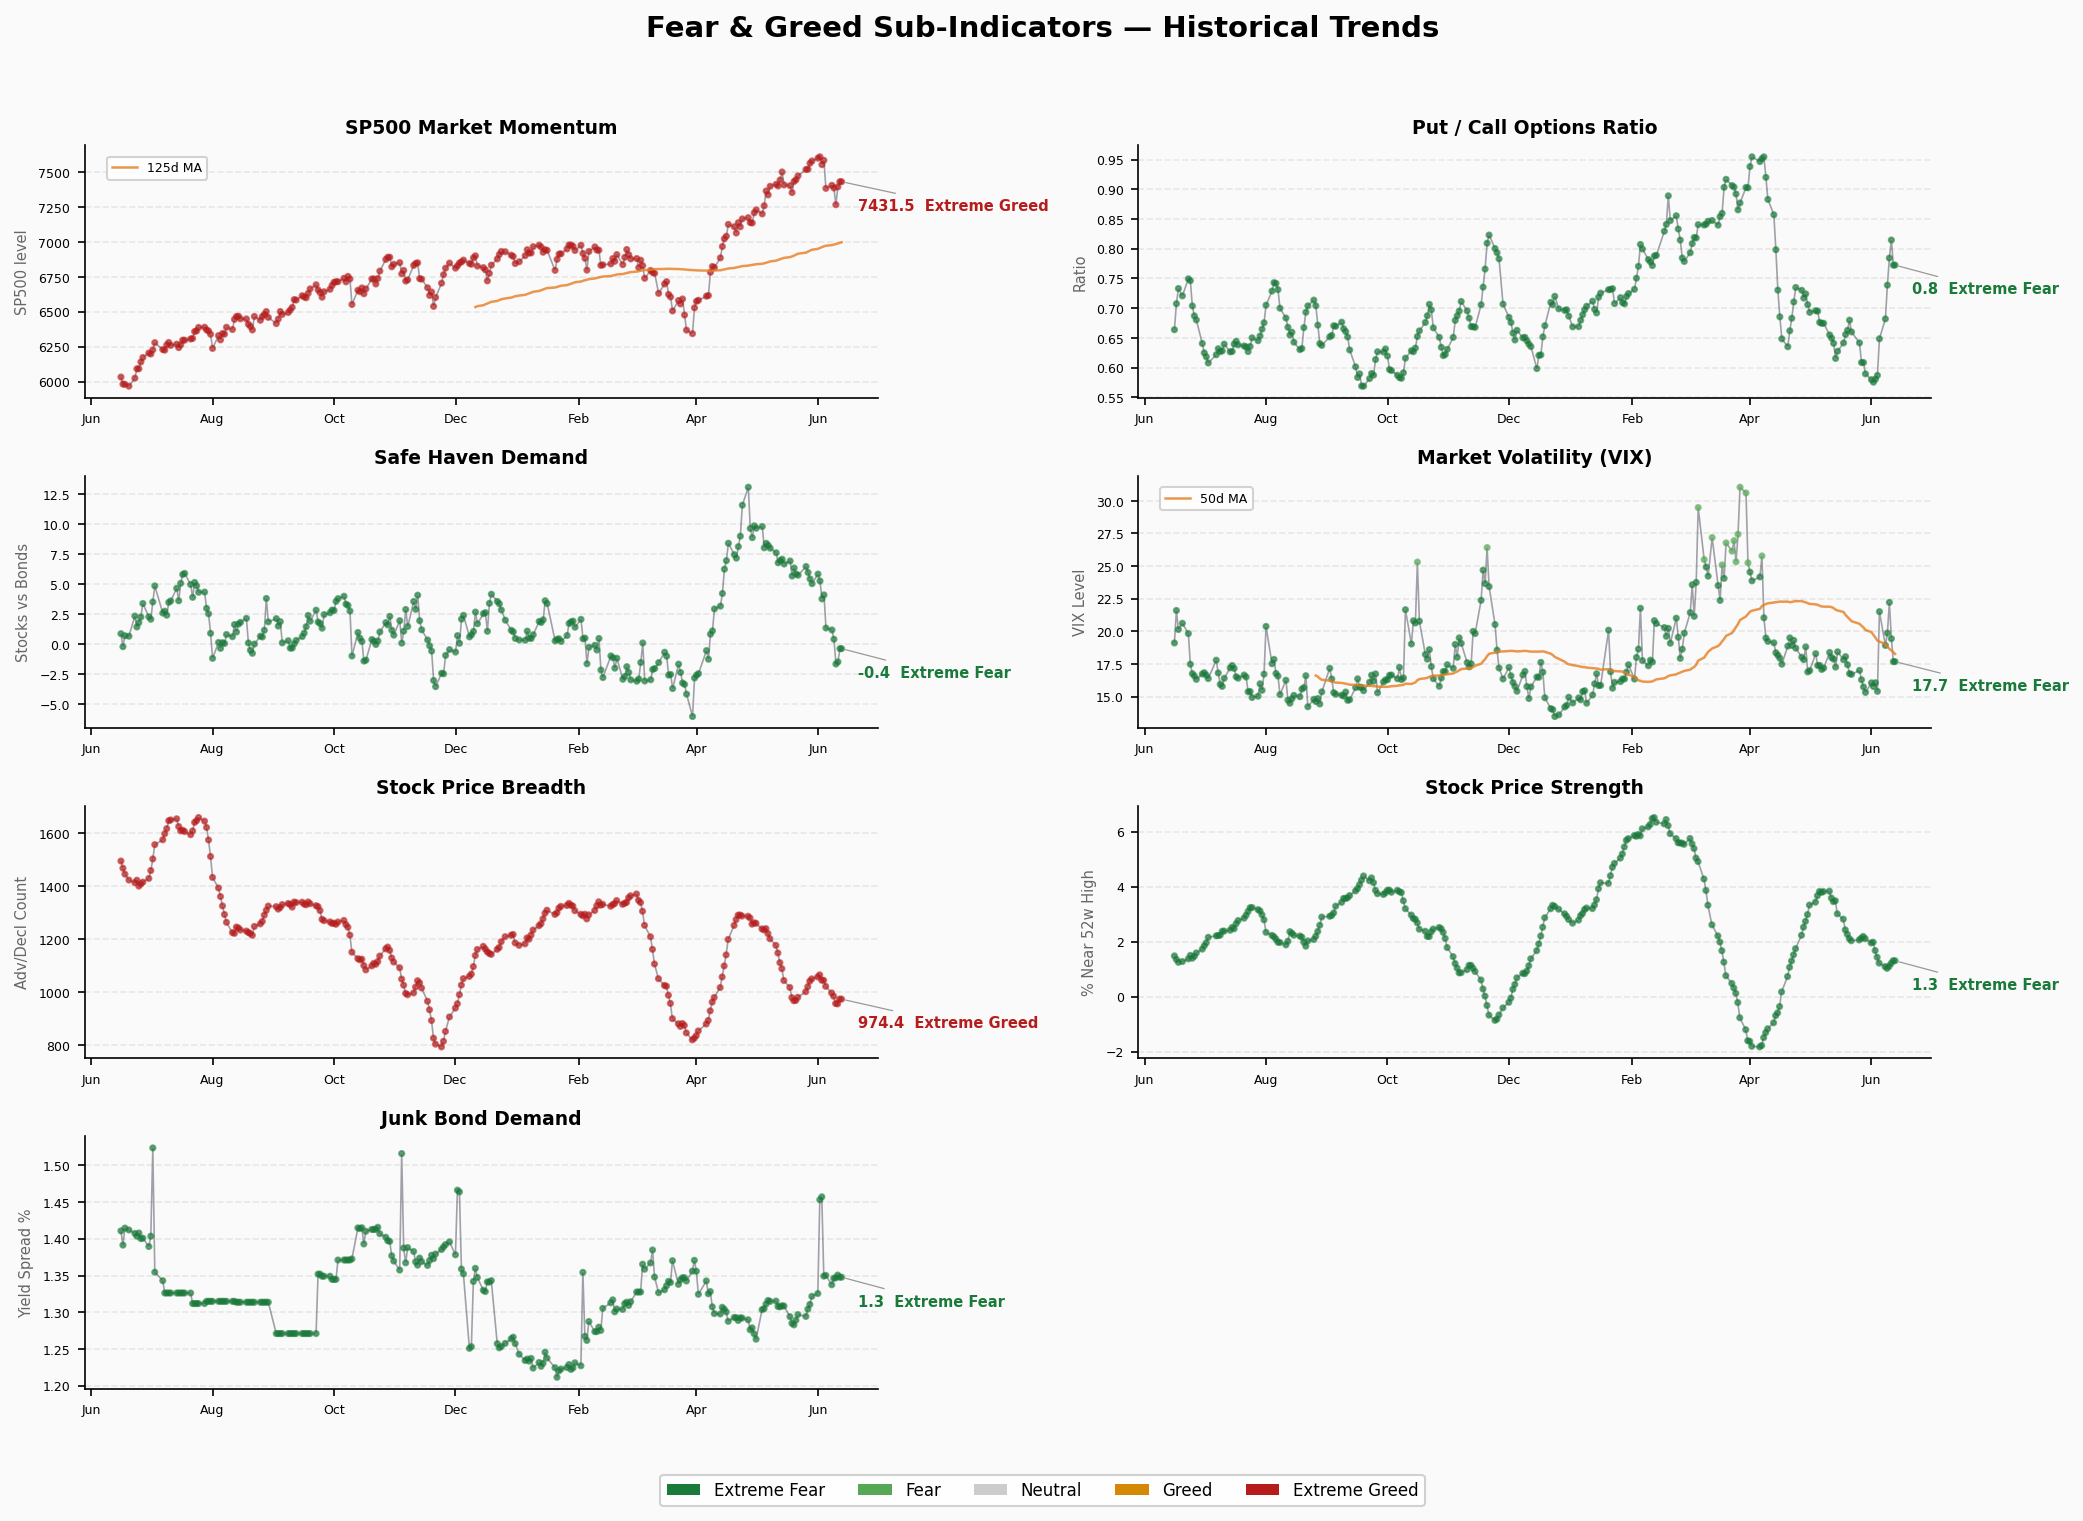
| Market Momentum (S&P 500) | 64.6 | Greed | 7,431.46 | ↑ Still elevated |
| Stock Price Strength | 32.4 | Fear | 1.31 | ↓ Persistent weakness |
| Stock Price Breadth | 21.4 | Extreme Fear | 974.42 | ↓ Severe deterioration |
| Put/Call Options | 33.8 | Fear | 0.77 | ↑ Slight recovery |
| Market Volatility (VIX) | 50.0 | Neutral | 17.68 | → Flat |
| Market Volatility (VIX 50-MA) | 50.0 | Neutral | 18.40 | → Flat |
| Junk Bond Demand | 7.2 | Extreme Fear | 1.35 | ↓ Continued deterioration |
| Safe Haven Demand | 28.6 | Fear | -0.35 | ↓ Capital flight |
Structural Divergence Analysis
Extreme Value Signals (>80 or <20):
- Junk Bond Spread at 7.2 (Extreme Fear): Credit market under severe stress, spreads widening continuously — rising default risk
- Stock Price Breadth at 21.4 (Extreme Fear): Advance/decline ratio severely imbalanced, market participation extremely narrow
Divergence Signals:
- Momentum vs Breadth severe divergence: Market momentum at 64.6 (greed) but breadth at only 21.4 (extreme fear) — a few mega-caps supporting the index while most stocks decline. Classic “index illusion” signal
- VIX neutral vs Junk Bond extreme fear: Volatility indicators not reflecting credit market panic — credit risk may be underpriced
Trend Assessment
- Zone Duration: Fear zone persisted for 8 trading days (since 6/5), bottom touched at 26.9 on 6/10 with modest rebound
- Turning Indicator: Composite bounced from 26.9 to 34 (+7.1), showing initial bottoming signal but reversal not yet confirmed
- Structural Risk: Breadth and credit at dual extremes + momentum greed = market may be at the eve of style rotation — the few heavyweight leaders’ strength is unlikely to sustain