CNN Fear & Greed Sentiment Analysis 2026-06-14
Composite at 34 enters fear zone; junk bond demand crashes to 7.2 extreme fear; price breadth collapses to 21.4
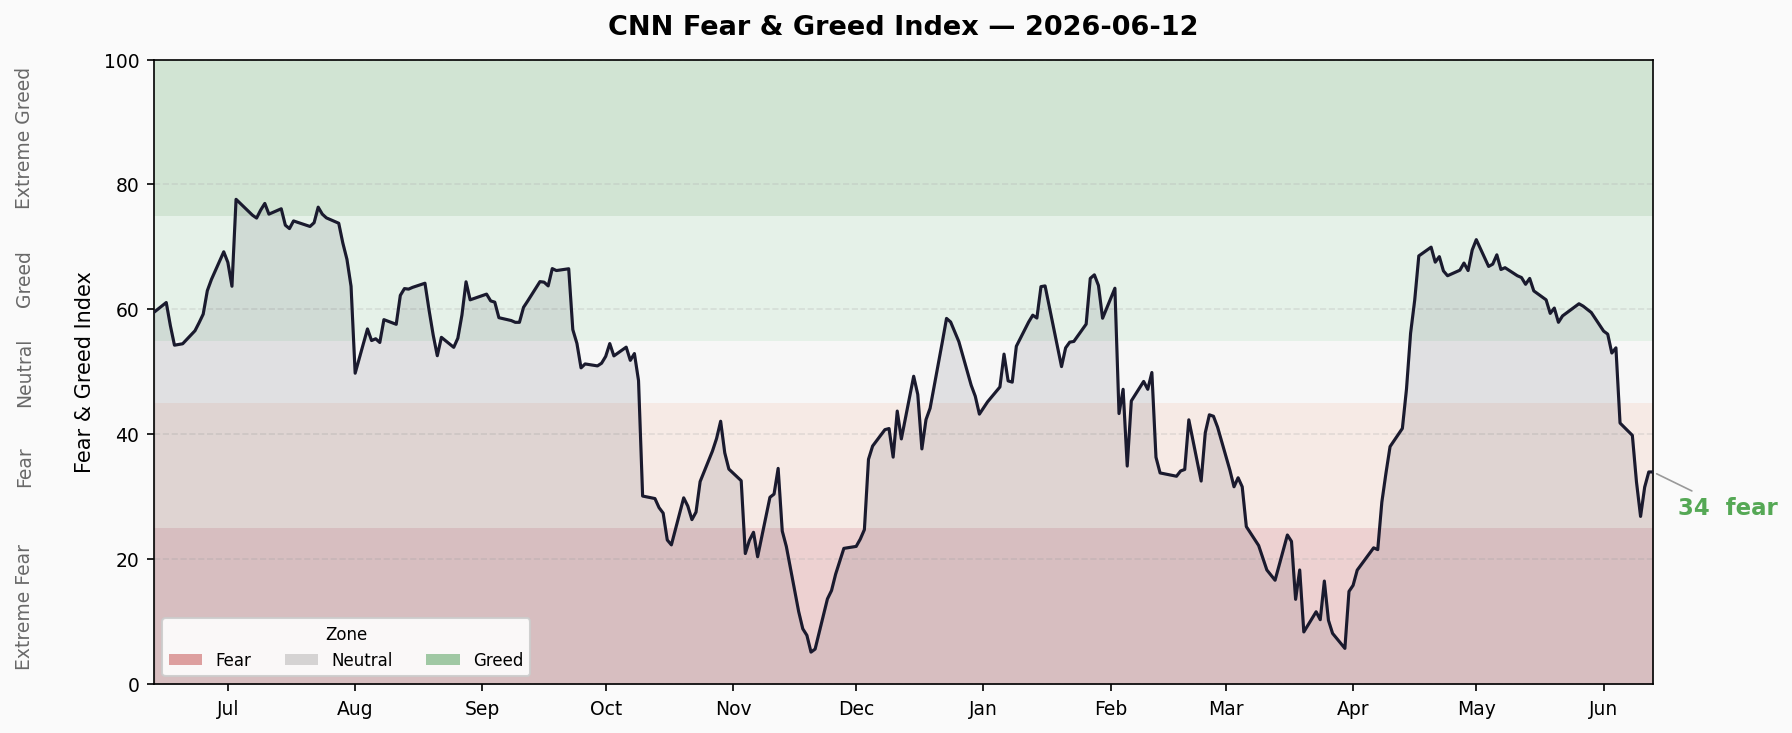
Composite Index
| Metric | Value | Rating |
|---|---|---|
| Current | 34 | Fear |
| Previous Close | 29.63 | Fear |
| 1 Week Ago | 41.83 | Fear |
| 1 Month Ago | 65.11 | Greed |
| 1 Year Ago | 64.60 | Greed |
Composite index bounced from extreme fear low (5.17, Nov 2025) to current 34, still in fear territory. Improved from previous close of 29.63, but well below the 65.11 reading from one month ago. Sentiment recovery remains incomplete.
7 Sub-Indicators Scan
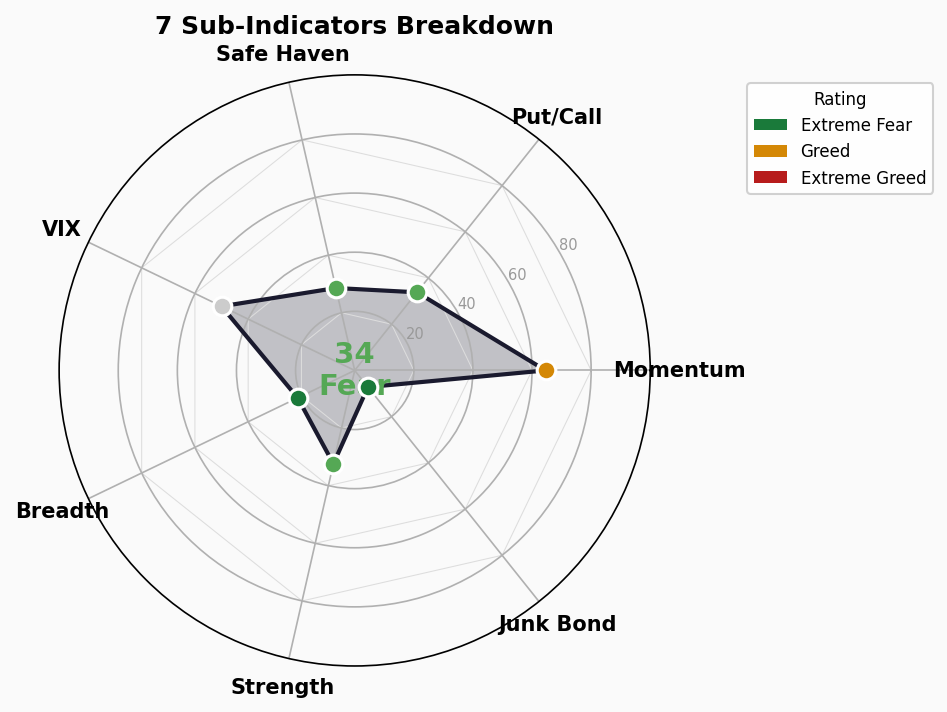
| Sub-Indicator | Score | Rating | Raw Value | Direction |
|---|---|---|---|---|
| Market Momentum (SP500) | 64.6 | Greed | 7,431.46 | → Flat |
| Stock Price Strength | 32.4 | Fear | +1.31% | ↑ Recovering |
| Stock Price Breadth | 21.4 | Extreme Fear | 974.42 | ↓ Deteriorating |
| Put/Call Options | 33.8 | Fear | 0.772 | → Flat |
| Market Volatility (VIX) | 50.0 | Neutral | 17.68 | ↓ Improving |
| Junk Bond Demand | 7.2 | Extreme Fear | 1.348 | ↓ Deteriorating |
| Safe Haven Demand | 28.6 | Fear | -0.353 | ↓ Deteriorating |
Detailed Breakdown:
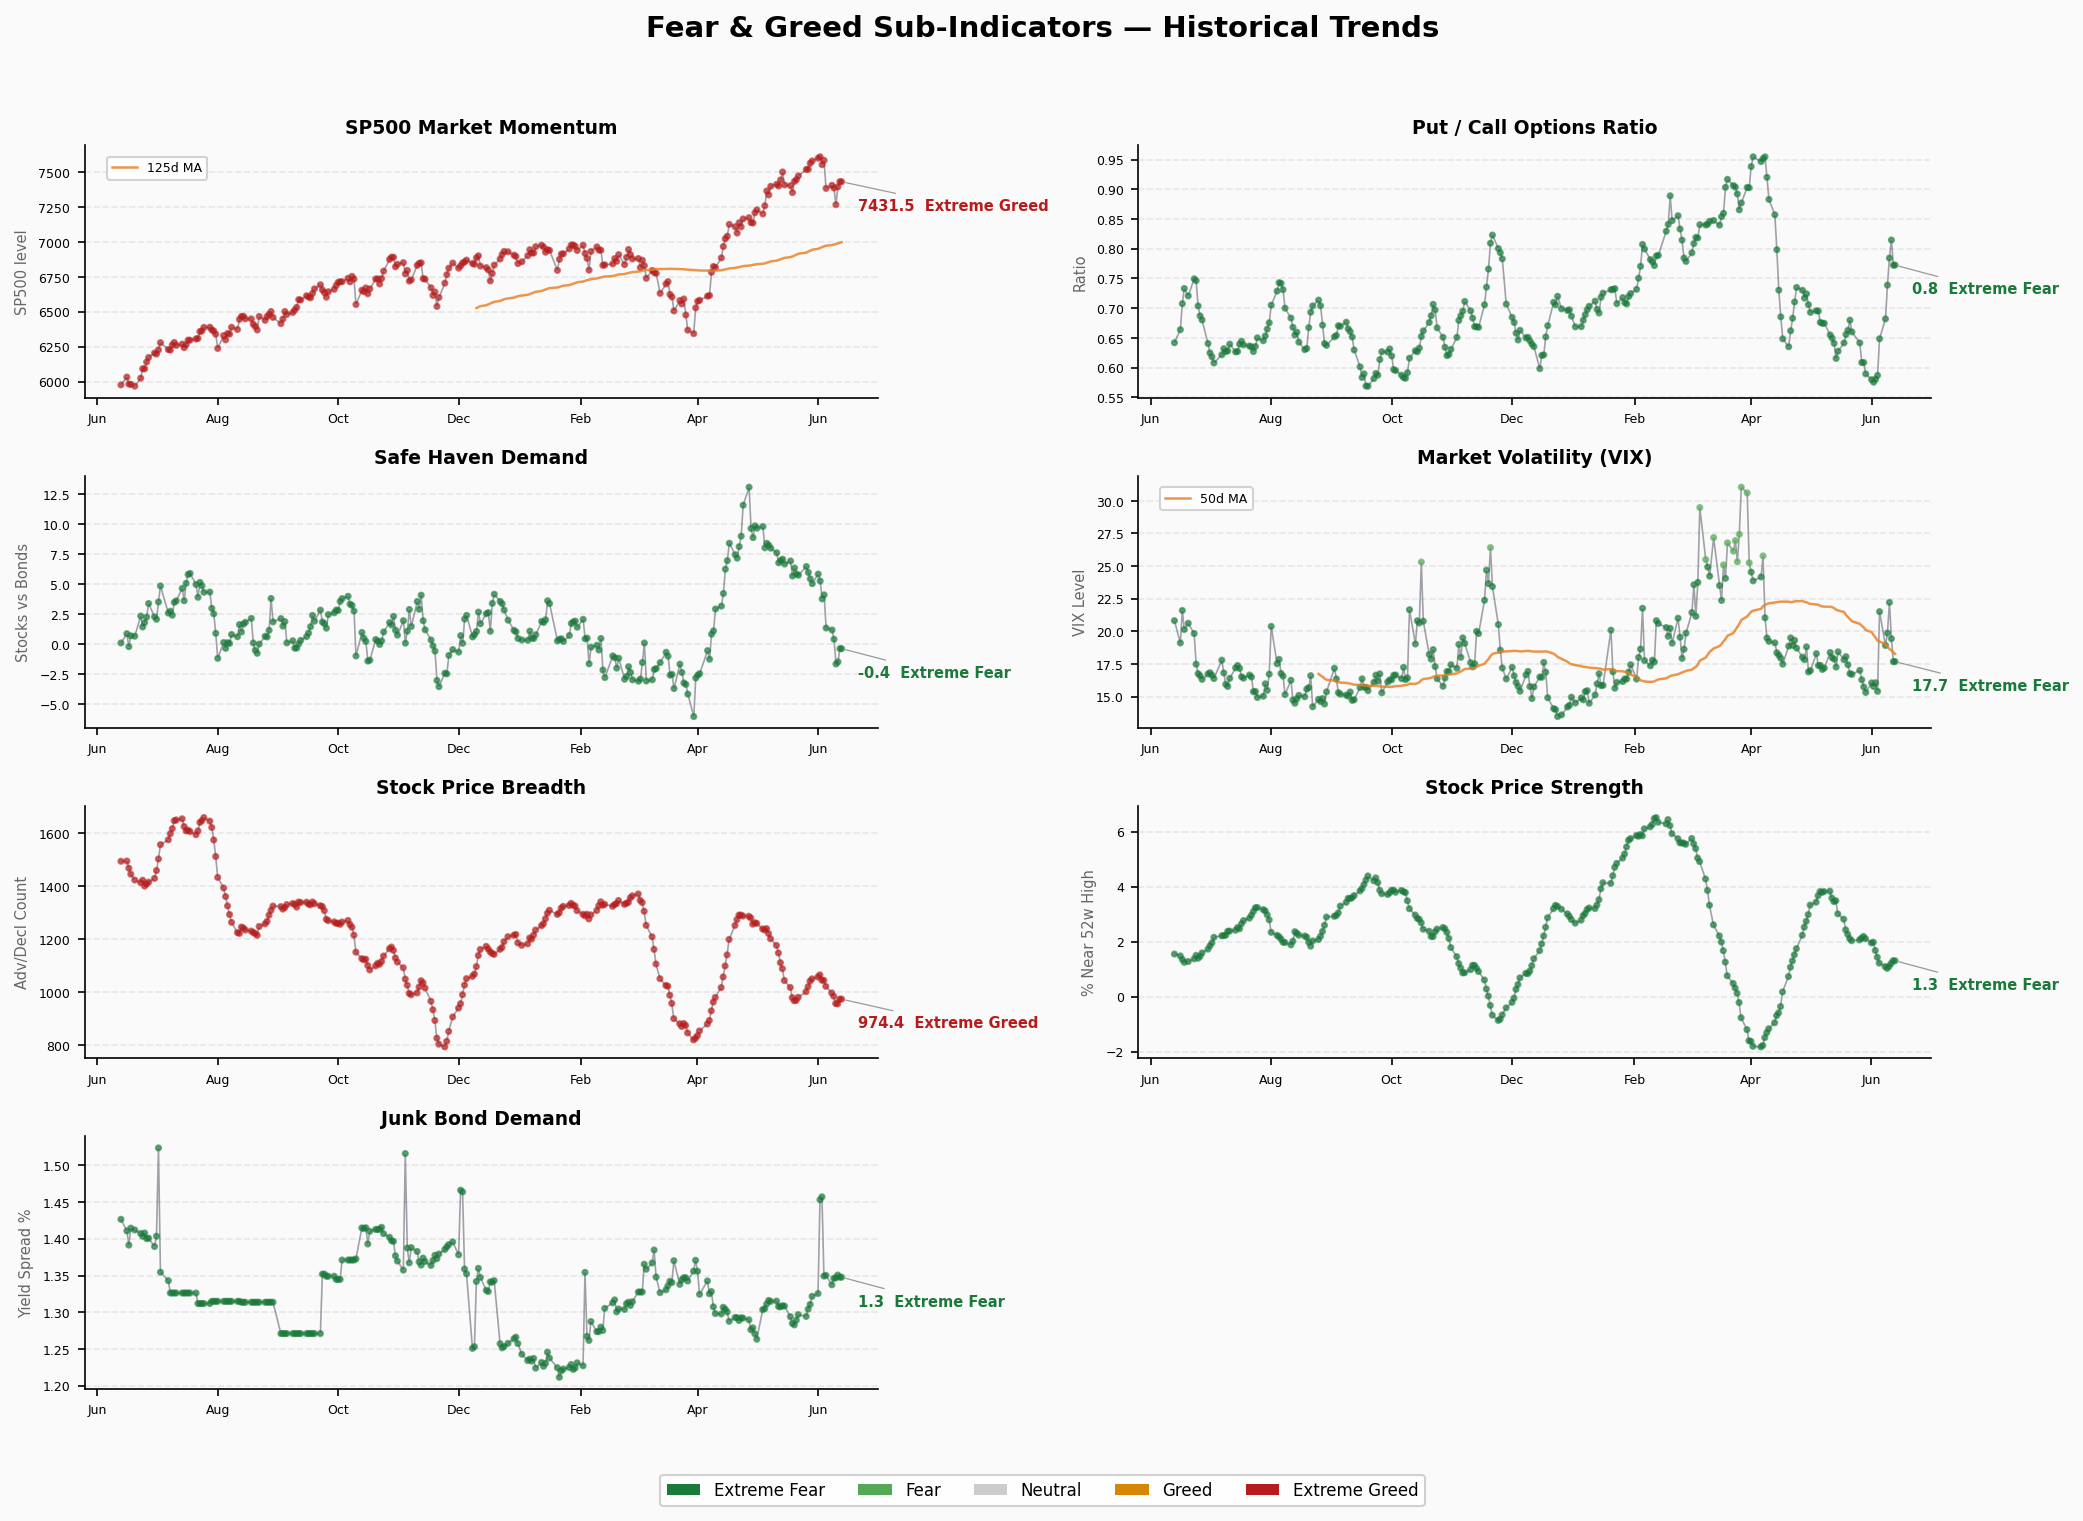
Market Momentum (64.6, Greed): S&P 500 closed at 7,431, still above its 125-day moving average. The only sub-indicator maintaining greed territory. But note — composite in fear while momentum in greed is a classic divergence signal.
Stock Price Strength (32.4, Fear): Very few stocks making 52-week highs. Only 1.31% of stocks at new highs — market lacks leadership.
Stock Price Breadth (21.4, Extreme Fear): Declining stocks vastly outnumber advancing ones. Market breadth is severely deteriorating. This is a leading indicator — breadth collapses typically precede index declines.
Put/Call Options (33.8, Fear): Put/call ratio at 0.772, options market tilting defensive. Investors are buying insurance.
Market Volatility (50.0, Neutral): VIX at 17.68, neutral territory. The only non-panicked sub-indicator, though VIX 50-day MA at 18.40 remains elevated.
Junk Bond Demand (7.2, Extreme Fear): Junk bond yield spread compressed to 1.348% — extreme risk aversion in credit markets. The lowest of all 7 sub-indicators. Credit markets are flashing a strong warning.
Safe Haven Demand (28.6, Fear): Treasuries outperforming stocks by -0.35%. Capital flowing to safety. Risk-off sentiment is clear.
Structural Contradiction Analysis
Contradiction 1: Momentum vs. Breadth — Severe Divergence
- Market Momentum at 64.6 (Greed) vs Stock Price Breadth at 21.4 (Extreme Fear)
- S&P 500 appears resilient, but individual stocks are broadly declining
- This “fat index, skinny constituents” pattern is historically unsustainable
Contradiction 2: Junk Bonds Extreme Fear vs VIX Neutral
- Junk bond spread score at 7.2 (Extreme Fear), but VIX only at 50 (Neutral)
- Credit markets more pessimistic than derivatives markets
- Credit spreads typically lead VIX by 1-2 months — credit may be pricing a risk not yet exposed
Contradiction 3: Persistent Momentum Greed Amid Overall Fear
- SP500 momentum sub-indicator holds in greed (64.6), but composite at only 34 (Fear)
- Historically, when momentum slides from greed to fear, it often triggers accelerating declines
Trend Assessment
Range Duration: Composite has been stuck in fear (25-50) for approximately 6 weeks since bouncing from extreme fear in early May. Failure to break above the 50 neutral line signals weak recovery momentum.
Turning Indicators:
- Previous close 29.6 → Current 34: short-term minor rebound
- One week ago 41.8 → Current 34: weekly trend still declining
- Monthly comparison: 65.1 → 34: sentiment has sharply deteriorated
Key Observations:
- Junk bond demand (7.2) and price breadth (21.4) simultaneously at extreme fear — historically, when both hit extremes together, the market tends to probe further lows
- The sole cushion is VIX still neutral (50), not yet triggering panic selling
- If VIX breaks above 25 (roughly corresponding to VIX score dropping below 30), it could trigger a panic acceleration