CNN Fear & Greed Analysis 2026-06-13
Composite 34 (Fear); junk bond demand 7.2 hits extreme fear; market breadth 21.4 enters extreme fear; structural divergence intensifies
Composite Index
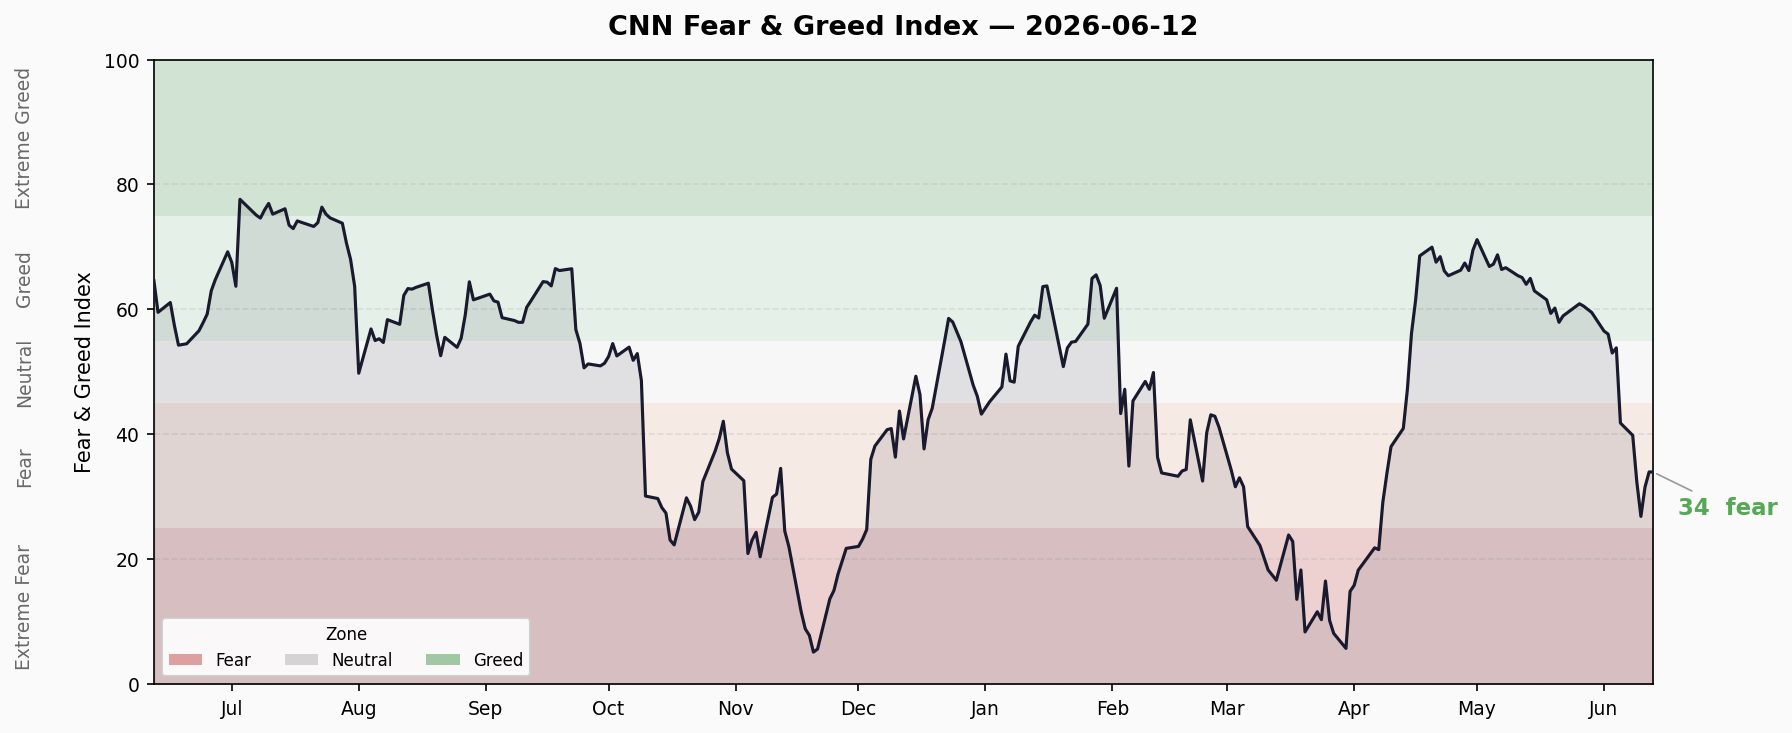
Current Score: 34 / 100 — Fear
| Timeframe | Score | Change |
|---|---|---|
| Today | 34 | — |
| Previous Close | 29.6 | +4.4 ↑ |
| 1 Week Ago | 41.8 | -7.8 ↓ |
| 1 Month Ago | 65.1 | -31.1 ↓↓ |
| 1 Year Ago | 64.6 | -30.6 ↓↓ |
Trend Direction: Composite dropped from 41.8 a week ago to 34, entering Fear territory. Down 31 points from the greed peak of 65.1 a month ago — bearish sentiment accelerating. A modest bounce from 29.6 (previous close) lacks conviction.
Range Dwell: The composite has moved from 53.1 (Neutral) to 34 (Fear) in ~10 days, spending only 2-3 days in Fear. Historical patterns suggest 5-10 days of consolidation are needed to confirm a bottom.
7 Sub-Indicators Scan
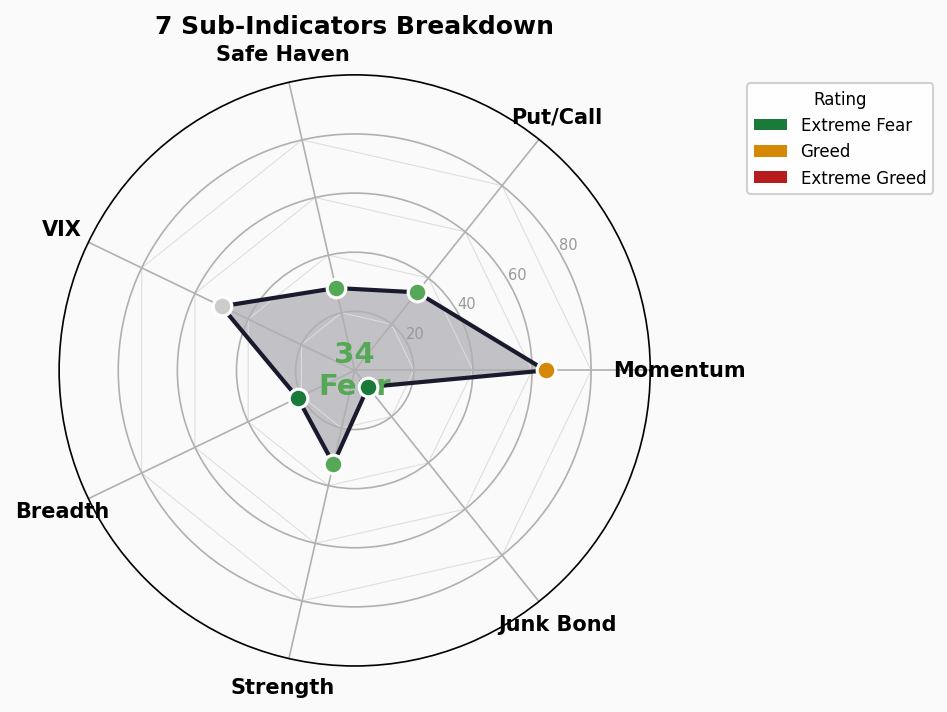
| # | Indicator | Score | Rating | Raw Value | Prev Raw | Direction |
|---|---|---|---|---|---|---|
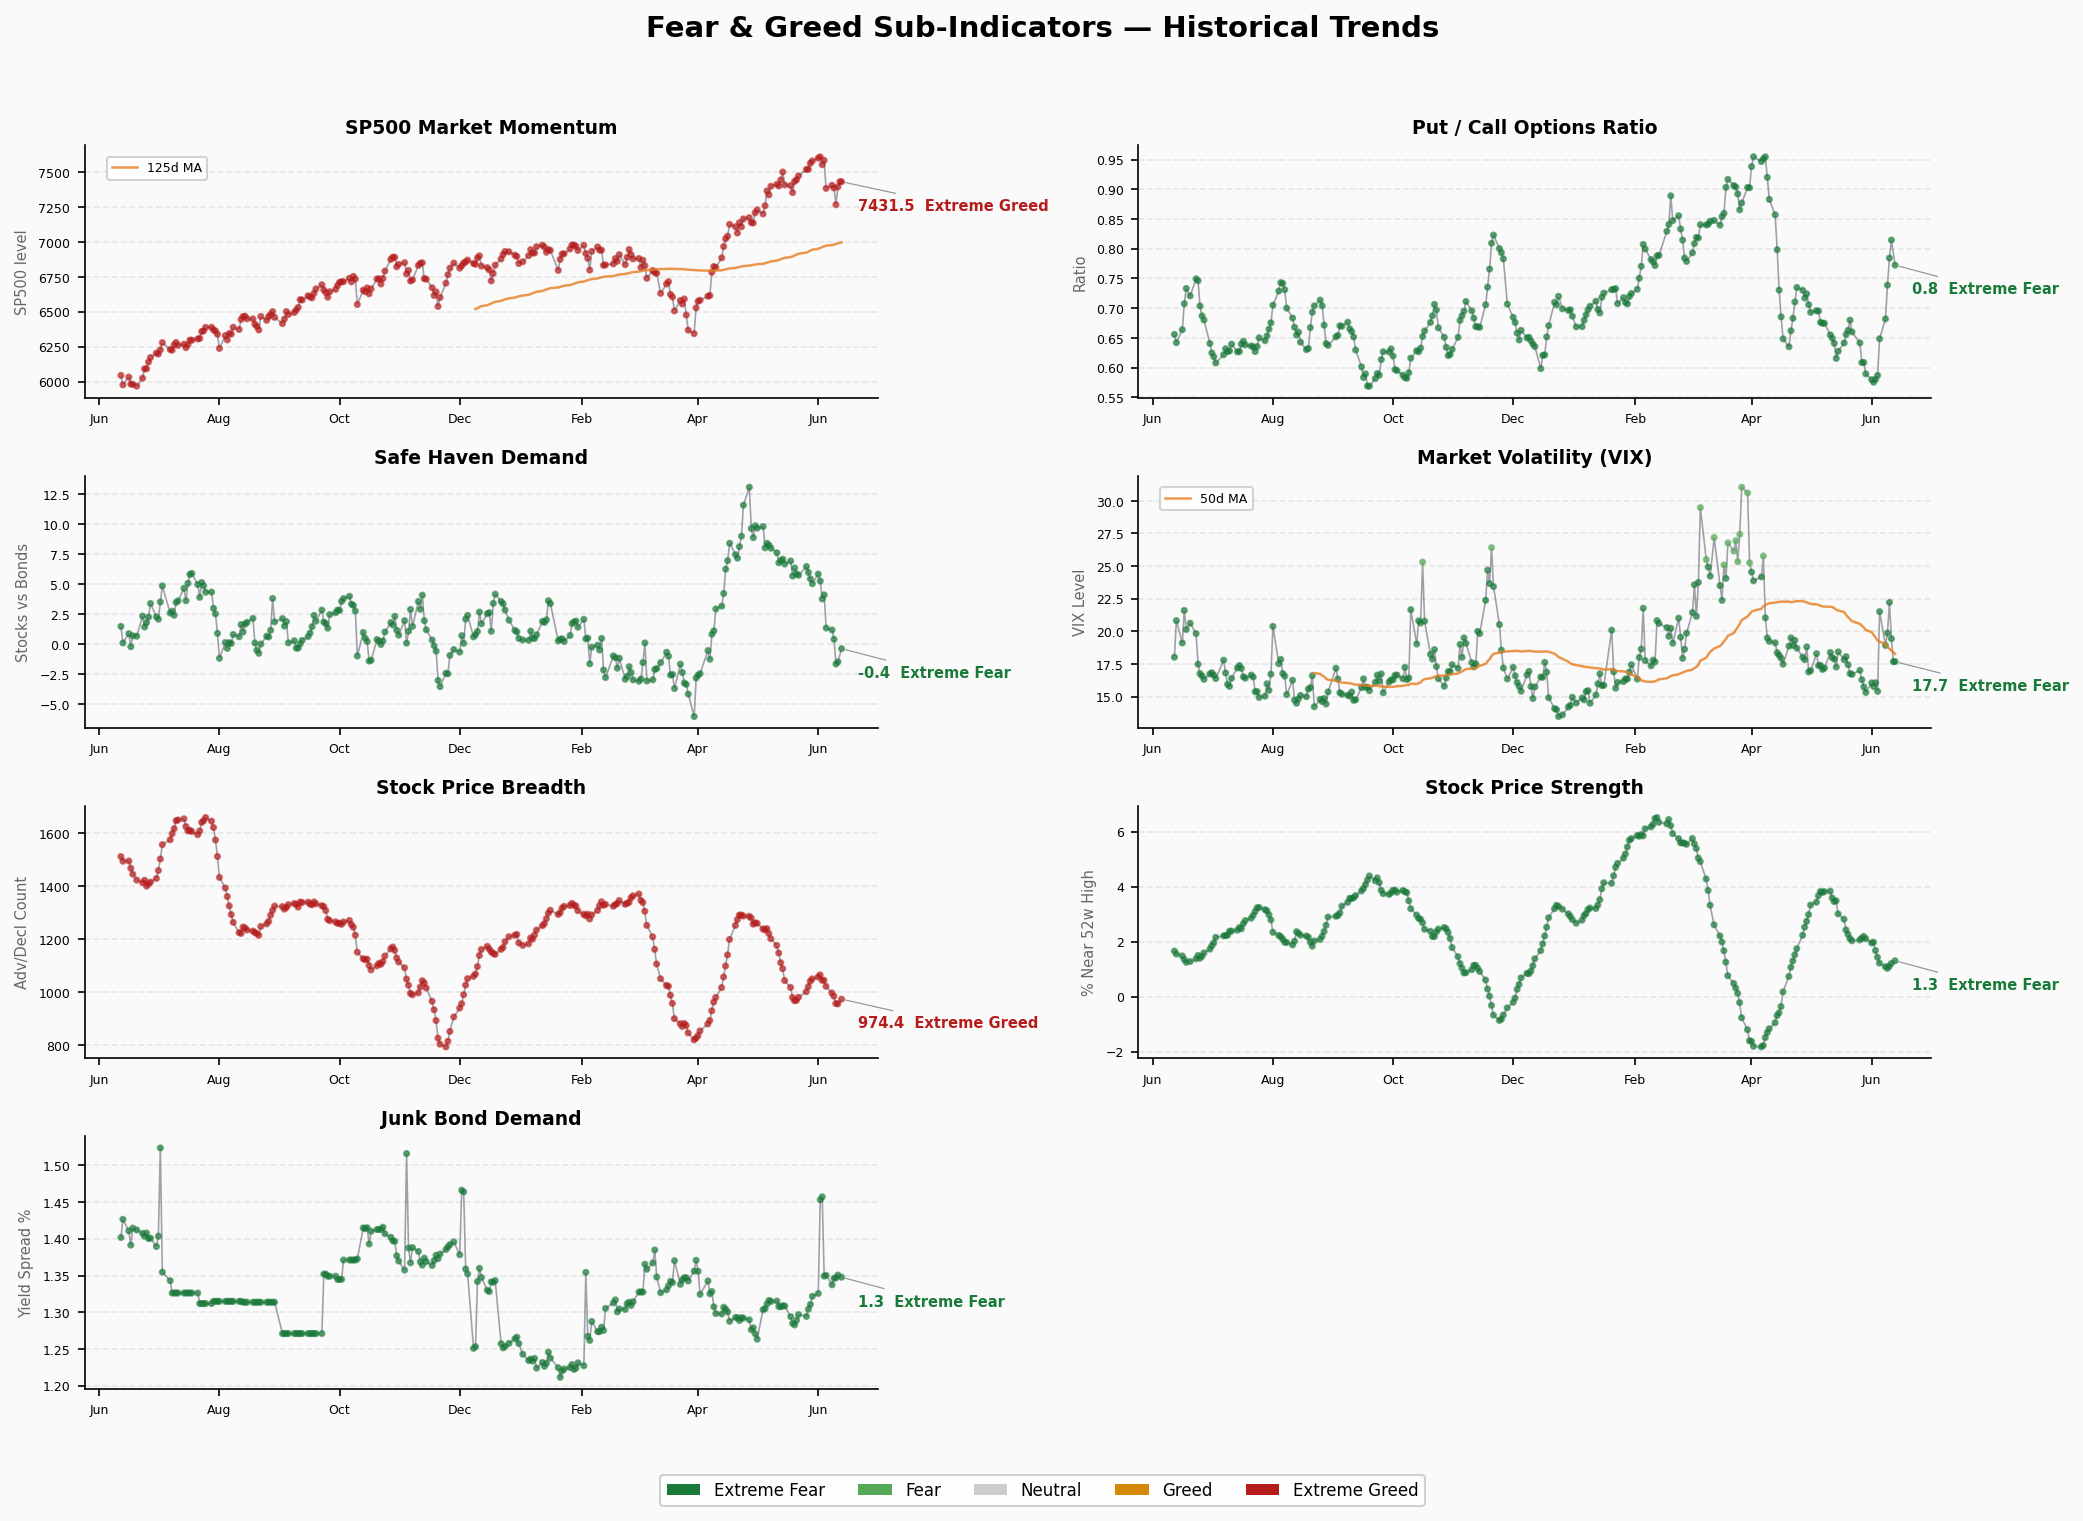
| 1 | Market Momentum (SP500) | 64.6 | Greed | 7,431.46 | 7,431.46 | → Flat |
| 2 | Stock Price Strength | 32.4 | Fear | 1.31 | 1.21 | ↑ Slight up |
| 3 | Stock Price Breadth | 21.4 | ⚠️ Extreme Fear | 974.42 | 956.51 | ↑ Slight up |
| 4 | Put/Call Ratio | 33.8 | Fear | 0.77 | 0.81 | ↓ Less bearish |
| 5 | Market Volatility (VIX) | 50.0 | Neutral | 17.68 | 17.68 | → Flat |
| 6 | VIX 50-Day MA | 50.0 | Neutral | 18.40 | 18.40 | → Flat |
| 7 | Junk Bond Demand | 7.2 | 🔴 Extreme Fear | 1.35 | 1.35 | → Flat |
| 8 | Safe Haven Demand | 28.6 | Fear | -0.35 | -1.45 | ↑ Less fearful |
Detailed Breakdown
1. Market Momentum (64.6 · Greed) S&P 500 at 7,431.46 remains above the 125-day moving average. Despite recent pullback, price trend is still positive. This is the only “Greed” signal among all sub-indicators — the index hasn’t confirmed a bear market yet.
2. Stock Price Strength (32.4 · Fear) New high/low ratio at 1.31 (prev 1.21), hovering near Fear territory. Advancing stocks barely outnumber declining ones, but absolute levels are weak. No bullish thrust.
3. Stock Price Breadth (21.4 · ⚠️ Extreme Fear) Advance/decline line at 974.42, deep in Extreme Fear territory (<25). The most alarming signal — a broad swath of stocks are already in downtrends, with only a handful of mega-caps holding the index up. Breadth deterioration typically precedes index declines by 2-4 weeks.
4. Put/Call Ratio (33.8 · Fear) Ratio at 0.77 (prev 0.81), down from prior day. Options market shows hedging demand declining but still elevated. Extreme put buying has eased.
5. Market Volatility (50.0 · Neutral) VIX at 17.68, squarely neutral. No abnormal volatility spike. Market is “calm” despite underlying stress — classic pre-storm behavior.
6. VIX 50-Day MA (50.0 · Neutral) 50-day average at 18.40, also neutral. Medium-term volatility trend is平稳.
7. Junk Bond Demand (7.2 · 🔴 Extreme Fear) Spread ratio at 1.35, in Extreme Fear territory (<10). The most extreme signal in the entire dashboard. Corporate bond spreads have blown out to crisis-level widths, reflecting acute credit risk aversion. Historically, junk bond extreme fear precedes equity selloffs by 1-3 months.
8. Safe Haven Demand (28.6 · Fear) Treasury vs. equity return differential at -0.35 (prev -1.45), improving from extreme fear. Capital is no longer panic-fleeing into bonds, but risk-off preference persists.
Structural Contradiction Analysis
Extreme Value Signals
| Indicator | Value | Threshold | Implication |
|---|---|---|---|
| Junk Bond Demand | 7.2 | <10 Extreme Fear | Credit market in crisis-level avoidance |
| Stock Price Breadth | 21.4 | <25 Extreme Fear | Broad-based stock deterioration |
Two sub-indicators simultaneously at extreme fear — first such dual-extreme in 3 months.
Divergence Signals
Core contradiction: Index Price vs. Internal Structure
- S&P 500 still at 7,400+, momentum score 64.6 (Greed) —表面上是牛市回调
- But breadth at 21.4 + junk bonds at 7.2 — underlying structure already crumbling
- VIX placid at 17.68 — volatility market hasn’t priced in the risk
This “high price + deteriorating internals + calm volatility” combination historically precedes major corrections by 2-6 weeks. Classic slow-boil scenario.
Directional Assessment
| Indicator | Range | Days in Range | Assessment |
|---|---|---|---|
| Composite | Fear (34) | ~3 days | Too short; digestion incomplete |
| Junk Bonds | Extreme Fear (7.2) | >7 days | Persistent deterioration, no turning point |
| Breadth | Extreme Fear (21.4) | ~3 days | Newly entered; likely to worsen |
| VIX | Neutral (50) | >5 days | Lagging; awaiting catalyst |
Trend Assessment & Strategy
Current Regime: Fear without panic. Composite at 34 is upper-end of Fear territory (9 points from Extreme Fear at 25). Expect range-bound oscillation.
Watch Points:
- Composite < 25: Confirms Extreme Fear — historically the golden contrarian buying zone
- VIX > 25: Volatility panic confirmed; likely accelerates selloff
- Junk bond spreads widening further: Credit risk transmission to equities imminent
Strategic Implications:
- Position Sizing: Not the time to add exposure. Fear typically precedes further downside
- Defense First: Junk bond extreme fear + breadth deterioration = credit risk + broad selling. Overweight Treasuries, gold, utilities
- Wait for Signals: Extreme Fear (<25) + VIX spike + panic volume = generational buying opportunity. Patience.