CNN Fear & Greed Analysis 2026-06-12
Composite at 29.7 (Fear); market breadth and junk bond demand at extreme fear; momentum and volatility neutral
📈 Composite Index
| Metric | Value | Rating | vs Prior Day |
|---|---|---|---|
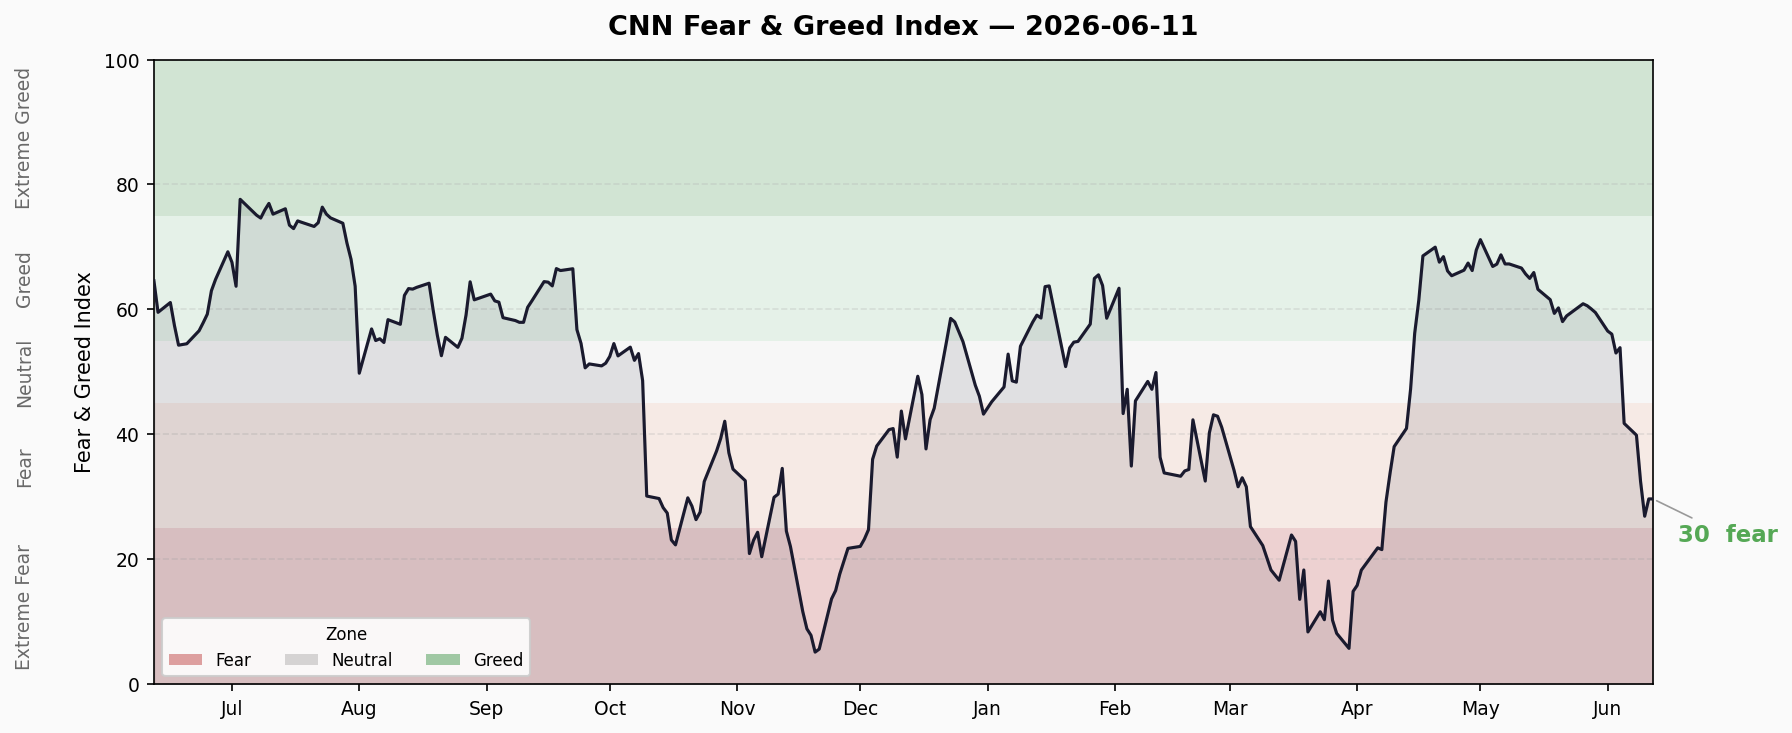
| Fear & Greed Index | 29.7 | Fear | Low |
Data as of: 2026-06-11 (post US market close)
Last 10 Days Trend
The index has been lingering in the Fear zone (20-40) for multiple sessions. It hasn’t yet breached Extreme Fear (<25) but is perilously close.
🔍 All 7 Sub-Indicators Scanned
| # | Indicator | Score | Rating | Latest Value | Trend |
|---|---|---|---|---|---|
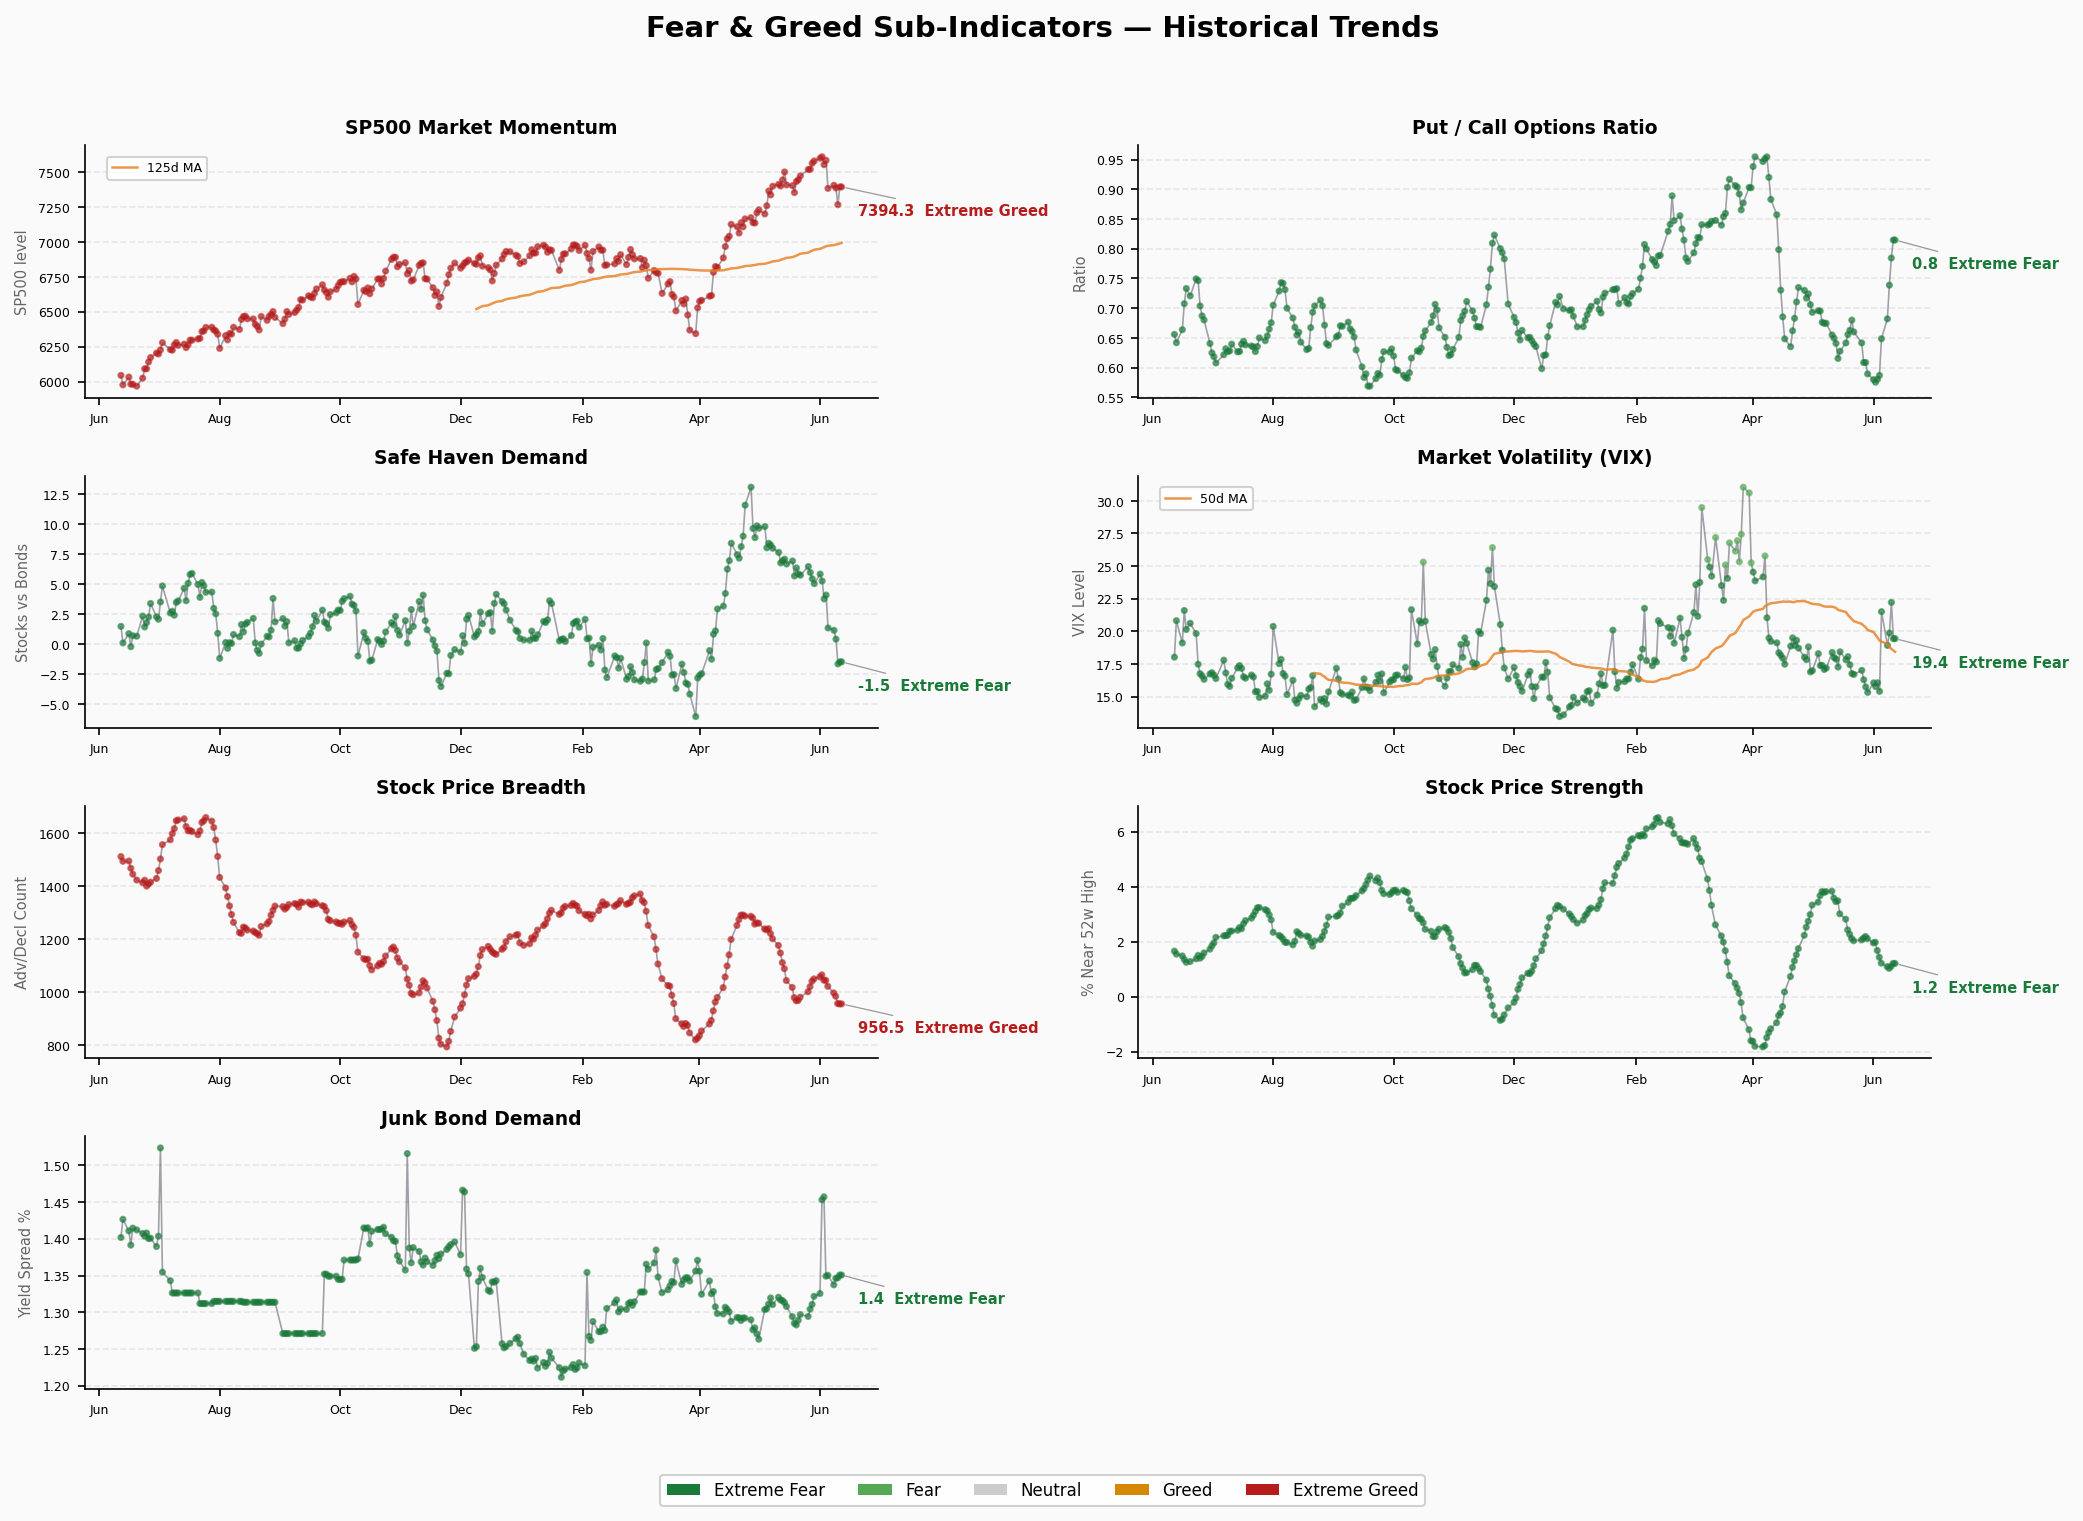
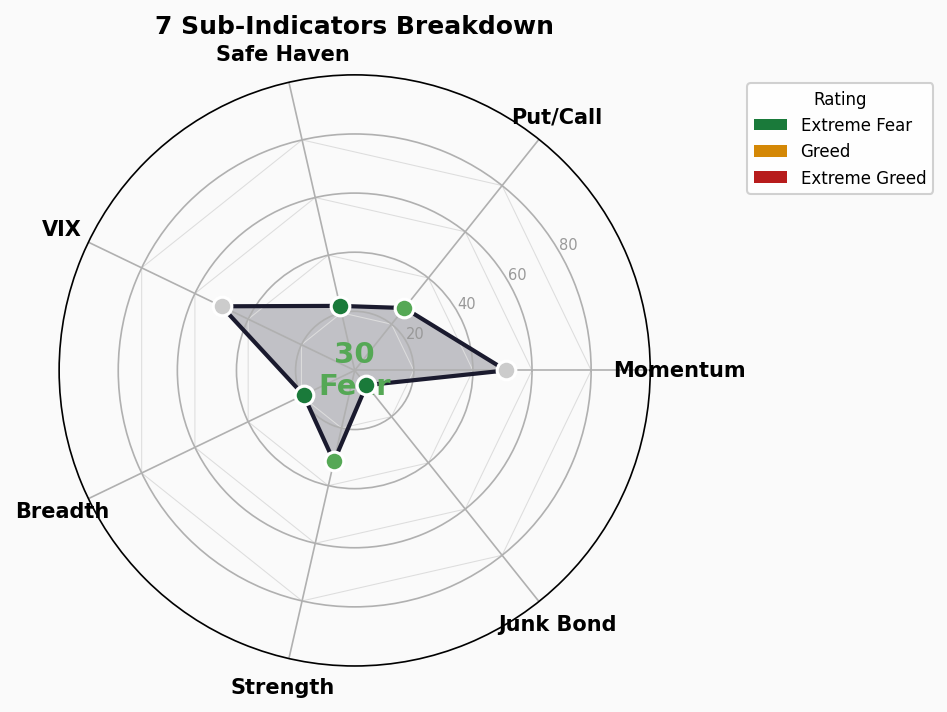
| 1 | Market Momentum (S&P 500) | 51.2 | Neutral | 7,394.3 | ↓ Down |
| 2 | Stock Price Strength | 31.6 | Fear | 1.21 | ↓ Down |
| 3 | Market Breadth | 19.2 | ⚠️ Extreme Fear | 956.5 | ↓ Down |
| 4 | Put/Call Options | 27.0 | Fear | 0.815 | ↑ Up (bearish) |
| 5 | Market Volatility (VIX) | 50.0 | Neutral | 19.44 | ↑ Up |
| 6 | Junk Bond Demand | 6.4 | ⚠️ Extreme Fear | 1.35 | → Flat |
| 7 | Safe Haven Demand | 22.4 | ⚠️ Extreme Fear | -1.45 | ↓ Down |
Indicator-by-Indicator Breakdown
1. Market Momentum (Score: 51.2 — Neutral)
- S&P 500 at 7,394, still above its 125-day MA (6,989)
- But last 10 days show decline from 7,600 to 7,393 — momentum fading
- Neutral reading means price is above trend but the advance is stalling
2. Stock Price Strength (Score: 31.6 — Fear)
- 52-week high/low ratio at 1.21 — weak breadth on individual names
- Dropped from 2.11 to 1.21 over 10 days — selling pressure expanding
- Fear territory means individual stock deterioration is accelerating
3. Market Breadth (Score: 19.2 — Extreme Fear ⚠️)
- McClellan Volume Summation Index at 956.5, broken below 1,000
- 10-day decline from 1,051 to 956 — persistent volume contraction
- Extreme Fear signal: Breadth deterioration means declines are spreading from a few names to the broader market
4. Put/Call Options (Score: 27.0 — Fear)
- CBOE Put/Call ratio at 0.815, approaching bearish territory
- Surged from 0.59 to 0.81 over 10 days — protective put buying accelerating
- Fear signal: Markets are buying insurance at elevated rates
5. Market Volatility (Score: 50.0 — Neutral)
- VIX at 19.44, squarely in neutral territory
- 10-day path: 16.05 → 22.22 → 19.44 — volatility spike has passed (for now)
- VIX 50-day MA at 18.53; current reading slightly elevated — uncertainty persists
6. Junk Bond Demand (Score: 6.4 — Extreme Fear ⚠️)
- Yield spread between junk bonds and Treasuries at extremely compressed levels
- 10-day range: 1.32–1.46, no meaningful bounce
- Extreme Fear signal: Weak junk bond demand signals credit market deep pessimism on economic outlook
7. Safe Haven Demand (Score: 22.4 — Extreme Fear ⚠️)
- Stock vs bond performance differential at -1.45% — bonds massively outperforming
- Crashed from +5.06 to -1.45 over 10 days — massive flight to safety
- Extreme Fear signal: Classic risk-off behavior; capital fleeing risk assets
🔀 Structural Contradiction Analysis
Extreme Value Scan
| Indicator | Score | Threshold | Status |
|---|---|---|---|
| Market Breadth | 19.2 | <20 | 🔴 Extreme Fear |
| Junk Bond Demand | 6.4 | <20 | 🔴 Extreme Fear |
| Safe Haven Demand | 22.4 | <25 | 🟡 Approaching Extreme |
Divergence Signals
Momentum vs Breadth Divergence — Market momentum neutral (51.2) but breadth at extreme fear (19.2). This is one of the most dangerous signals. It means the index looks stable on the surface while internal deterioration is severe. Historically, this divergence precedes sharp market declines.
VIX Neutral vs Put/Call Fear — VIX at 19.44 (neutral) while Put/Call at 0.815 (fear). Implied volatility hasn’t yet caught up to the options market’s panic — a “volatility catch-up” scenario is possible.
Junk Bond Extreme Fear vs VIX Neutral — Credit markets (junk bonds) are more pessimistic than derivatives markets (VIX). Credit markets typically lead equities by 1-2 weeks, suggesting volatility may rise ahead.
📊 Trend Assessment
Duration in Current Zone
- FNG composite has been in the Fear zone (20-40) for multiple consecutive sessions
- Historical pattern: Fear zone averages 10-15 days before either bouncing to neutral or deteriorating to extreme fear
Turning Point Indicators
- Safe Haven Demand in freefall (+5.06 → -1.45) — the most sensitive leading indicator
- Market Breadth in persistent decline with no bounce signals
- Put/Call still rising — bearish sentiment hasn’t peaked yet
Overall Assessment
The market is in Fear territory but hasn’t bottomed:
- 3 sub-indicators at Extreme Fear (breadth, junk bonds, safe haven)
- 2 sub-indicators at Fear (price strength, put/call)
- 2 sub-indicators at neutral (momentum, VIX)
⚠️ Key Risk: The momentum-breadth divergence (neutral vs extreme fear) is a classic fragility signal. If S&P 500 breaks key support levels, the extreme breadth readings could trigger panic selling.
Directional Lean: Defensive positioning favored. Reduce exposure, increase cash or safe-haven allocation. Wait for FNG composite to breach 20 (extreme fear) before considering contrarian entries.