CNN Fear & Greed Analysis 2026-06-11
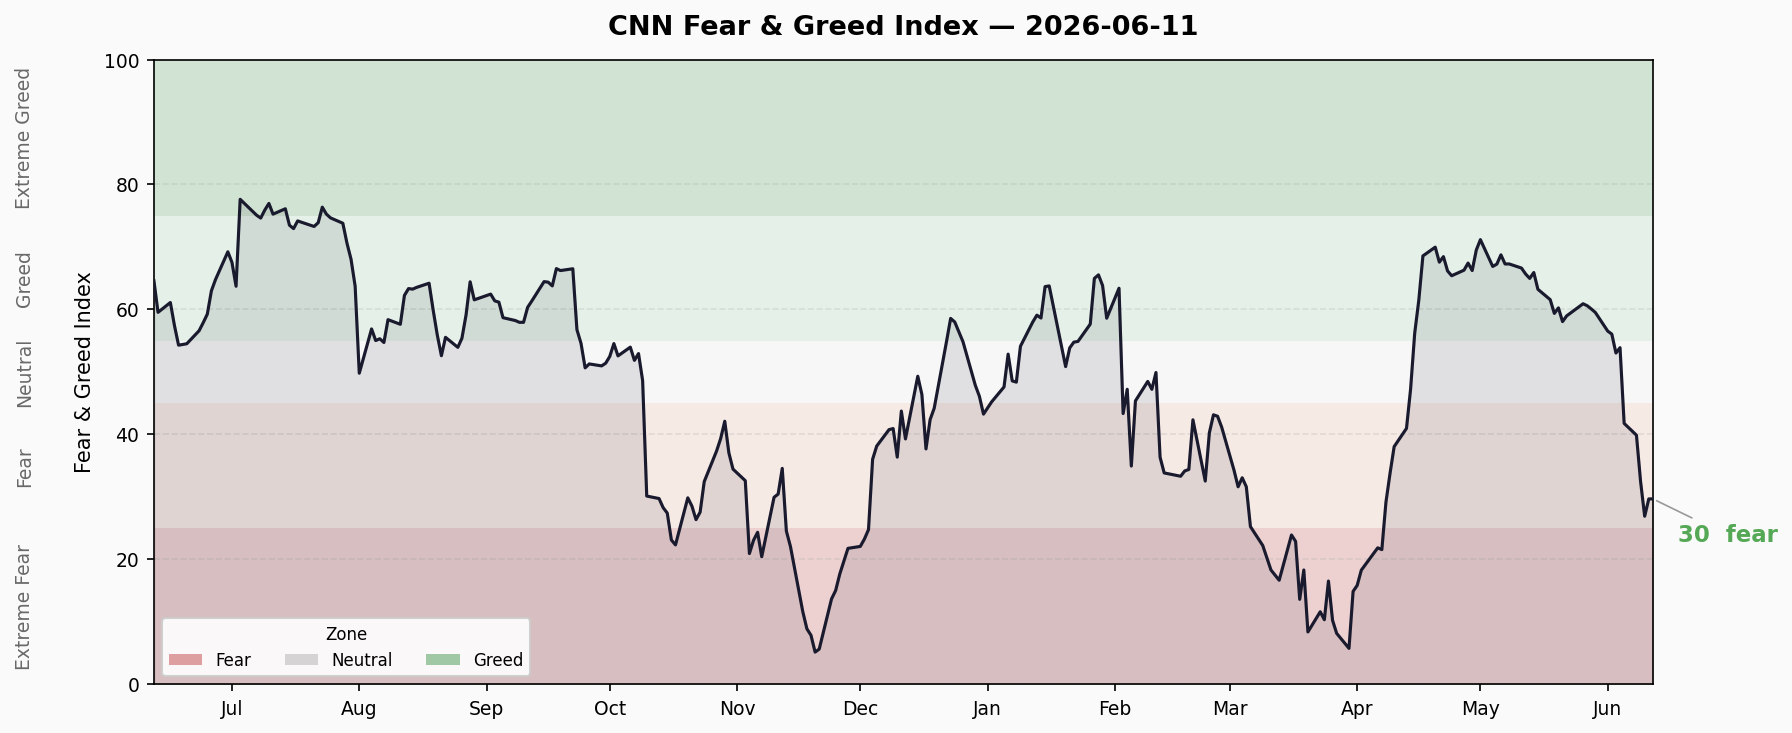
Index at 27 (Fear), 3 sub-indicators in Extreme Fear, 10-day trend plunges 59→27
Overall Index
| Metric | Value | Rating |
|---|---|---|
| Current | 27.5 | Fear |
| Previous Close | 33.4 | Fear |
| 1 Week Ago | 53.0 | Neutral |
| 1 Month Ago | 67.3 | Greed |
| 1 Year Ago | 64.0 | Greed |
Day-over-day: -5.9 points (33.4 → 27.5)
10-Day Trend
| Date | Score | Rating |
|---|---|---|
| 05-29 | 59.5 | Greed |
| 06-01 | 56.5 | Greed |
| 06-02 | 56.1 | Greed |
| 06-03 | 53.0 | Neutral |
| 06-04 | 53.9 | Neutral |
| 06-05 | 41.8 | Fear |
| 06-08 | 39.9 | Fear |
| 06-09 | 32.5 | Fear |
| 06-10 | 27.5 | Fear |
| 06-11 | 27.5 | Fear |
📉 10-day trend: sharp decline — from 59.5 to 27.5, a 32-point drop from “Greed” directly into “Fear”. Average daily decline of 6.4 points over the last 5 sessions.
7 Sub-Indicators Scan
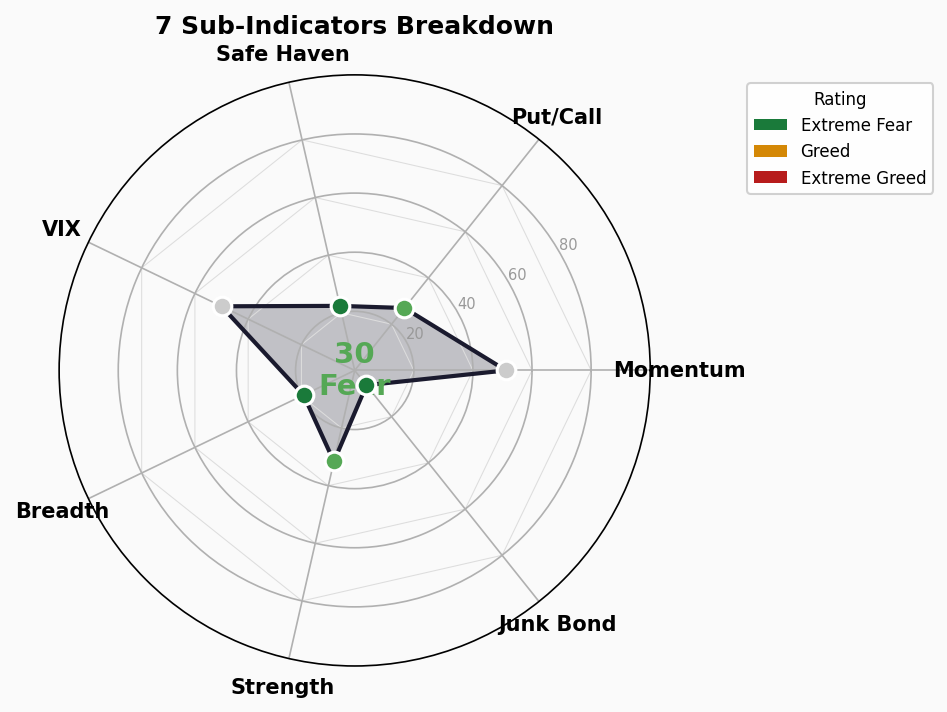
| # | Indicator | Score | Rating | Status |
|---|---|---|---|---|
| 1 | Market Momentum (S&P 500 vs 125-day MA) | 32.8 | Fear | ↓ |
| 2 | Stock Price Strength (52-wk highs vs lows) | 31.2 | Fear | ↓ |
| 3 | Stock Price Breadth (A/D Line) | 18.6 | Extreme Fear | ⚠️ |
| 4 | Put/Call Options Ratio | 31.8 | Fear | ↓ |
| 5 | Market Volatility (VIX) | 50.0 | Neutral | → |
| 6 | Junk Bond Demand | 7.0 | Extreme Fear | ⚠️ |
| 7 | Safe Haven Demand | 20.8 | Extreme Fear | ⚠️ |
Indicator Breakdown
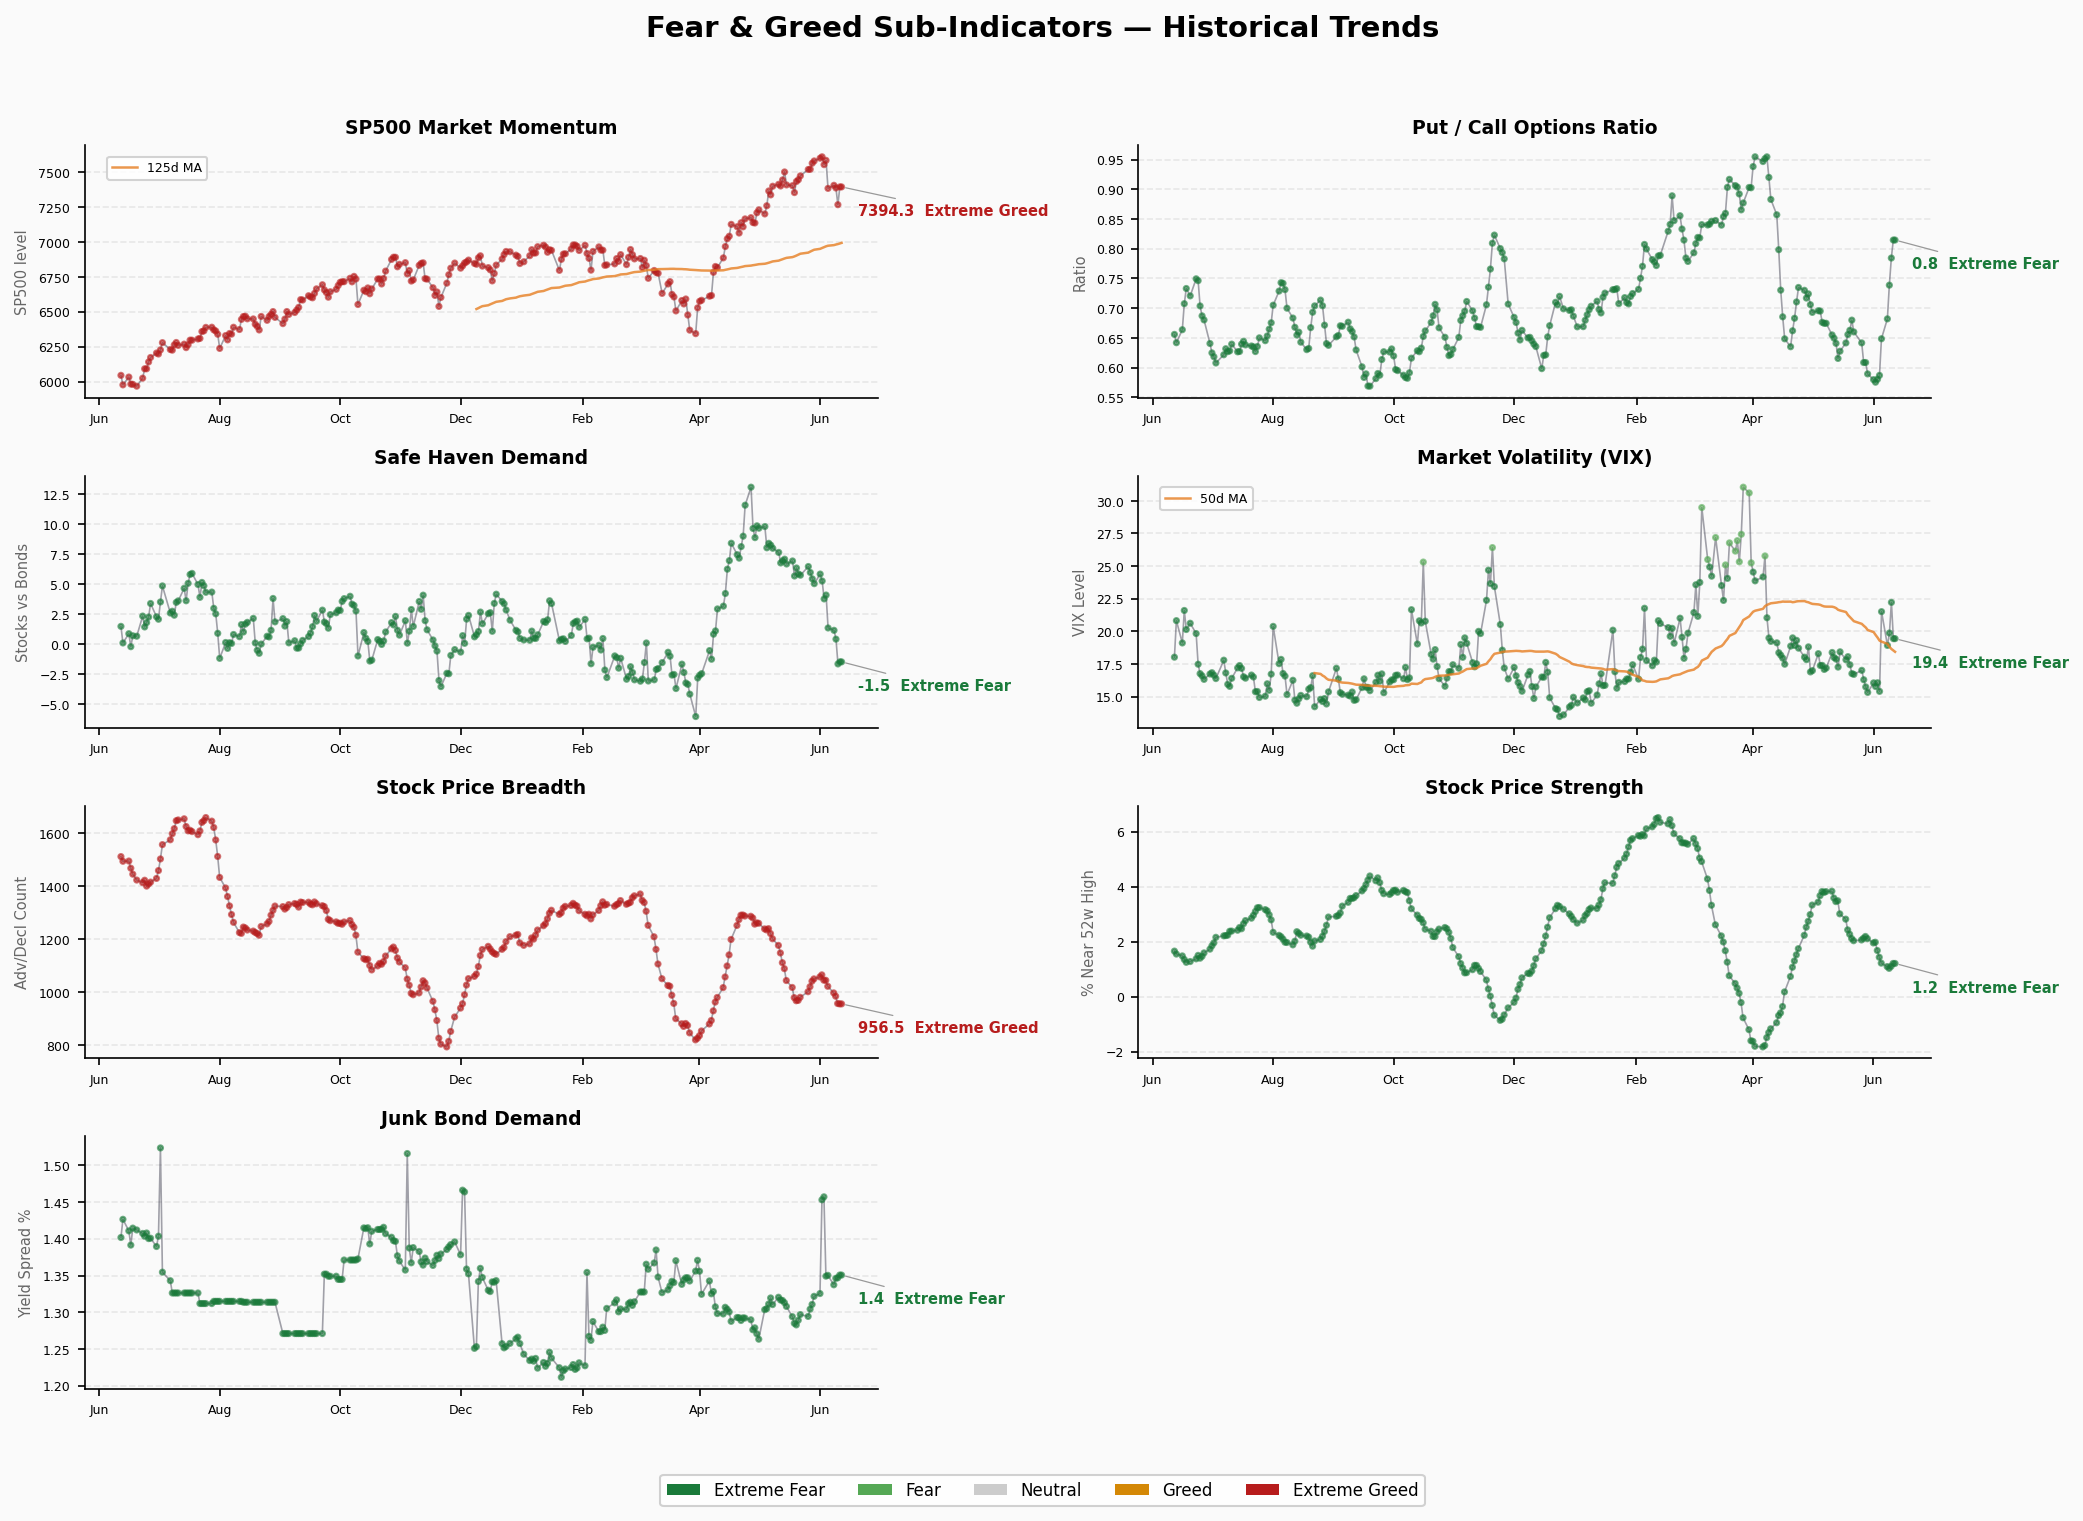
- Market Momentum (32.8): S&P 500 has broken below its 125-day moving average; short-term trend is decisively negative
- Stock Price Strength (31.2): 52-week new lows vastly outnumber new highs; internal market deterioration accelerating
- ⚠️ Stock Price Breadth (18.6) — Extreme Fear: Advance/line severely degraded, broad-based selling with only a handful of mega-caps propping up the index. This is the most dangerous signal — index declines伴随 by breadth deterioration historically precede larger drawdowns
- Put/Call Options (31.8): Elevated put buying reflects strong hedging demand and bearish positioning
- Market Volatility (50.0): VIX at neutral — not yet in panic territory, but rising from recent lows
- ⚠️ Junk Bond Demand (7.0) — Extreme Fear: Credit spreads widening aggressively. Credit markets are flashing a strong risk-off signal. Historically, credit deterioration precedes equity selloffs by days to weeks
- ⚠️ Safe Haven Demand (20.8) — Extreme Fear: Massive rotation into Treasuries and other safe havens; risk appetite severely contracted
Structural Divergence Analysis
Extreme Value Scan
- Extreme Fear (<20): Stock Price Breadth 18.6, Junk Bond Demand 7.0 — two indicators at extreme levels
- Extreme Greed (>80): None
Divergence Signals
- VIX Neutral vs Breadth Extreme Fear: Volatility hasn’t caught up to the internal deterioration. This divergence historically resolves with either VIX spiking (more likely) or breadth stabilizing (less likely given credit signals)
- Index 27 vs 1-month 67: A 40-point collapse in one month — extreme velocity of sentiment shift. Short-term oversold but trend unbroken
- Junk Bond 7.0 vs VIX 50: Credit markets more panicked than vol markets. This split appeared before the Dec 2018 and Mar 2020 selloffs, after which VIX caught up with credit deterioration
Trend Assessment
Dwell Time
- Fear zone for 6 consecutive sessions (since 06-05), still in downtrend
- Transition from Greed to Fear took only 6 sessions (06-01 56.5 → 06-05 41.8) — historically fast decline
Reversal Indicators
- No clear reversal signal: 7 sub-indicators show 3 Extreme Fear, 3 Fear, only VIX at Neutral — overwhelmingly bearish
- Watch for: VIX break above 30 (currently neutral), continued credit spread widening
- Potential reversal trigger: Composite falling below 20 into Extreme Fear — historically followed by technical bounce within 1-2 weeks
Overall Assessment
The market is in Fear territory with 3 sub-indicators at Extreme Fear. Credit markets (junk bonds) and market breadth flashing red simultaneously is a systemic risk warning. VIX’s failure to spike yet may be the calm before the storm. Short-term oversold conditions could trigger a technical bounce, but structural deterioration is ongoing — any bounce is a reducing opportunity, not a buy signal.