CNN Fear & Greed Analysis 2026-06-10
Composite score 33 enters Fear zone; junk bond demand at extreme fear; panic selling spreads to breadth
CNN Fear & Greed Analysis — 2026-06-10
Composite Index
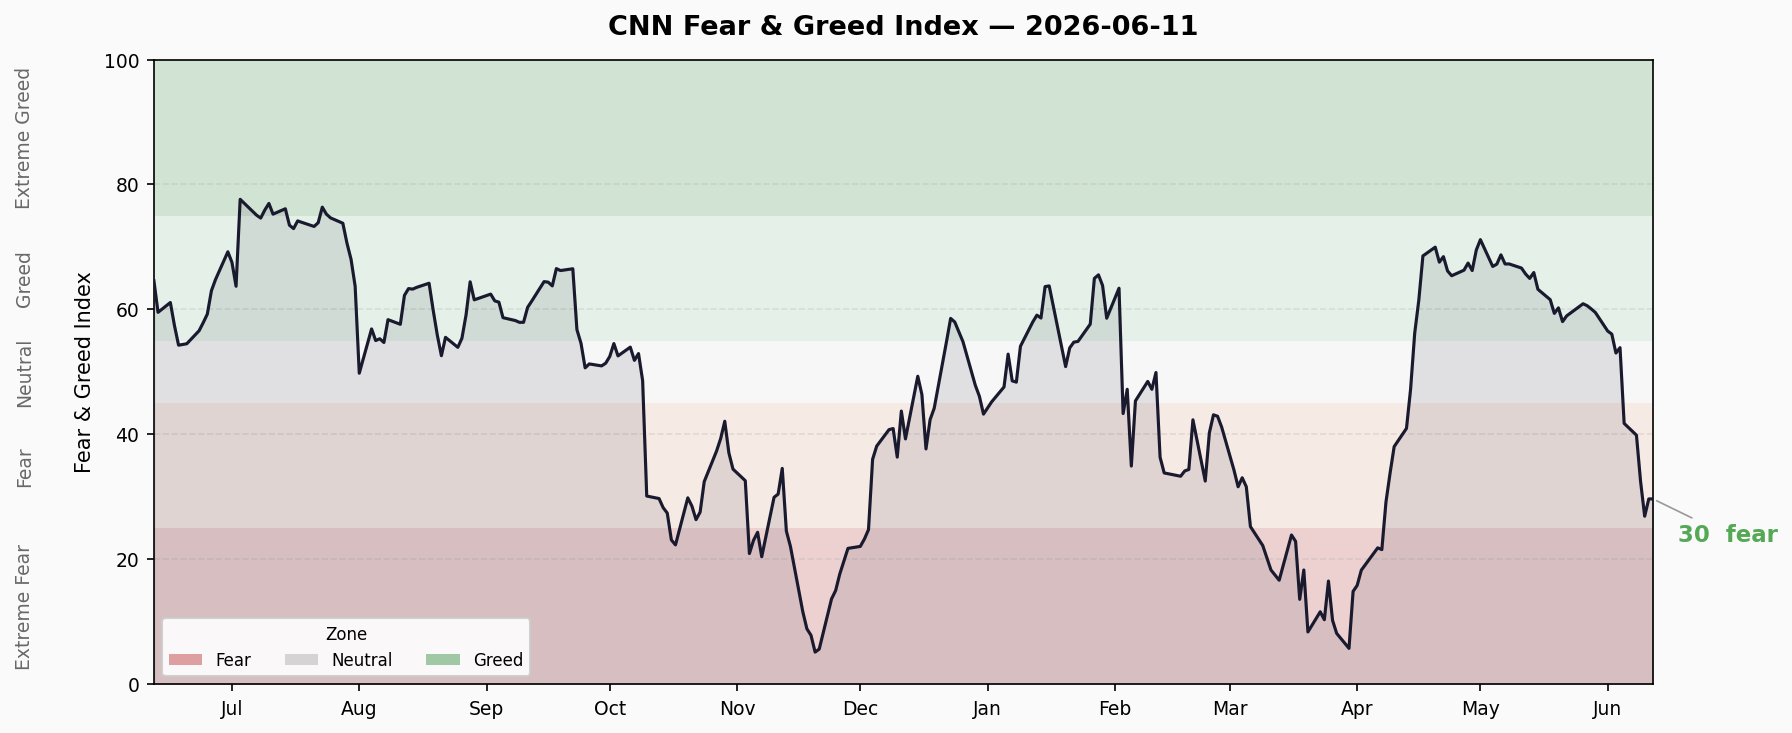
Current Score: 33 / 100 — Fear
| Metric | 10-Day Trend | Direction |
|---|---|---|
| Latest | 33.4 | — |
| Previous day | 33.4 | Flat |
| 10 days ago | 60.1 | ↓ ↓ ↓ |
| Trend | 60→56→53→42→33 | Steep decline |
Composite has plummeted from 60 (Greed) to 33 (Fear) in 10 days — a 44.4% drop. This is an extremely violent sentiment shift, typically seen during systemic market shocks.
7 Sub-Indicators Scan
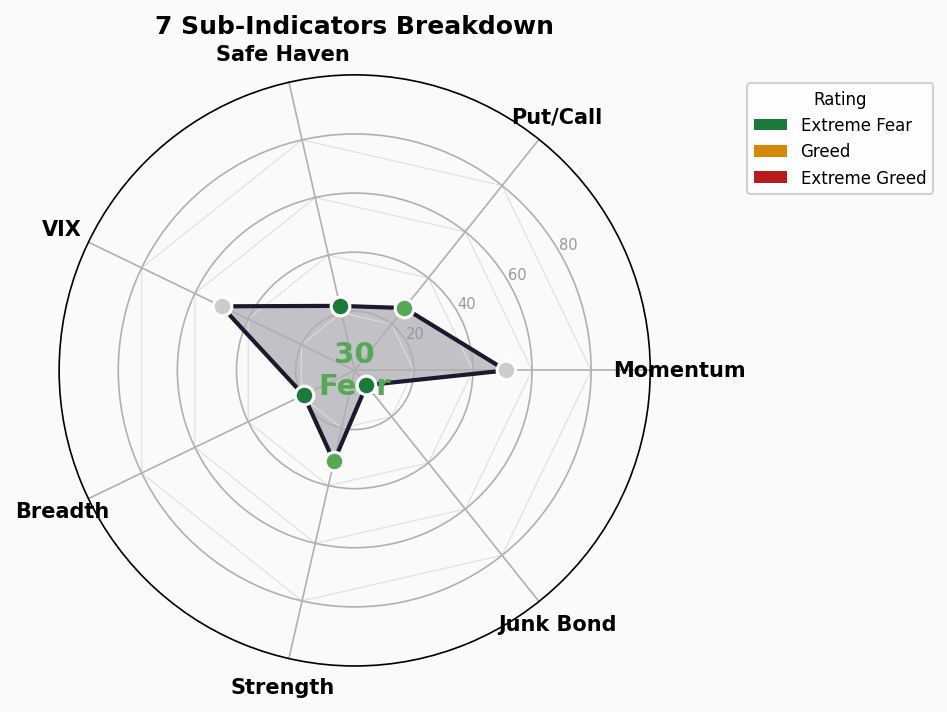
| # | Indicator | Score | Rating | Raw Value | Prev Value | Change |
|---|---|---|---|---|---|---|
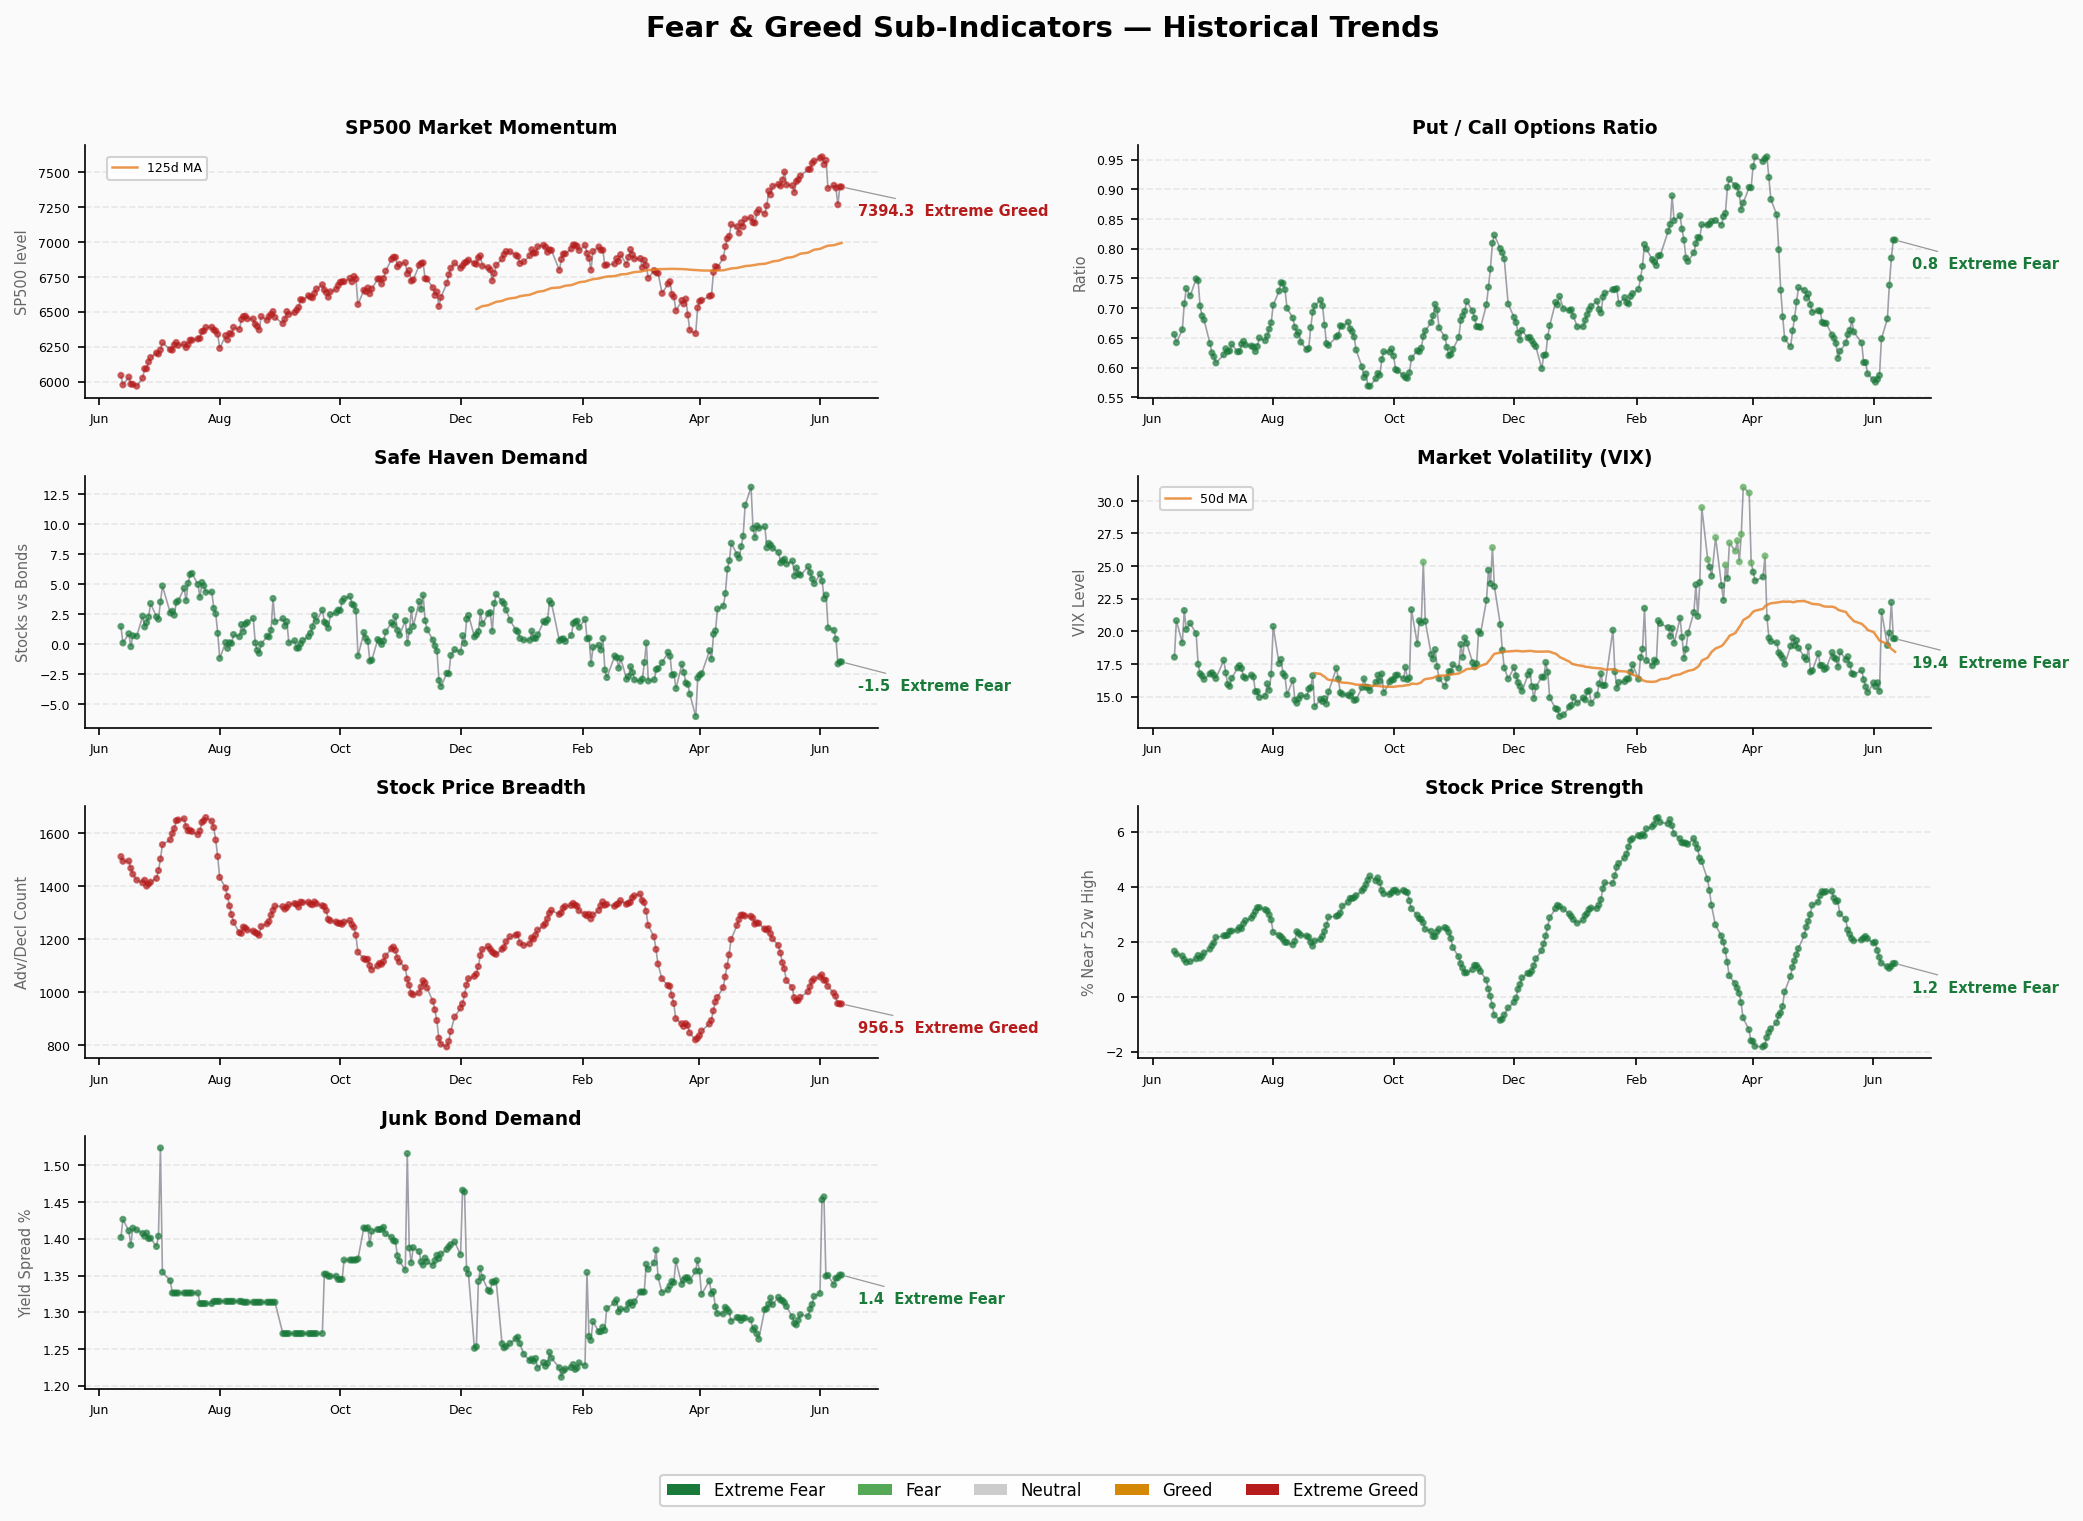
| 1 | Market Momentum (SPX) | 52 | Neutral | 7,387 | 7,406 | ↓ -19 pts |
| 2 | Stock Price Strength | 30 | Fear | 1.03 | 1.10 | ↓ -0.06 |
| 3 | Stock Price Breadth | 21 | Extreme Fear | 985 | 998 | ↓ -12 |
| 4 | Put/Call Options Ratio | 39 | Fear | 0.74 | 0.68 | ↑ +0.06 |
| 5 | Market Volatility (VIX) | 50 | Neutral | 19.87 | 19.87 | → Flat |
| 6 | Junk Bond Demand | 7 | Extreme Fear | 1.35 | 1.34 | ↑ +0.01 |
| 7 | Safe Haven Demand | 35 | Fear | 0.44 | 1.17 | ↓ -0.73 |
Structural Contradiction Analysis
🔴 Extreme Values
- Junk Bond Demand (6.8/100): At Extreme Fear. This measures investor appetite for high-yield debt — single-digit readings mean massive risk-off rotation. Historically only seen during 2022-2023 bear market depths.
- Stock Price Breadth (21.4/100): Also Extreme Fear. Advancing stocks continue shrinking, with only a handful of mega-caps propping up the index. Classic “narrow breadth bull market / broad bear market” signature.
⚡ Divergence Signals
- VIX vs Sentiment Divergence: VIX remains neutral (score 50, 19.87) while sentiment has plunged into Fear. This means volatility hasn’t caught up with current panic — either VIX is about to spike, or sentiment is oversold
- Put/Call vs Breadth Divergence: P/C ratio at 0.74 (below 1) suggests options market hasn’t entered extreme defense mode, but price breadth has severely deteriorated. This mismatch often means: retail hasn’t reacted yet, but smart money is already reducing exposure
- Junk Bond vs Market Momentum Divergence: SPX momentum still neutral (52) but junk bond demand collapsed to extreme fear (7). Bond markets typically lead equity markets — this divergence is highly bearish
🟡 Interval Persistence & Turning Points
- Composite crossed two full sentiment zones in 10 days: Greed (60) → Fear (33)
- Only 2 days in Fear zone so far (33.4 flat both days), no clear bottom signal yet
- Historical pattern: FNG below 30 typically leads to Extreme Fear (<25); if current trend continues, may breach that threshold within days
Trend Assessment
Short-term (1-5 days): Bearish
Composite accelerating downward, 5 of 7 sub-indicators in Fear or Extreme Fear, only 2 neutral. Zero indicators in Greed territory. Classic “panic spreading” pattern.
Medium-term (2-4 weeks): Watch for reversal opportunity
When FNG breaks below 25-30, contrarian analysis typically signals medium-term bounce opportunities. Current 33 hasn’t breached “Extreme Fear” threshold yet — wait for clearer signal.
Key Observations:
- Junk Bond extreme fear + Stock Breadth extreme fear = Credit and equity markets deteriorating simultaneously
- This combination historically precedes larger drawdowns, but also means policy stimulus (e.g., rate cuts) would trigger violent rallies
- VIX lagging behind is notable — either VIX is about to spike (panic spreading) or current fear is overreaction