CNN Fear & Greed Index Analysis 2026-06-09
CNN Fear & Greed Index Analysis — 2026-06-09
1. Composite Index
| Metric | Value | Rating | Change |
|---|---|---|---|
| Current Composite | 40.1 | Fear | ↓ -1.9 vs prior close |
| Prior Close | 42.1 | Fear | |
| 1 Week Ago | 56.5 | Greed | -16.4 |
| 1 Month Ago | 67.3 | Greed | -27.2 |
| 1 Year Ago | 61.8 | Greed | -21.7 |
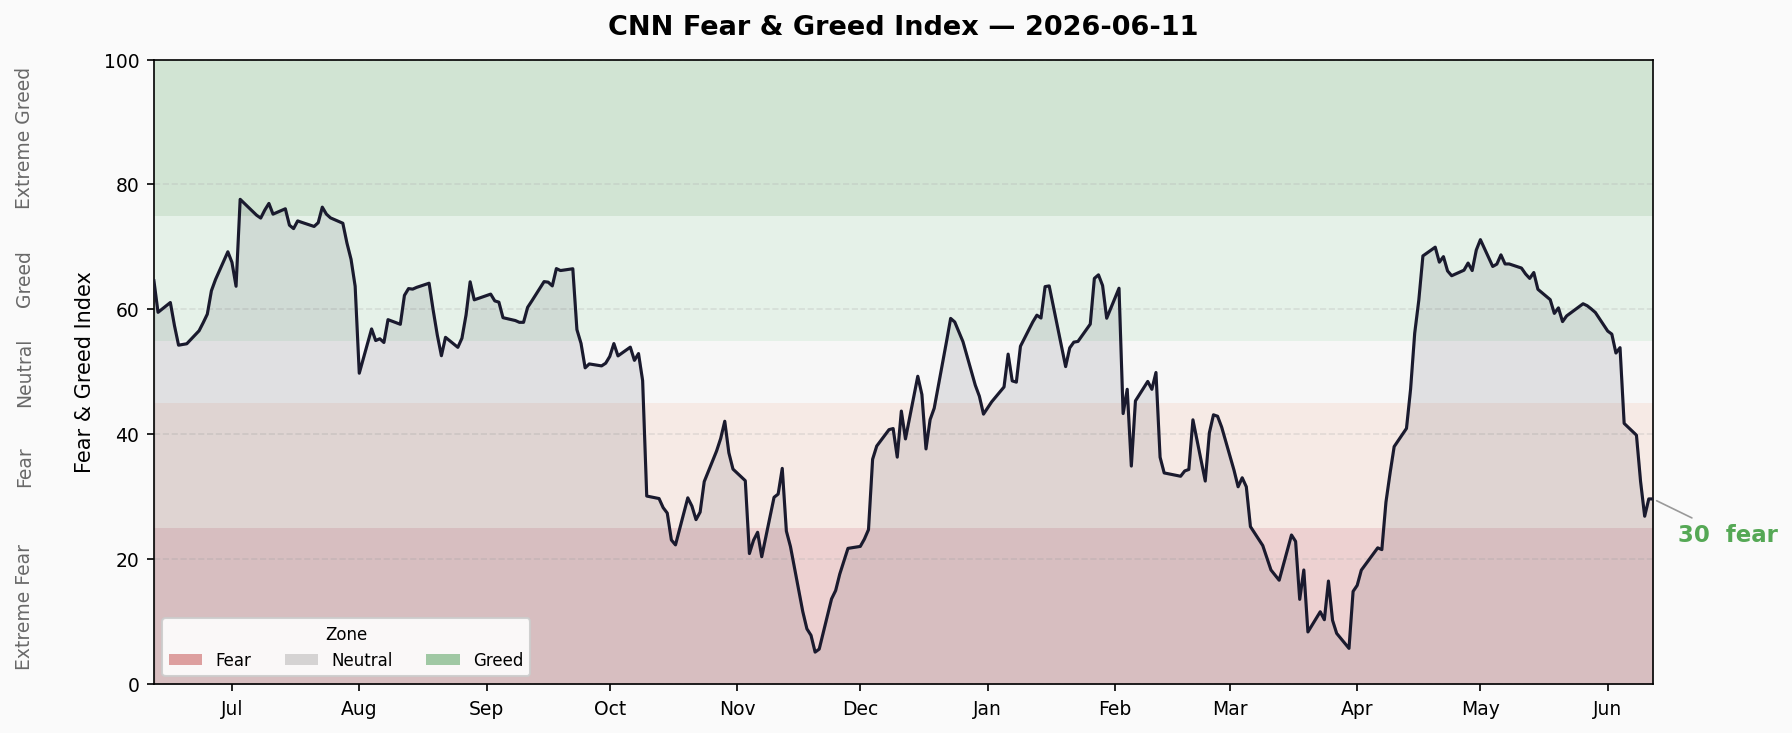
Trend: 📉 Sustained decline. Dropped from 60+ greed zone to current 40 fear zone, approximately -20 points in 10 days.
Last 10 Trading Days:
| Date | Index | Rating |
|---|---|---|
| 05-27 | 60.6 | Greed |
| 05-28 | 60.1 | Greed |
| 05-29 | 59.5 | Greed |
| 06-01 | 56.5 | Greed |
| 06-02 | 56.1 | Greed |
| 06-03 | 53.0 | Neutral |
| 06-04 | 53.9 | Neutral |
| 06-05 | 41.8 | Fear |
| 06-08 | 40.1 | Fear |
| 06-09 | 40.1 | Fear |
Dwell Time: 3 trading days in Fear zone (since 6/5). Rapid transition — greed to fear in just 3 days (6/2 → 6/5).
2. Seven Sub-Indicators
| Indicator | Score | Rating | Raw Value | Trend |
|---|---|---|---|---|
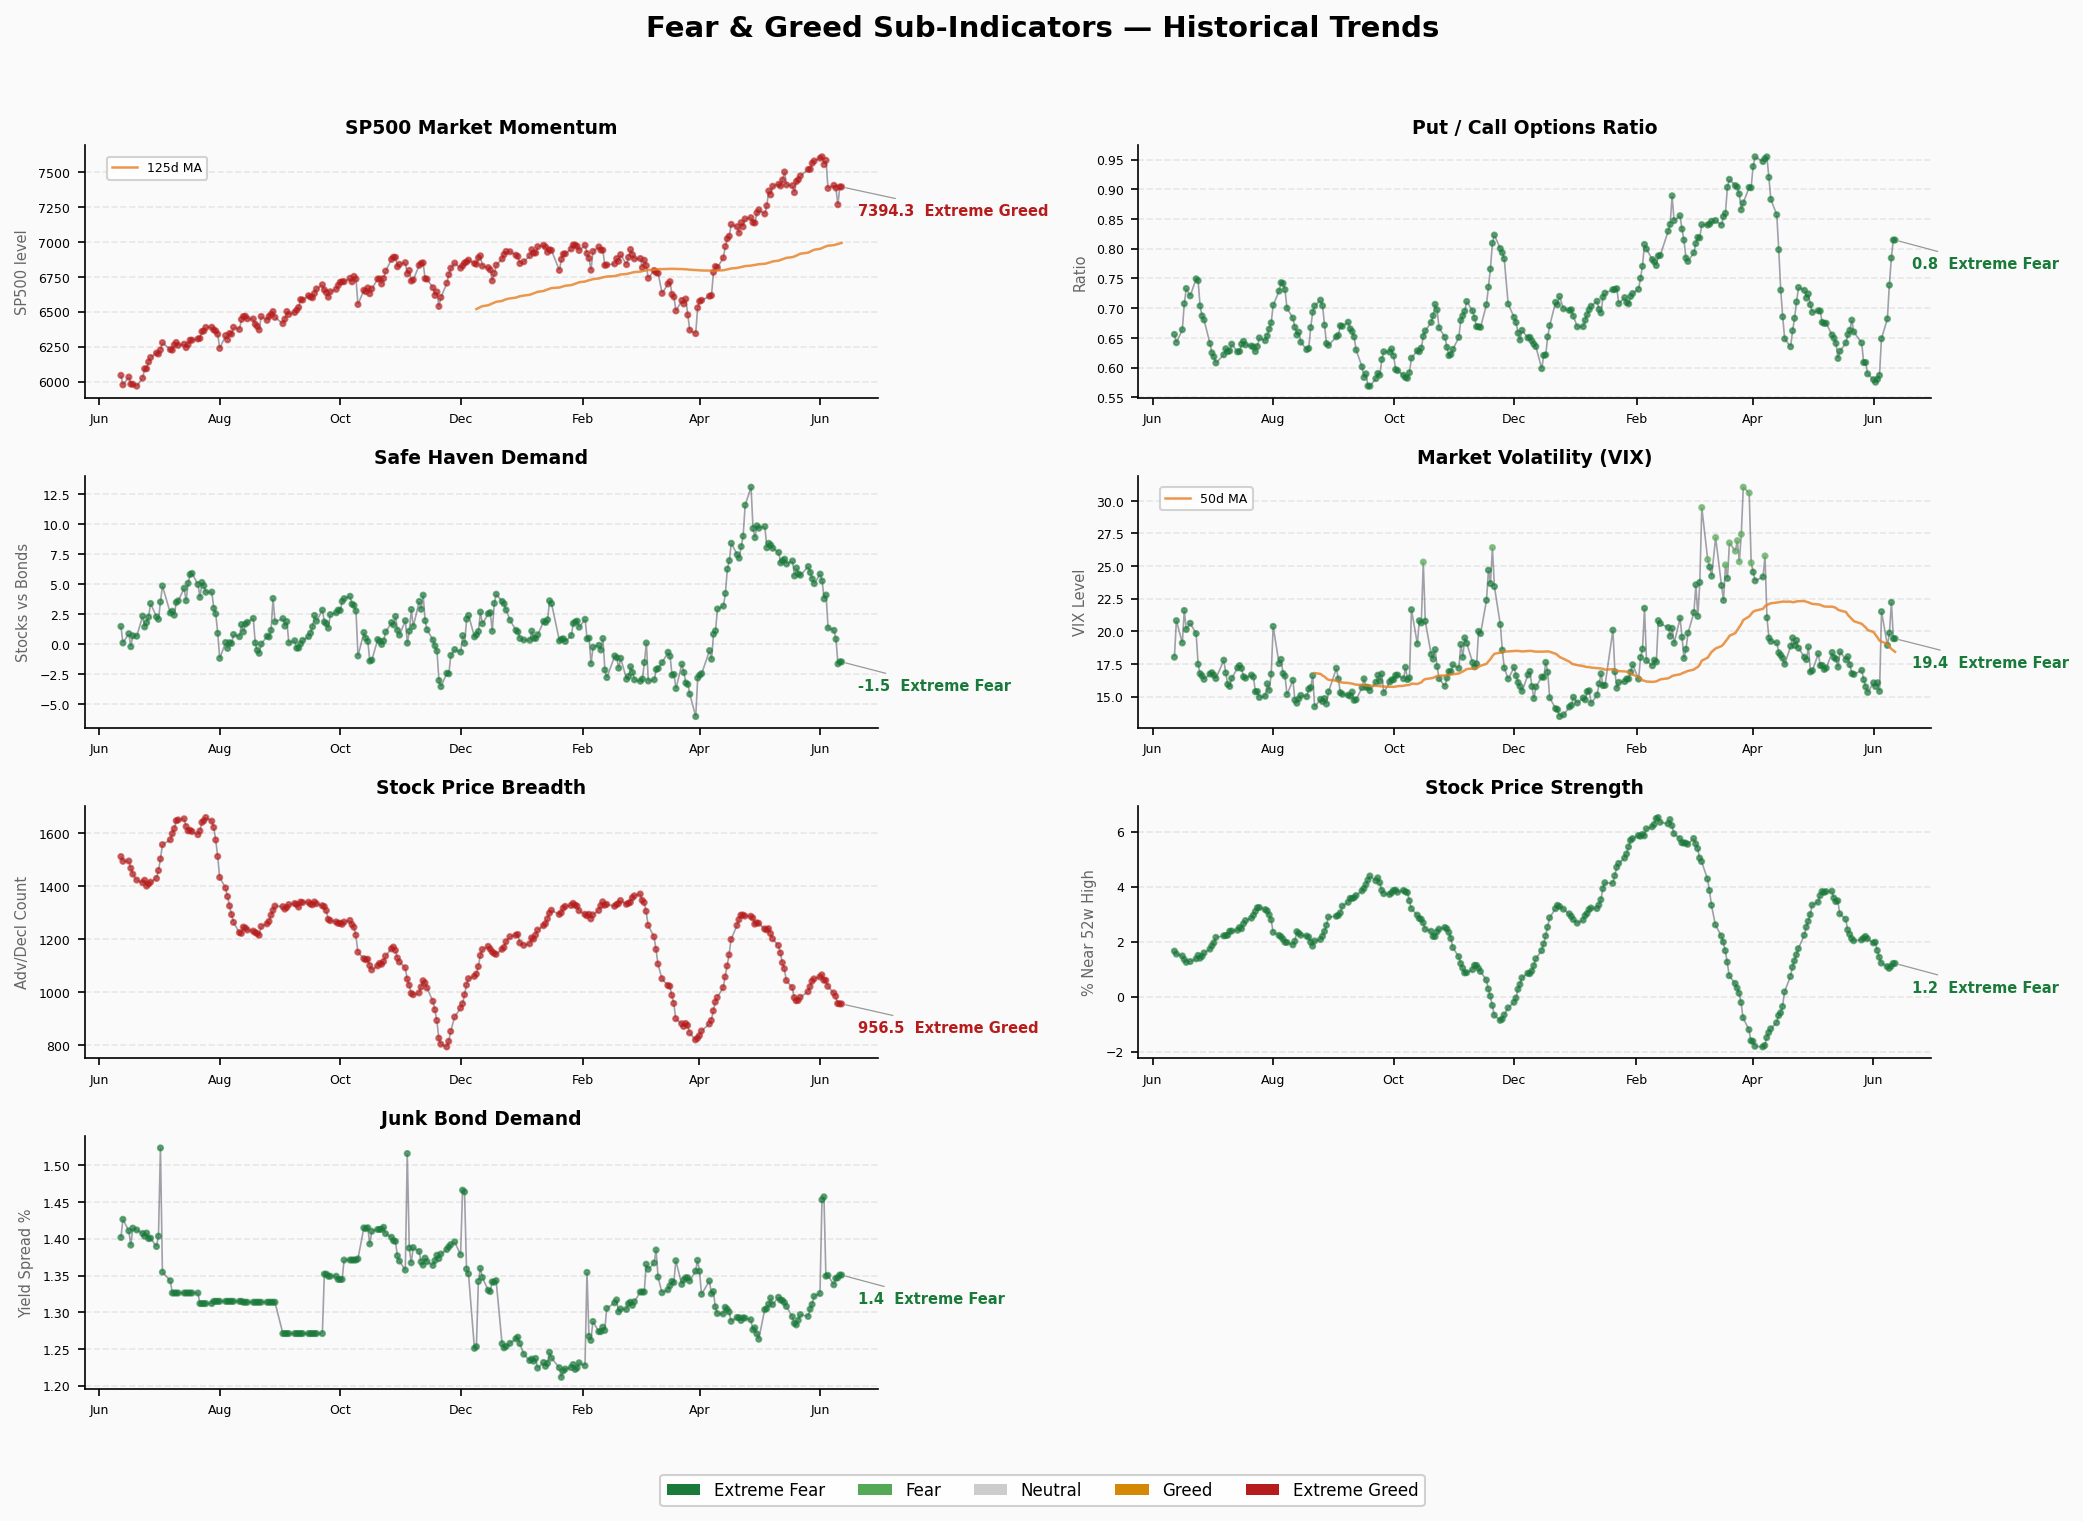
| Market Momentum (S&P500 vs 125MA) | 64.6 | 🟢 Greed | S&P 7405.7 | ↑ Holding high |
| Stock Price Strength (New Highs vs Lows) | 30.8 | 🟡 Fear | 1.10 | ↓ Weakening |
| Stock Price Breadth (Advance-Decline) | 24.0 | 🔴 Extreme Fear | 997.9 | ↓ Deeply depressed |
| Put/Call Options Ratio | 58.0 | 🟢 Greed | 0.68 | → Neutral-bullish |
| Market Volatility (VIX) | 50.0 | ⚪ Neutral | 18.92 | → Stable |
| Junk Bond Demand (IG-OAS) | 10.6 | 🔴 Extreme Fear | 1.34 | ↓ Credit deterioration |
| Safe Haven Demand (Bonds vs Stocks) | 42.8 | 🟡 Fear | 1.17 | ↓ Haven demand fading |
3. Structural Divergence Analysis
Extreme Value Signals
- Junk Bond Demand at 10.6 (Extreme Fear): Credit markets are issuing strong warnings. Widening IG-OAS spreads indicate bond investors are fleeing risk assets — credit contraction signal is unambiguous.
- Market Breadth at 24 (Extreme Fear): Advance-decline line in extreme territory — most stocks declining with only a few mega-caps propping up the index. Classic “index illusion” — S&P looks like 7400 but the majority of stocks are already weak.
Divergence Signals
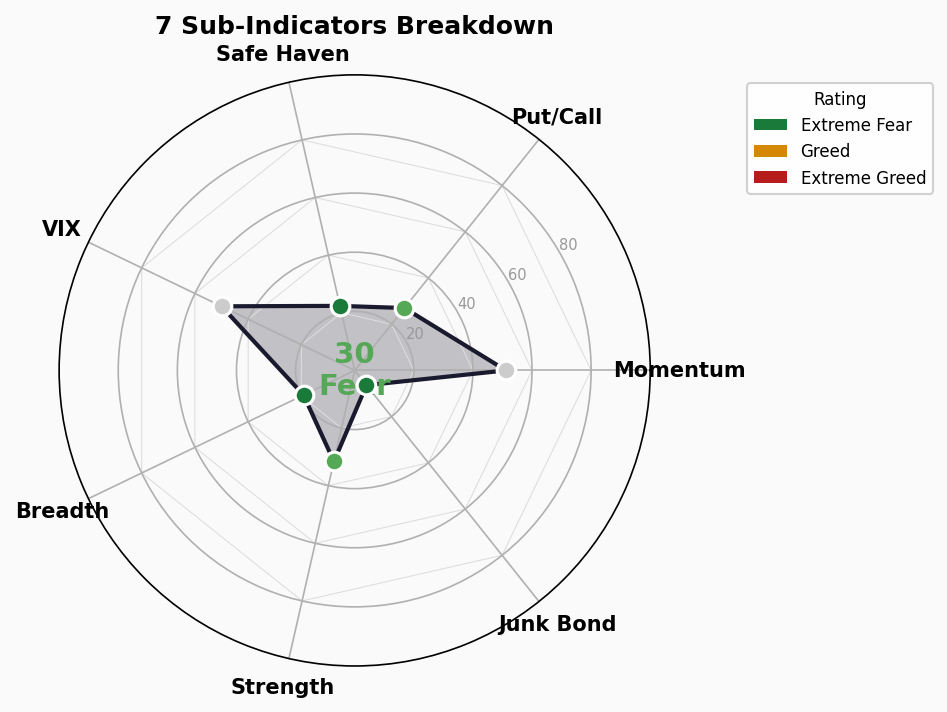
Momentum (64.6) vs Breadth (24.0) — 40.6 point gap: S&P price still above 125MA, but participation collapsing. This is one of the most dangerous divergences — the index holds while internals rot. Historically, this type of divergence leads market declines by 2-4 weeks.
Put/Call (58) vs Junk Bond (10.6) divergence: Options market neutral-bullish (P/C ratio 0.68), but credit market in panic. Options investors haven’t reacted yet, but smart money is already exiting.
Market Momentum (Greed) vs Price Strength (Fear): S&P absolute level above 125MA, but new-high/new-low ratio persistently declining — the “absolute height” is an illusion as fewer leading stocks participate.
4. Trend Assessment
Zone Analysis
- Currently in Fear zone (40.1), 3 days in
- Last Fear zone: April 2026 (bottomed around 25)
- Greed(60+) to Fear(40) in just 3 trading days — strong downward momentum
Turn Signals
- No stabilization signal yet: 4 of 7 sub-indicators still in downtrend
- Potential stabilization conditions: VIX above 25+ (panic confirmation) or junk bond spread narrowing (credit recovery)
- Key support: FNG 30 (Extreme Fear threshold) — breach could trigger April-level panic
Overall Assessment
Market is in a rapid greed-to-fear transition. Structural divergence is extreme: a handful of mega-cap techs maintain index surface stability, while market breadth, credit markets, and defensive indicators have all deteriorated. This is not a simple pullback — it’s systemic internal deterioration.
⚠️ Caution: When FNG drops from 60+ to 40 with credit markets deteriorating first, historically ~60% of cases continue below 30 (Extreme Fear). Current positioning should skew defensive.