CNN Fear & Greed Analysis 2026-06-08
Composite index 42.1 (Fear), -12.6 points in one day; Junk Bond Demand at extreme fear (5.8); Put/Call still extreme greed (76); structural divergence intensifies
Data date: 2026-06-05 (latest update) | Index: 42.1 / 100 (Fear)
Composite Index Trend
| Metric | Value | Direction |
|---|---|---|
| Latest Composite | 42.1 (Fear) | 📉 -12.6 points single day |
| Previous Close | 54.7 (Neutral) | |
| 1 Week Ago | 59.5 (Greed) | |
| 1 Month Ago | 67.3 (Greed) | |
| 1 Year Ago | 58.0 (Greed) |
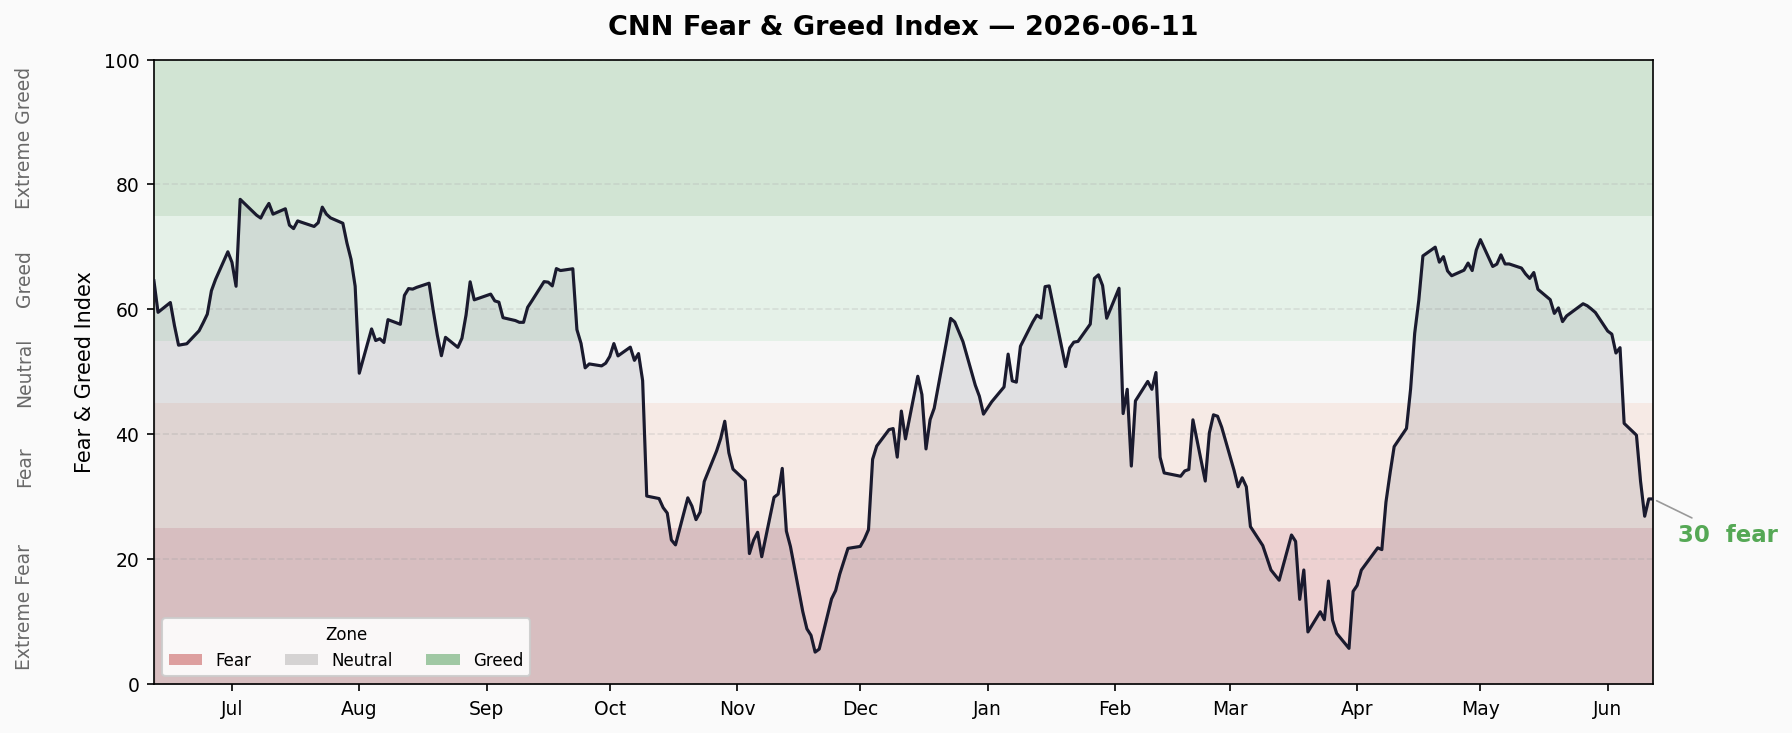
10-Day Trend
05-26: 60.9 ████████████████████▋  Greed
05-27: 60.6 ████████████████████▌  Greed
05-28: 60.1 ████████████████████▏  Greed
05-29: 59.5 ███████████████████▊   Greed
06-01: 56.5 █████████████████▊     Greed
06-02: 56.1 █████████████████▋     Greed
06-03: 53.0 █████████████████      Neutral
06-04: 53.9 █████████████████▏     Neutral
06-05: 42.1 █████████████▋         Fear ← ⚠️ Cliff drop
06-06: 42.1 █████████████▋         Fear
Trend assessment: From 60.9 to 42.1, a decline of 18.8 points in 10 days — sentiment shifted rapidly from Greed to Fear. The single-day plunge of 12.6 points on June 5 is the largest daily drop in 30 days, indicating a nonlinear sentiment collapse.
7 Sub-Indicator Scan
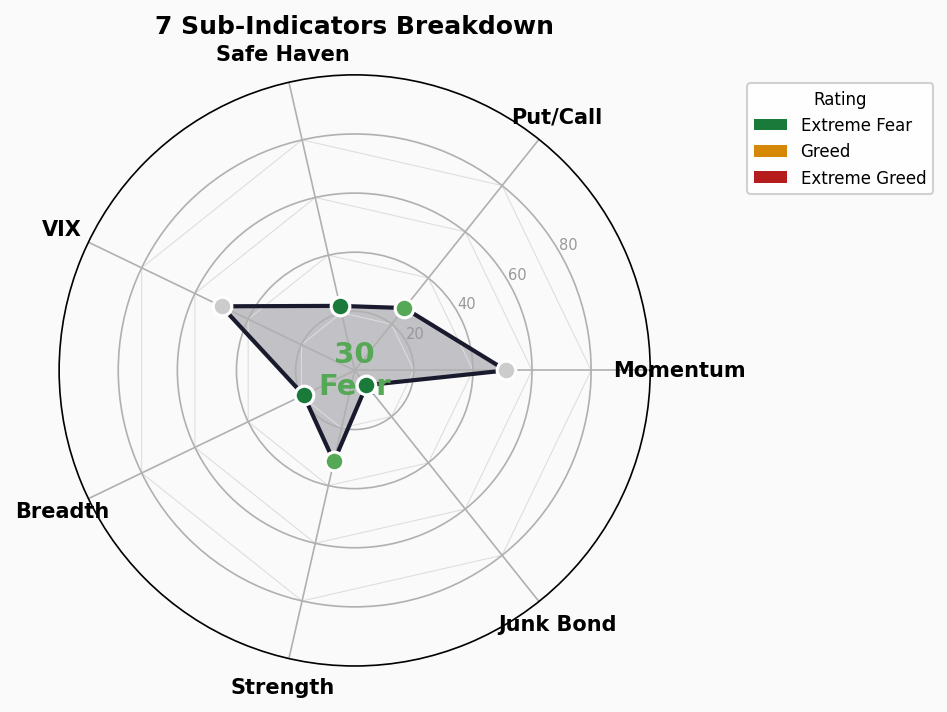
| Sub-Indicator | Score | Rating | Signal Interpretation |
|---|---|---|---|
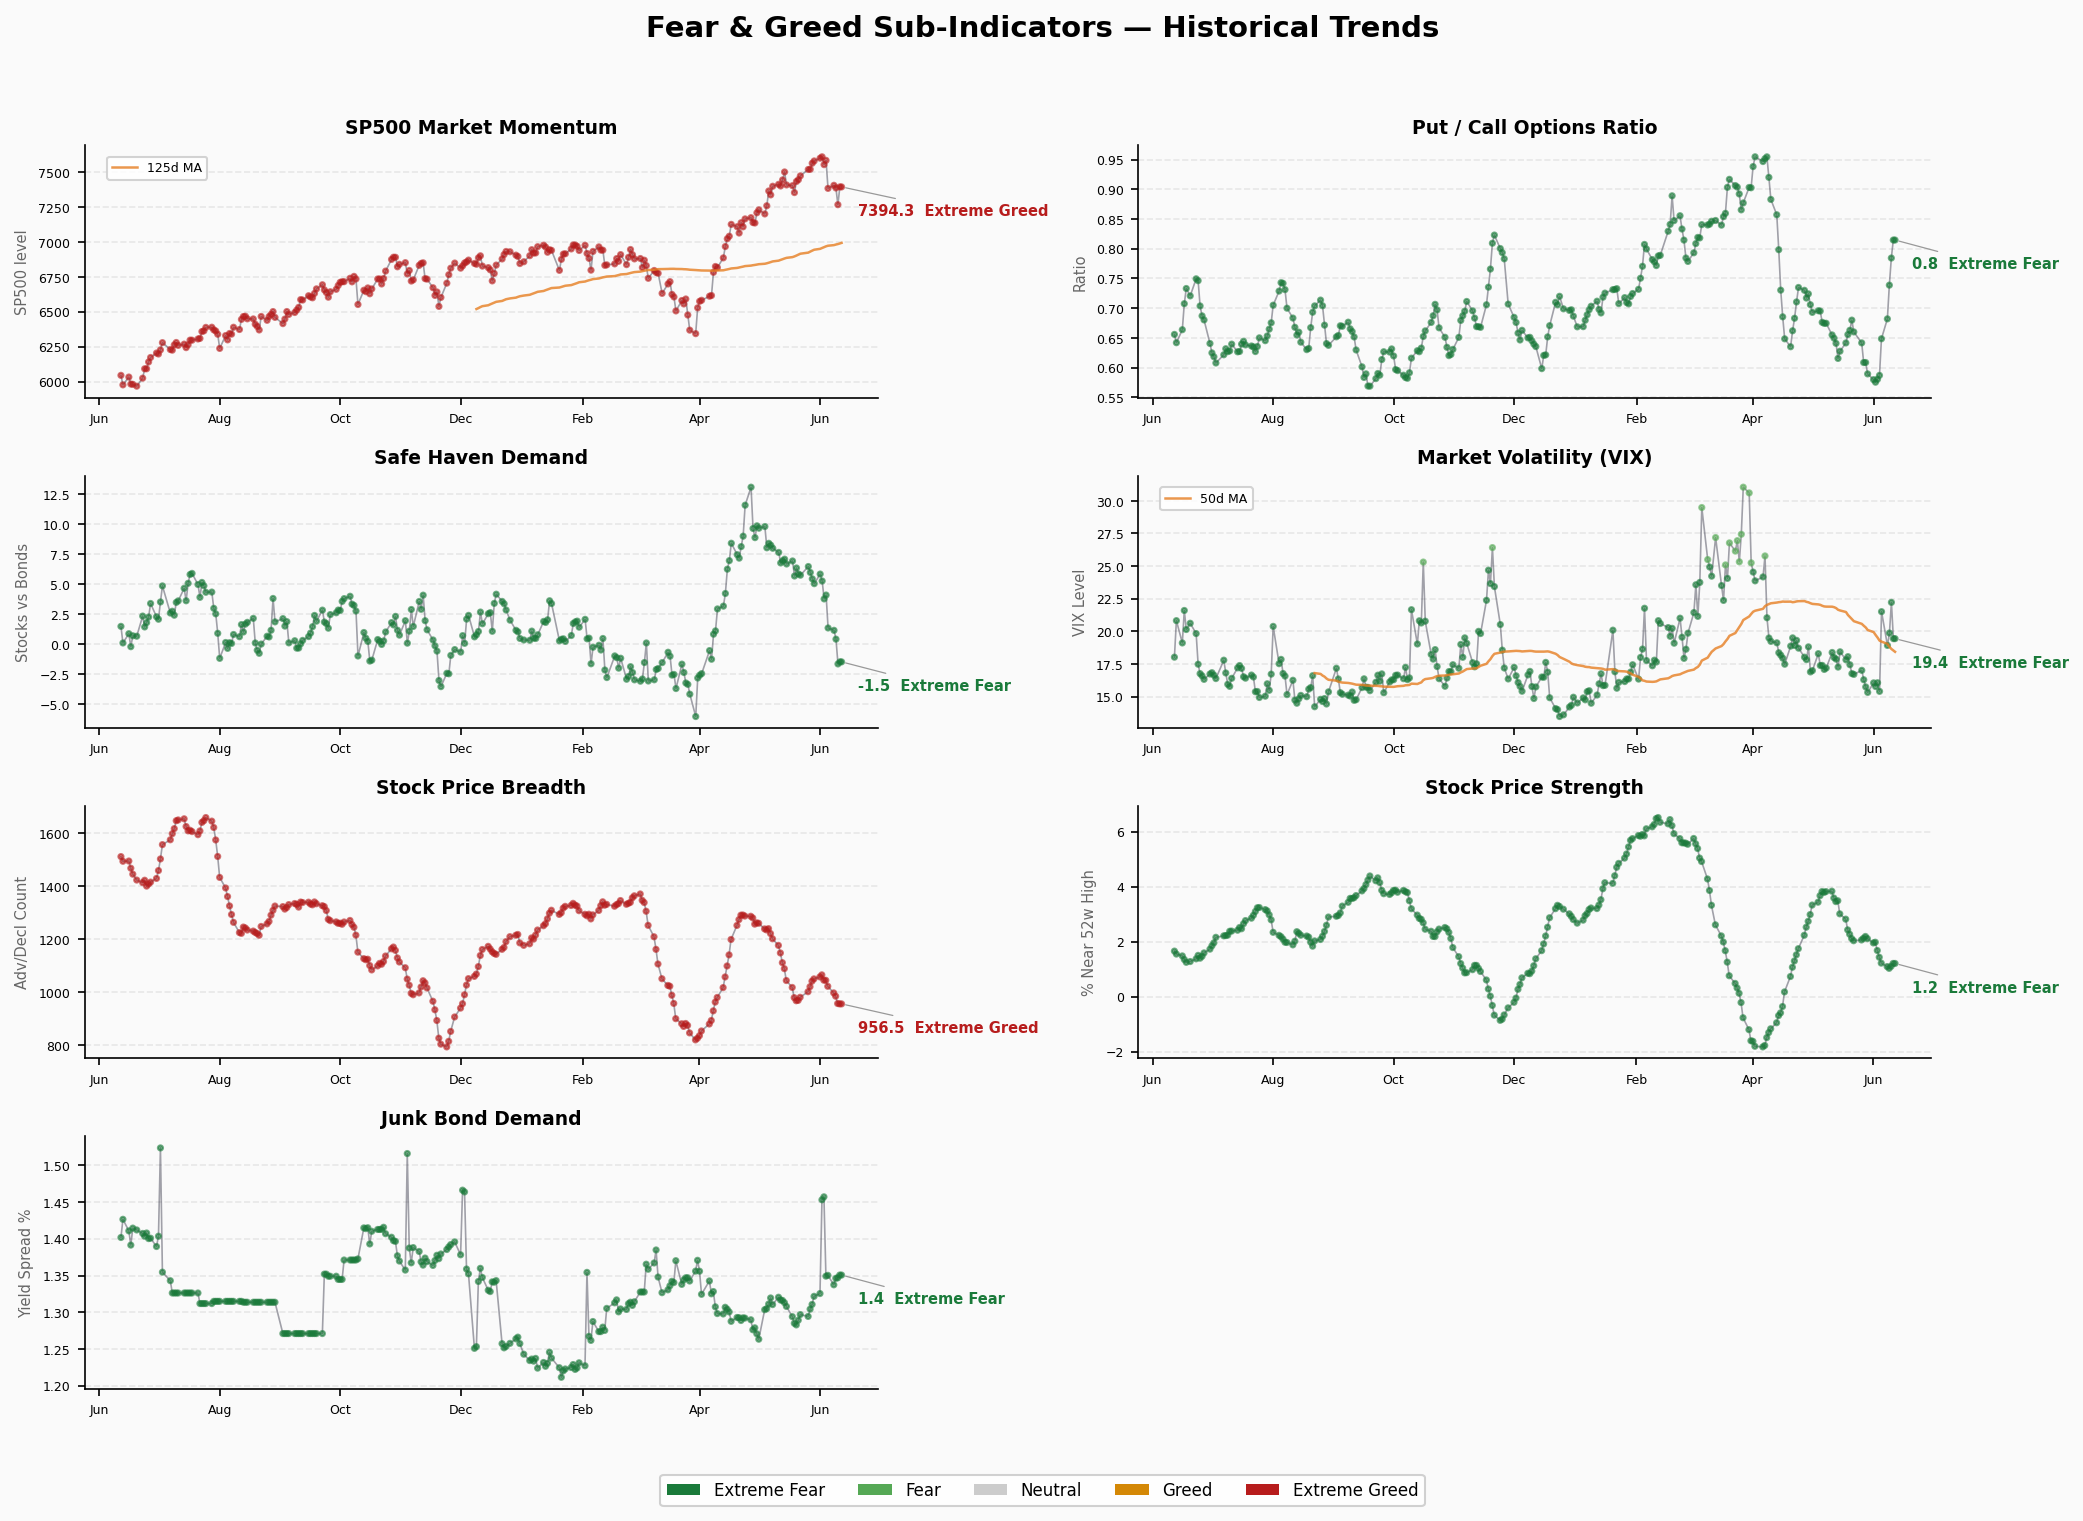
| Market Momentum (S&P 500) | 58.4 | 🟡 Greed | S&P still above 125-day MA but lead narrowing |
| Stock Price Strength | 31.2 | 🔴 Fear | 52-week high/low ratio deteriorating, advancing issues declining |
| Stock Price Breadth | 28.0 | 🔴 Fear | A/D line weakening significantly, market breadth narrowing |
| Put/Call Options | 76.0 | 🟢 Extreme Greed | Put demand extremely low, market under-hedged |
| Market Volatility (VIX) | 50.0 | ⚪ Neutral | VIX in normal range |
| Junk Bond Demand | 5.8 | 🔴 Extreme Fear | Credit market severely stressed, HY spreads widening aggressively |
| Safe Haven Demand | 45.0 | 🔴 Fear | Capital flowing from Treasuries to equities, low flight-to-safety |
Structural Divergence Analysis
🔴 Extreme Value Scan
Junk Bond Demand (5.8 / 100) — Extreme Fear
- The most extreme signal across all indicators. Credit markets are sounding alarms — widening high-yield spreads signal rising corporate default risk.
- This creates a severe divergence with Market Momentum (58.4): equities still rallying while credit markets price in risk.
Put/Call Ratio (76.0 / 100) — Extreme Greed
- Put/call ratio at extremely low levels indicates retail and institutional hedging against downside is critically insufficient.
- Combined with credit market distress, this setup means any catalyst event could trigger a dual shock of missing hedges + tightening credit.
⚠️ Divergence Signals
| Divergence Pair | Status | Risk Level |
|---|---|---|
| Junk Bonds vs Market Momentum | Credit deteriorating + equities still strong | 🔴 High Risk |
| Put/Call vs Price Breadth | Under-hedging + narrowing breadth | 🟡 Medium Risk |
| Safe Haven vs Composite | Low flight-to-safety + sentiment turning fearful | 🟡 Medium Risk |
Trend Assessment
- Range dwell time: Sentiment switched from Greed to Fear in just 2 days (June 3→5). Historically, rapid transitions often indicate external shock (geopolitics, surprise data release).
- Turn indicator: Composite index flatlined at 42.1 for 2 consecutive days. Failure to bounce above 50 risks entering a Fear → Extreme Fear descent channel.
- Maximum risk: The junk bond + Put/Call combination is extremely dangerous — credit markets already warning, but equity markets haven’t priced it in.
Conclusion
Market sentiment experienced a cliff collapse on June 5, with the composite index plunging 12.6 points in a single day into Fear territory. The most alarming aspect isn’t the composite index itself, but the structural divergence between sub-indicators:
Credit markets (Junk Bond 5.8) are already saying “danger,” but equity hedging positions (Put/Call 76.0) are still saying “safe.”
This combination historically appears on the eve of crises — credit markets lead by 1-3 months, while equity hedging adjusts at the last moment. At this stage, heightened vigilance and increased hedging positions are the prudent course of action.