CNN Fear & Greed Analysis 2026-06-07
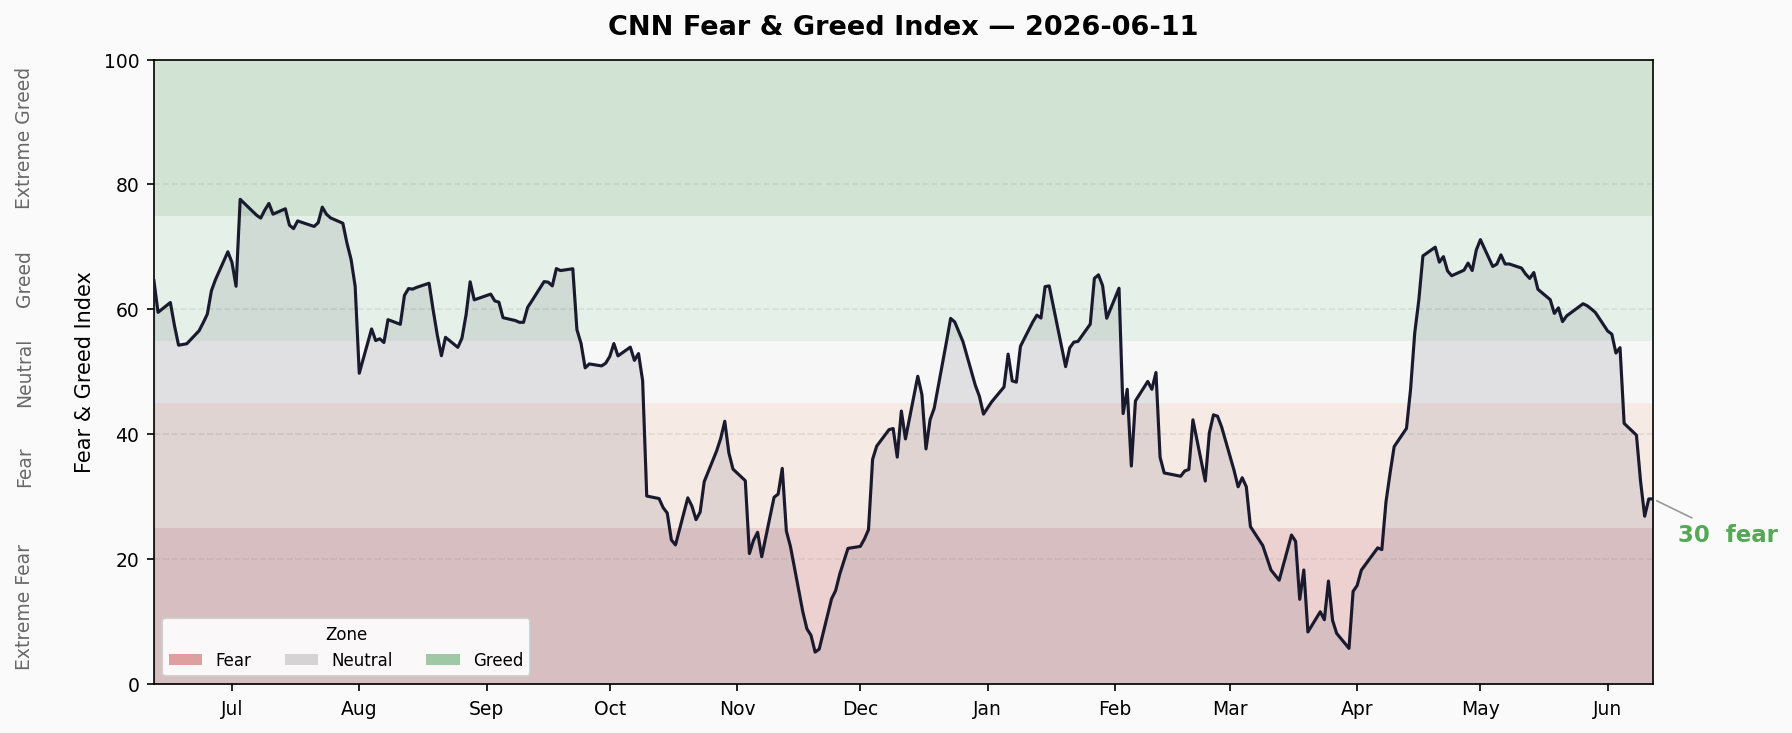
Composite 42.1 Fear, down sharply from 54.7; junk bond demand 5.8 extreme fear vs Put/Call 76 extreme greed — sharp divergence
Composite Index Trend
| Metric | Value | Rating |
|---|---|---|
| Composite | 42.1 | 🟡 Fear |
| Previous Close | 54.7 | Neutral |
| 1 Week Ago | 59.5 | Greed |
| 1 Month Ago | 67.3 | Greed |
| 1 Year Ago | 58.0 | Greed |
Trend Direction: Consecutive decline across all observation periods — 59.5 → 54.7 → 42.1. Crossed from Greed into Fear territory. Deceleration accelerating.
Seven Sub-Indicators Scan
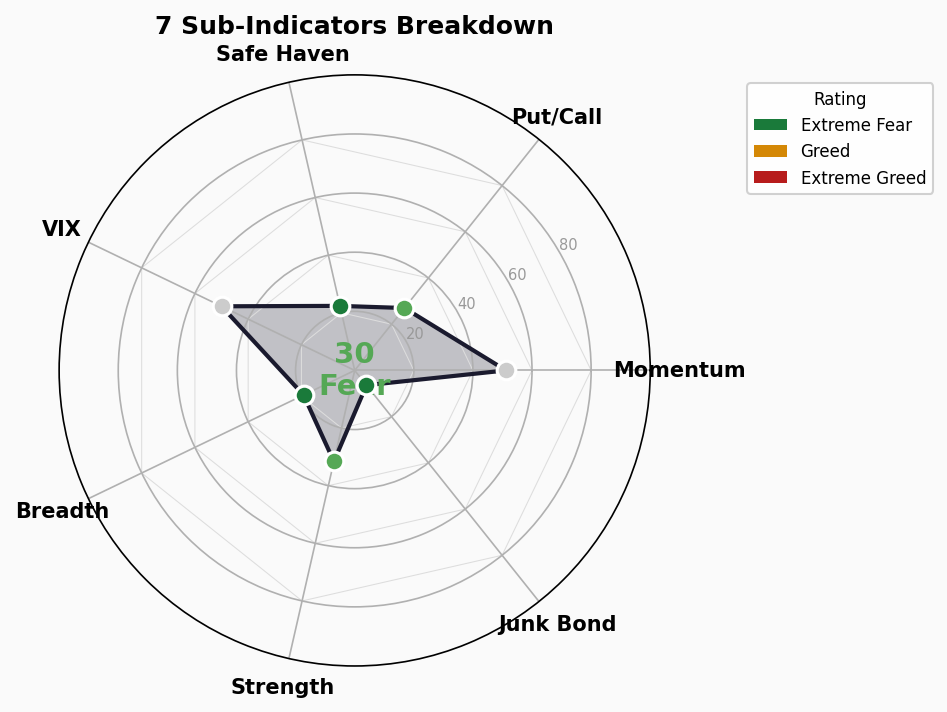
| # | Indicator | Score | Rating | Raw Value | Direction |
|---|---|---|---|---|---|
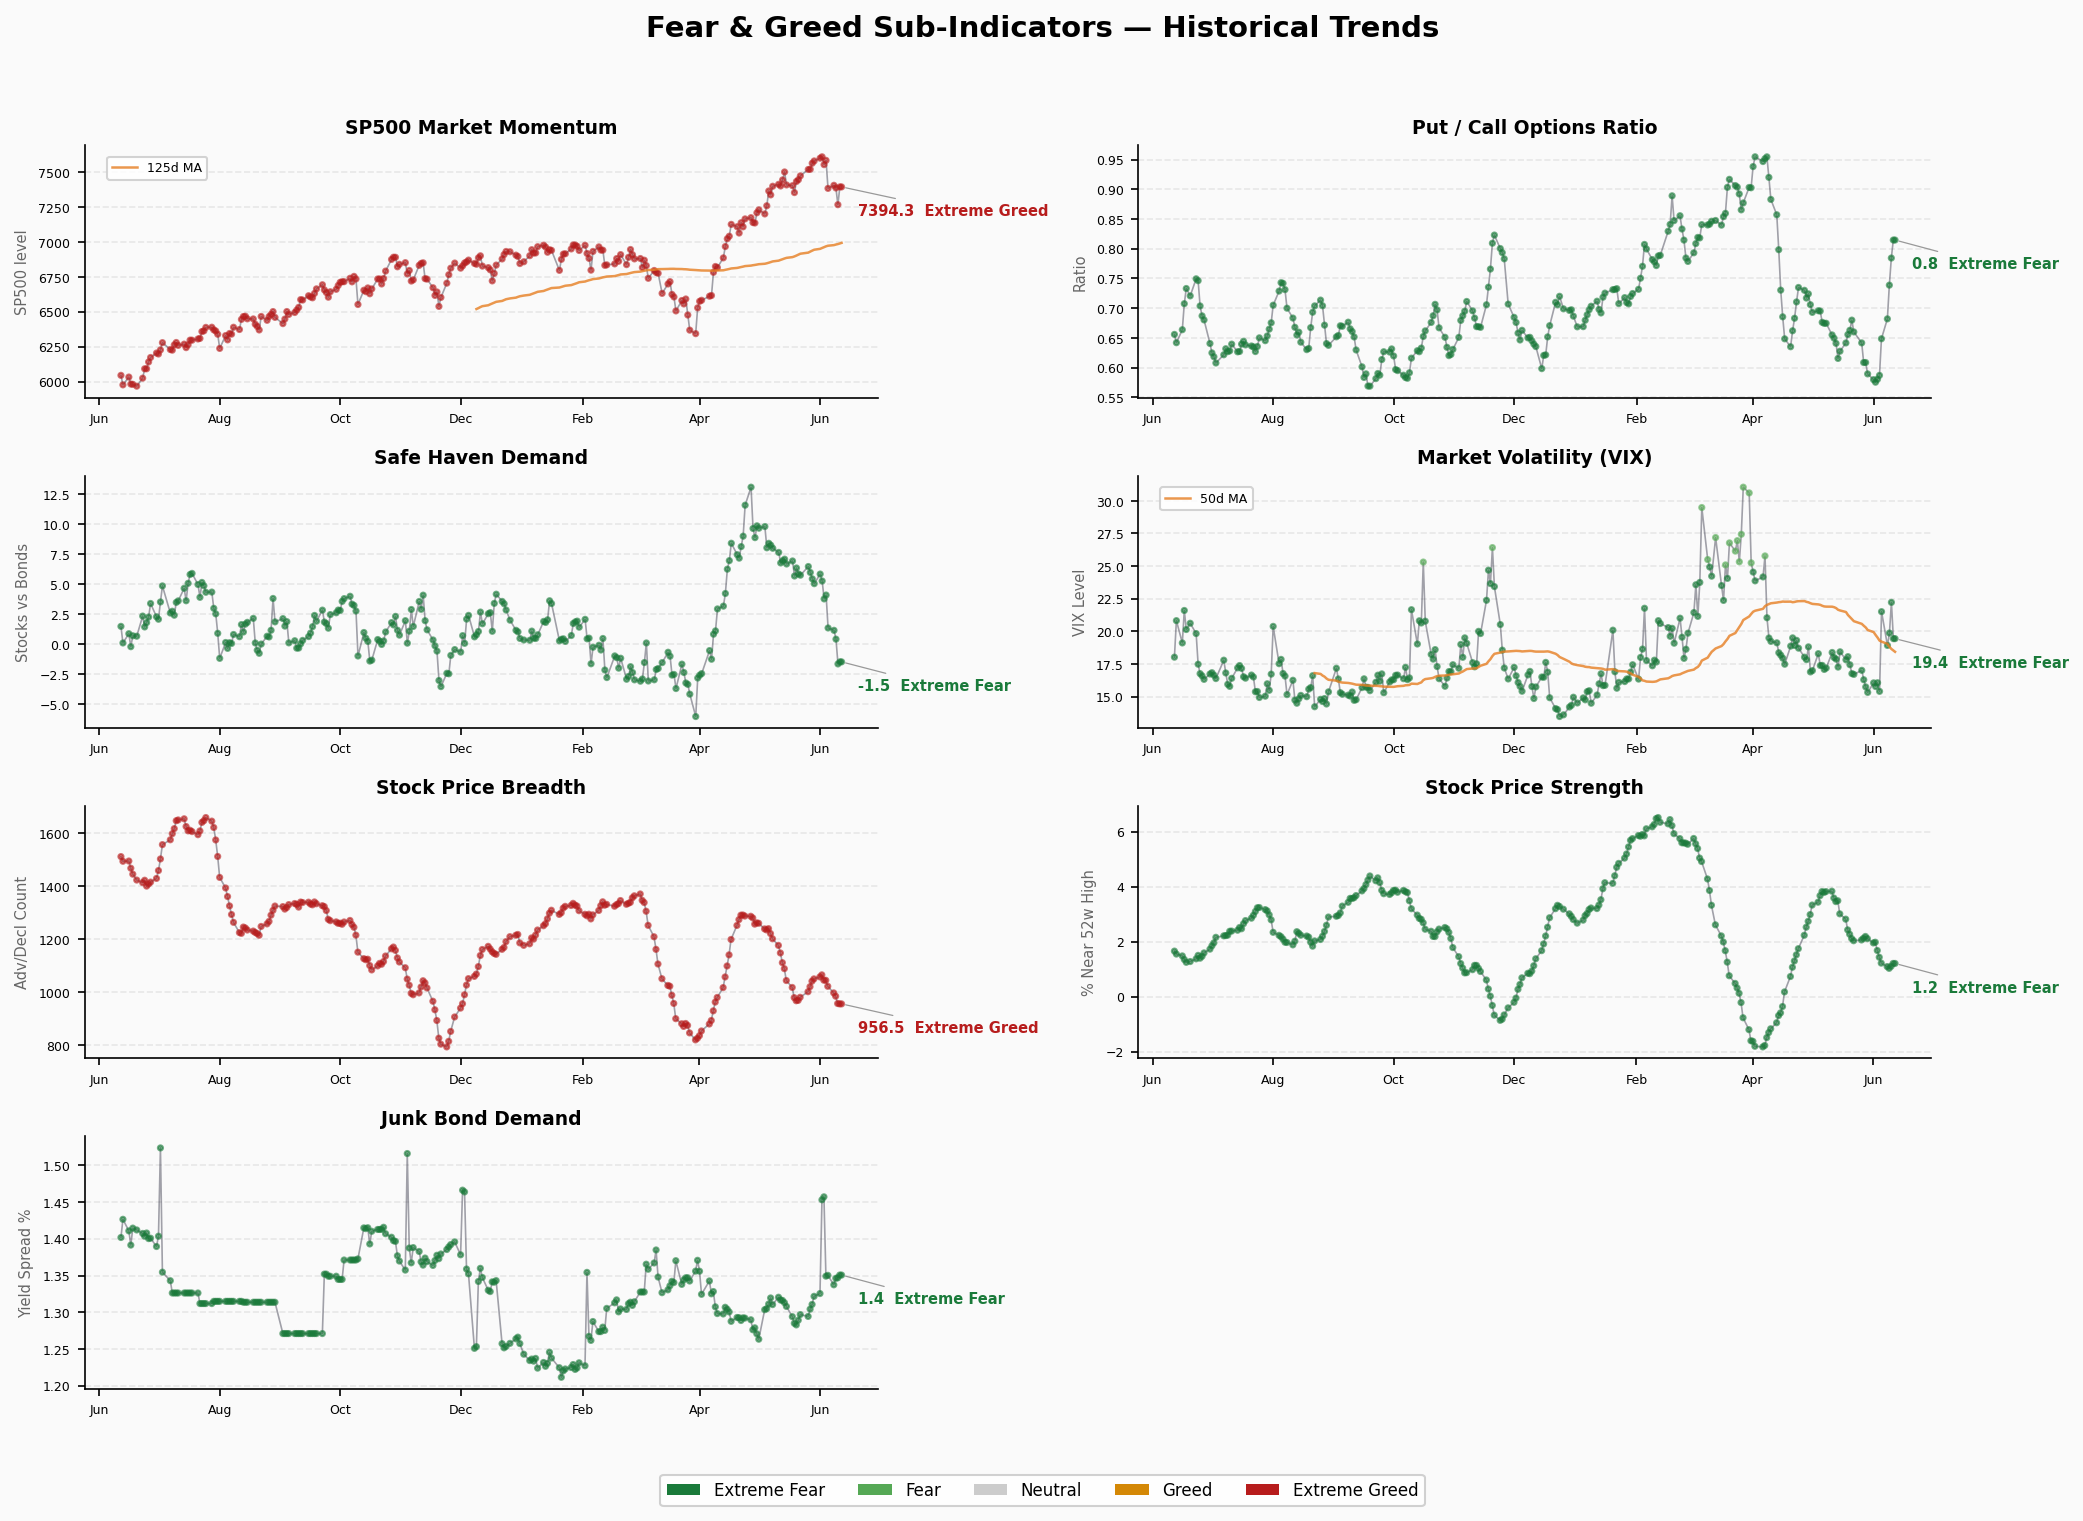
| 1 | SP500 Momentum | 58.4 | 🟢 Greed | 7383.7 | ↘ Retreating from extreme greed |
| 2 | Price Strength | 31.2 | 🟡 Fear | 1.22 | ↓ Continuing decline |
| 3 | Price Breadth | 28.0 | 🟡 Fear | 1022.8 | ↓ Pulling back from highs |
| 4 | Put/Call Ratio | 76.0 | 🔴 Extreme Greed | 0.649 | → Holding elevated |
| 5 | Junk Bond Demand | 5.8 | 🔴 Extreme Fear | 1.35 | ↓ Deteriorating further |
| 6 | Safe Haven Demand | 45.0 | 🟡 Fear | 1.38 | ↓ Sharp decline |
| 7 | Market Volatility (VIX) | 50.0 | ⚪ Neutral | 21.51 | ↗ Bouncing from 15.4 |
Structural Divergence Analysis
🔴 Extreme Value Scan
| Indicator | Score | Zone | Signal |
|---|---|---|---|
| Put/Call | 76.0 | Extreme Greed zone (near >80) | Retail excessively bullish on options |
| Junk Bond Demand | 5.8 | Extreme Fear zone (<20) | Credit market pricing extreme risk |
| SP500 Momentum | 58.4 | Retreating from extreme greed | Momentum fading |
⚠️ Core Divergence: Credit Market vs Options Market
This is today’s most alarming signal:
- Junk Bond Demand 5.8 (Extreme Fear): Credit markets pricing extreme risk. Junk bond spreads continuing to widen — institutional capital fleeing risk assets.
- Put/Call 76.0 (Extreme Greed): Retail still piling into call options. Sentiment extremely bullish.
Historical precedent: When credit markets (smart money) and options markets (retail) diverge this extremely, the credit market is usually right. Similar structures appeared in early 2008 and February 2020.
📊 Other Divergences
- SP500 Momentum (58.4 Greed) vs Price Strength (31.2 Fear): Index still elevated but individual stock strength turning negative — classic index propping with underlying weakness.
- VIX bouncing from 15.4 to 21.5: Volatility mean-reverting from extremes, typically accompanies market corrections.
- Safe Haven Demand declining: From 4.11 to 1.38 — capital flowing out of havens, possibly profit-taking after a run.
Trend Assessment
Duration in Current Zone
- Composite dropped 25 points in one month (67.3 → 42.1), a fast descent.
- Currently early in the Fear zone (25-45). Continued decline would push into Extreme Fear (<25).
Turning Indicators
- VIX rebound: From extreme low (15.4) to 21.5 — volatility mean-reversion signal, typically precedes market turbulence.
- Safe Haven decline: Suggests capital rotating out of bonds — could be profit-taking or a false signal.
- Junk Bond deterioration: 5.8 is near 1-year lows. Credit tightening risk remains elevated.
Overall Assessment
Market is in an accelerating Greed → Fear transition. The core矛盾: retail (options market) still chasing, while institutions (credit market) are retreating. History tells us this divergence typically resolves with a market pullback.
Risk Alerts:
- Junk bond 5.8 is a 1-year low — credit tightening could transmission to equities
- VIX 15 → 21, if it breaks 25 the uptrend is confirmed
- Both breadth and strength weak — rally foundation is fragile
Strategy Implications: Stay cautious. Factor Lab shows momentum factor still dominant (ICIR +2.70), but FNG credit signals are warning. Recommend maintaining positions, avoiding chasing highs, watching VIX 25 and junk bond stabilization as key triggers.