Factor Lab Daily Brief 2026-10-02
S&P 500 seven-factor cross-sectional test results. Volatility factor IC=+0.117 significantly positive; momentum, EP, FCF Yield, ROE all negative. IT sector momentum flipped from positive to negative,延续 existing regime shift. Fundamental factor IC unchanged since 09-26.
Factor Lab Daily Brief 2026-10-02
Data Cutoff
Price cache as of 2026-10-01 (Wednesday), run at Beijing Time 2026-10-02 06:30. Fundamental data from daily TTM earnings panel (combined_panel.pkl), update frequency depends on earnings release schedule.
Sample & Evaluation Methodology
- Universe: S&P 500 constituents, ~502 valid stocks (474 for ROE)
- Factor definitions: EP (TTM net income / market cap), BP (book value / market cap), FCF Yield (TTM FCF / market cap), ROE (TTM net income / shareholders’ equity), MOM (Price[t-21]/Price[t-273]−1, ~10-month price momentum), VOL (60-day annualized volatility), SIZE (log market cap)
- Evaluation window: 60 cross-sectional observations (fundamental factors) or 39 (price factors); MOM/VOL/SIZE use 21-day forward returns — the most recent 21 trading days cannot yet be fully evaluated
- IC: Spearman rank correlation, cross-period mean; NOT daily IC, NOT future return, NOT downside probability
- ICIR: IC mean / IC std, NOT strategy Sharpe
- p-value: Ordinary t-test, not corrected for overlapping-sample autocorrelation
- Long-short return: Q1 − Q5 (low factor group minus high factor group), gross (not net of costs)
Key Changes This Period
Only one new trading day (10-01) added since last run (10-01). Fundamental factor EP/BP/FCF Yield/ROE IC values are completely unchanged (identical across 5 consecutive runs since 09-26). MOM/VOL/SIZE adjusted slightly due to price update but remain within the range established over the past two weeks.
Complete 7-Factor Table
| Factor | Type | IC Mean | ICIR | p-value | Prev IC | Diff | Valid Obs | Interpretation |
|---|---|---|---|---|---|---|---|---|
| EP | Fundamental | −0.0480 | −0.520 | 0.0002 ⭐ | −0.0480 | 0.0000 | 60 | Significantly negative, ongoing |
| BP | Fundamental | +0.0030 | +0.046 | 0.728 | +0.0030 | 0.0000 | 60 | Ineffective, ongoing |
| FCF Yield | Fundamental | −0.0352 | −0.539 | 0.0001 ⭐ | −0.0352 | 0.0000 | 60 | Significantly negative, ongoing |
| ROE | Fundamental | −0.0248 | −0.685 | 0.0000 ⭐ | −0.0248 | 0.0000 | 60 | Highly significant negative, ongoing |
| MOM | Price | −0.0193 | −0.070 | 0.669 | −0.0349 | +0.0156 | 39 | Insignificant, negative narrowing |
| VOL | Price | +0.1172 | +1.053 | 0.0000 ⭐ | +0.1148 | +0.0024 | 39 | Highly significant positive, ongoing |
| SIZE | Price | +0.0118 | +0.087 | 0.595 | +0.0032 | +0.0086 | 39 | Insignificant, mildly positive |
⭐ = p < 0.05
Cross-Section Comparison: Last 5 Distinct Run Dates
| Factor | 09-26 | 09-29 | 09-30 | 10-01 | 10-02 |
|---|---|---|---|---|---|
| EP | −0.0480 | −0.0480 | −0.0480 | −0.0480 | −0.0480 |
| BP | +0.0030 | +0.0030 | +0.0030 | +0.0030 | +0.0030 |
| FCF Yield | −0.0352 | −0.0352 | −0.0352 | −0.0352 | −0.0352 |
| ROE | −0.0248 | −0.0248 | −0.0248 | −0.0248 | −0.0248 |
| MOM | −0.0758 | −0.0632 | −0.0483 | −0.0349 | −0.0193 |
| VOL | +0.1173 | +0.1172 | +0.1165 | +0.1148 | +0.1172 |
| SIZE | −0.0222 | −0.0139 | −0.0042 | +0.0032 | +0.0118 |
Observation: Four fundamental factors (EP/BP/FCF/ROE) have been identical across 5 consecutive runs since 09-26, indicating the TTM financial panel in the cache did not update after that date. MOM narrowed from −0.076 to −0.019, still negative but with reduced magnitude. VOL stable around +0.117. SIZE gradually moved from negative toward zero but remains statistically insignificant.
Sector Momentum Table (MOM by Sector)
| Sector | IC Mean | ICIR | p-value | Long-Short Q1−Q5 | Status |
|---|---|---|---|---|---|
| Consumer Discretionary | +0.055 | +0.224 | 0.175 | +0.29% | Insignificant |
| Consumer Staples | +0.078 | +0.263 | 0.113 | +1.40% | Insignificant |
| Financials | −0.064 | −0.204 | 0.216 | +1.32% | Insignificant |
| Health Care | +0.108 | +0.365 | 0.030 ⭐ | −5.62% | Significant |
| Industrials | −0.045 | −0.162 | 0.324 | +2.76% | Insignificant |
| Information Technology | −0.177 | −0.397 | 0.019 ⭐ | +6.31% | Significant |
| Utilities | −0.109 | −1.001 | 0.000 ⭐ | +3.26% | Highly significant |
⭐ = p < 0.05
Anomaly Alert Interpretation
System-flagged IC sign “flip” (🔴) items this period:
| Sector | Old IC (baseline) | New IC | Note |
|---|---|---|---|
| Financials | +0.182 → −0.064 | Positive to negative | Baseline includes May–Jun 2026 positive-momentum period; actually turned negative in late August — continuation |
| Health Care | −0.106 → +0.108 | Negative to positive | Deviation from historical mean z=+4.84; genuine outlier signal |
| Industrials | +0.155 → −0.045 | Positive to negative | Continuation of August downturn trend |
| Information Technology | +0.304 → −0.177 | Positive to negative | Continuation of IT momentum decay |
| Utilities | +0.139 → −0.109 | Positive to negative | Deviation from historical mean z=−2.26; recent shift |
Key note: ic_history.json contains the May–Jun 2026 period when momentum was broadly positive. Momentum regime flipped in late August; anomaly detection will keep flagging “positive-to-negative” — this is a continuation marker of the existing regime, not a daily突变. Must cross-reference with ic_history to confirm continuation vs new breakout.
Sector Momentum Chart
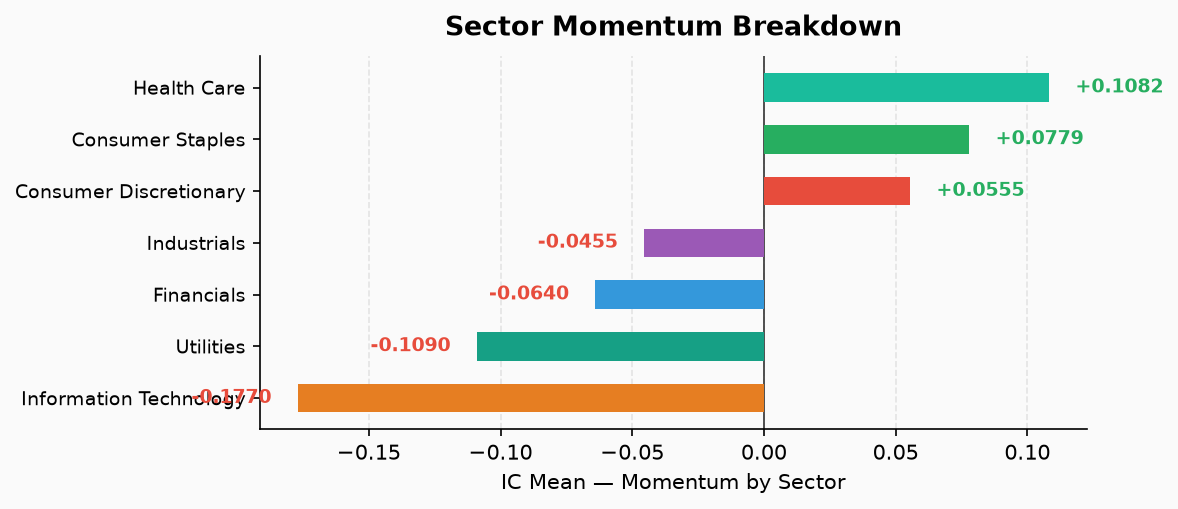
Caption: Run 2026-10-02, prices as of 2026-10-01. IT sector momentum significantly negative (IC=−0.177, p=0.019), Health Care significantly positive (IC=+0.108, p=0.030). Utilities significantly negative with ICIR=−1.0.
Factor IC Time Series Chart
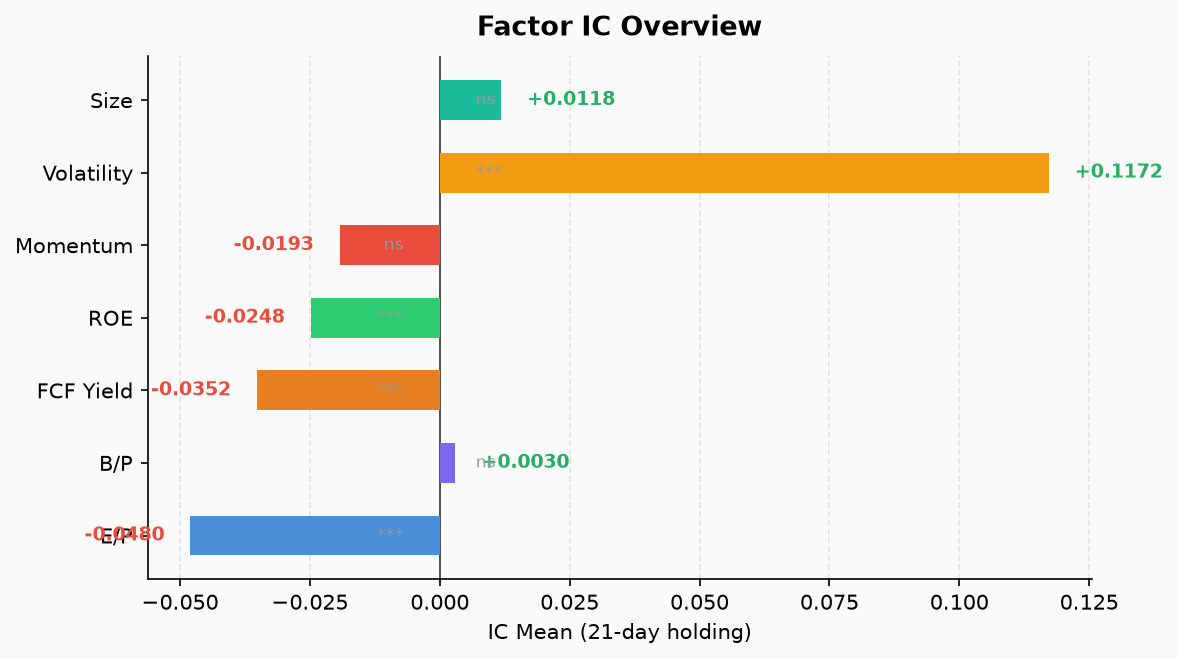
Caption: Run 2026-10-02. VOL persistently elevated (+0.117); EP/FCF/ROE significantly negative; MOM negative but narrowing.
Strategic Implications
Volatility (VOL) is the strongest and most robust signal: IC=+0.117, ICIR=+1.05, p<0.0001. Low-vol组合显著跑赢高-vol组合 (Q1−Q5 = −5.07%), consistent with the low-vol anomaly.
Momentum regime shifted negative but reversal not confirmed: Overall MOM IC=−0.019 (insignificant), but IT sector at −0.177 (significant). The “strong gets stronger” dynamic within IT has broken down — low-momentum IT stocks relative outperformed high-momentum ones. Health Care is the only sector with significantly positive momentum.
Fundamental factors broadly negative: EP (−0.048), FCF Yield (−0.035), ROE (−0.025) all significantly negative. High-EP / high-FCF / high-ROE groups underperformed low groups over the past 21 days. This does not mean value/quality factors are失效 — the cross-sectional 21-day window captures relative rank changes, not absolute return direction.
SIZE mildly positive: Moved from −0.022 toward +0.012, direction shifted from large-cap bias to small-cap preference, but p=0.595 is completely insignificant — insufficient to support any conclusion.
Conclusions NOT Supported
- ❌ MOM negative ≠ market must decline, nor does it mean laggards are worth buying. It only means the “winner portfolio” underperformed the “loser portfolio” within the sample.
- ❌ SIZE positive ≠ small-cap rally; p=0.595.
- ❌ EP/FCF/ROE negative ≠ value rotation confirmed. These factors measure cross-sectional rank correlation with 21-day returns; a negative sign only means high-factor groups underperformed low-factor groups.
- ❌ Sector alert red count ≠ independent risk event. Multiple sectors’ momentum flips are different facets of the same regime change.
- ❌ Gross long-short returns (uncost-adjusted) ≠ realizable strategy returns.
Statistical & Data Limitations
- Price cutoff: 2026-10-01 (latest available at Beijing Time 10-02 06:30 run). Fundamental factor ICs unchanged since 09-26 — the TTM financial panel cache had no new earnings-driven updates after that date.
- p-values: Ordinary t-test, not corrected for overlapping-sample autocorrelation. Overlapping returns understate standard errors; p-values may be optimistically biased.
- MOM holding period: 21-day forward returns means the most recent 21 trading days (09-08 to 10-01) cannot yet form a complete evaluation. MOM valid observations (39) fewer than fundamental factors (60).
- ICIR is IC mean / IC std, NOT strategy Sharpe ratio or annualized return.
- Quantile direction: Long-short return is Q1 (low factor group) − Q5 (high factor group). Positive value means low-factor group outperformed; does NOT mean high-factor group made money.
- Sector coverage: Sector decomposition covers 7 GICS一级 sectors (Consumer Discretionary/Staples, Financials, Health Care, Industrials, Information Technology, Utilities). Energy, Materials, Real Estate, Communication Services are NOT covered. Current count of negative sectors does not equal number of new reversals this period.