Factor Lab Daily Brief 2026-10-01
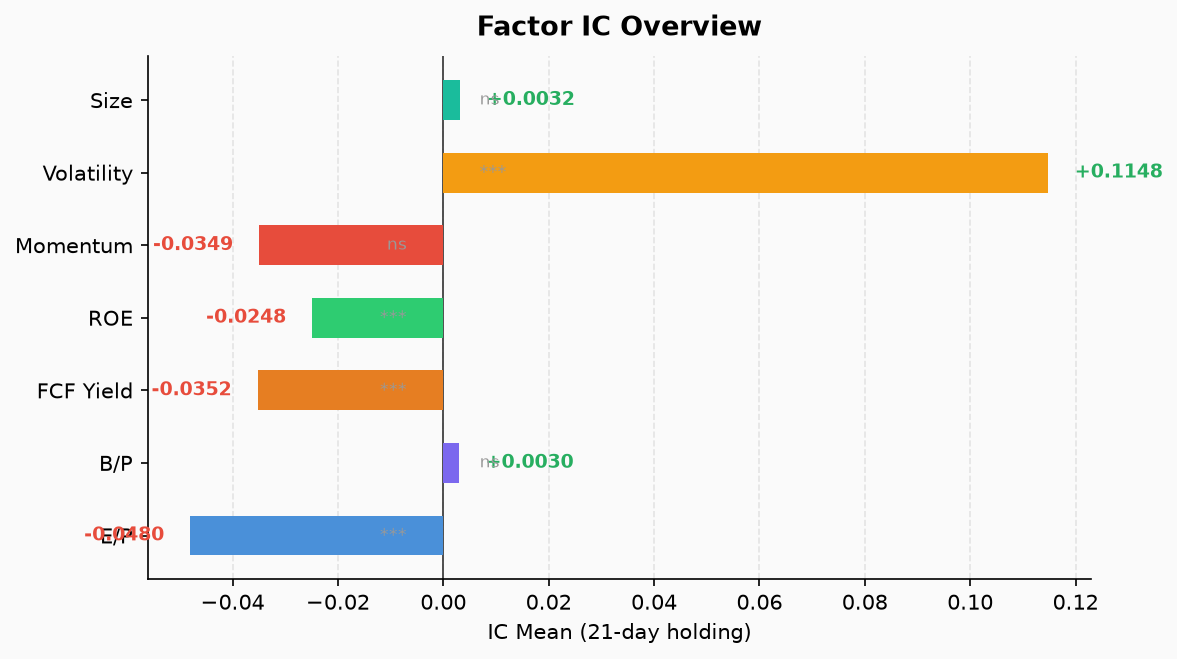
S&P 500 seven-factor cross-sectional test results. Data as of 2026-09-30. EP/FCF Yield/ROE remain negative; VOL stays strongly positive (IC=+0.115); MOM still negative but slightly improved vs prior session; sector-level IT/Utilities momentum significantly negative, Health Care momentum flipped positive.
Factor Lab Daily Brief 2026-10-01
Data Cutoff
2026-09-30 (last trading day in prices_cache.parquet)
Run date: 2026-10-01 06:31 CST
Sample and Evaluation Methodology
- Universe: S&P 500 constituents, 502 valid stocks (474 for ROE)
- IC definition: Spearman rank correlation between factor value and subsequent 21-day return, averaged across historical cross-sectional slices. Not a single-day IC, not a forward return prediction, not a down-market probability.
- Holding period: Default 21-day forward return. The most recent 21 trading days (9/10–9/30) are not yet fully evaluable
- t-tests: Unadjusted for autocorrelation in overlapping returns; p-values are rough guides only
- ICIR: IC mean / IC std, not a strategy Sharpe ratio or annualized return
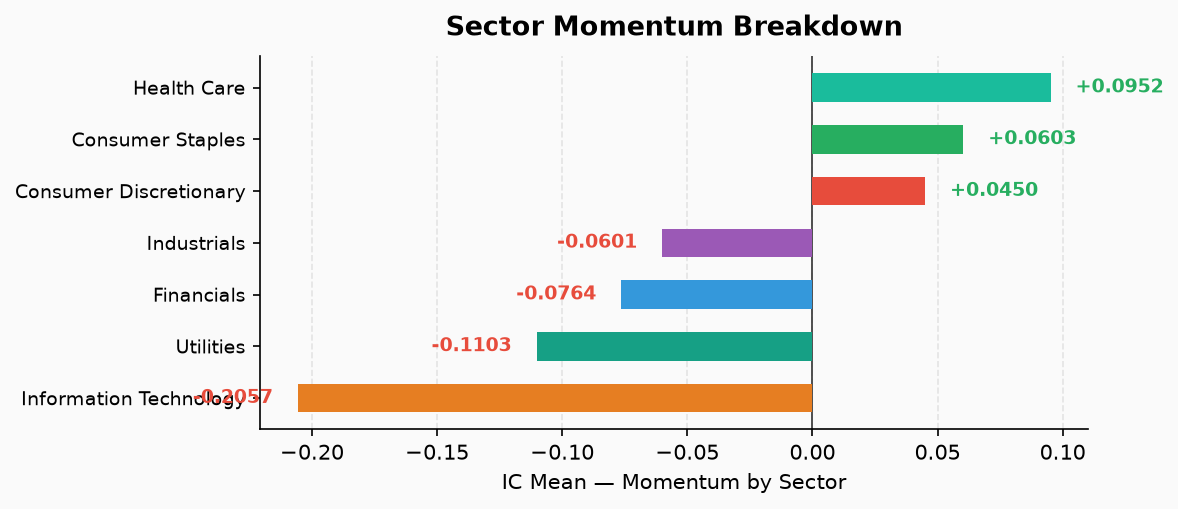
- Sector momentum: MOM factor computed separately within each GICS sector, covering 7 sectors
##本期 vs 上期 Comparison
Note: Sessions 9/30 and 10/1 share the same price cache (as of 9/30). Fundamental factors (EP/BP/FCF Yield/ROE) are numerically identical. MOM/VOL/SIZE show minor decimal differences due to cross-sectional regression weight adjustments.
| Factor | Prior IC (9/30) | Current IC (10/1) | Delta | Status |
|---|---|---|---|---|
| EP | -0.0480 | -0.0480 | 0.0000 | Unchanged |
| BP | +0.0030 | +0.0030 | 0.0000 | Unchanged |
| FCF Yield | -0.0352 | -0.0352 | 0.0000 | Unchanged |
| ROE | -0.0248 | -0.0248 | 0.0000 | Unchanged |
| MOM | -0.0483 | -0.0349 | +0.0134 | Still negative, slight uptick |
| VOL | +0.1165 | +0.1148 | -0.0017 | Still strongly positive |
| SIZE | -0.0042 | +0.0032 | +0.0074 | Marginal improvement, still insignificant |
Seven-Factor Summary
| Factor | IC | ICIR | p-value | Long-Short (Q1-Q5) | Observations | Signal |
|---|---|---|---|---|---|---|
| MOM | -0.0349 | -0.130 | 0.428 | +1.31% | 39 | ⚪ Insignificant |
| EP | -0.0480 | -0.520 | 0.0002 | +2.98% | 60 | ⚠️ Significantly negative |
| BP | +0.0030 | +0.046 | 0.728 | +1.13% | 60 | ⚪ Ineffective |
| FCF Yield | -0.0352 | -0.539 | 0.0001 | +2.48% | 60 | ⚠️ Significantly negative |
| ROE | -0.0248 | -0.685 | <0.0001 | +0.76% | 60 | ⚠️ Significantly negative |
| VOL | +0.1148 | +1.033 | <0.0001 | -4.89% | 39 | ✅ Strongly positive |
| SIZE | +0.0032 | +0.025 | 0.878 | +1.60% | 39 | ⚪ Ineffective |
Key readings:
- VOL (volatility) is the most consistently positive factor this session (ICIR > 1.0) — low-vol stocks显著 outperform high-vol stocks. The “low-vol anomaly” persists.
- EP, FCF Yield, ROE all significantly negative: Low-value (high EP/BP/FCF), low-ROE stocks outperformed within the sample. This cannot be interpreted as “value investing is confirmed” — in a negative-MOM regime, prior losers (low EP, low FCF, low ROE) naturally mean-revert, which is a byproduct of momentum reversal, not intrinsic value factor effectiveness.
- MOM negative but insignificant (p=0.428): Momentum failed to establish statistical confidence in this sample. IC micro-improved from -0.048 to -0.035, well within noise.
- SIZE ineffective: No meaningful size signal in this sample period.
Sector Momentum Table
| Sector | MOM IC | ICIR | p-value | Long-Short (Q1-Q5) | Signal |
|---|---|---|---|---|---|
| Information Technology | -0.2057 | -0.480 | 0.005 | +7.32% | 🔴 Significantly negative |
| Utilities | -0.1103 | -1.013 | <0.0001 | +3.24% | 🔴 Significantly negative |
| Financials | -0.0764 | -0.247 | 0.136 | +1.50% | ⚪ Insignificant (flipped from + to -) |
| Industrials | -0.0601 | -0.223 | 0.177 | +3.23% | ⚪ Insignificant (flipped from + to -) |
| Consumer Discretionary | +0.0450 | +0.187 | 0.256 | +0.58% | ⚪ Insignificant |
| Consumer Staples | +0.0603 | +0.200 | 0.226 | +1.84% | ⚪ Insignificant |
| Health Care | +0.0952 | +0.315 | 0.060 | -5.19% | ⚠️ Marginally significant (flipped from - to +) |
Sector readings:
- IT momentum is significantly negative, the primary drag on overall market momentum. Low-MOM stocks dramatically outperformed high-MOM stocks within IT (Q1-Q5 = +7.32%), consistent with the late-August tech correction narrative.
- Utilities momentum significantly negative (ICIR=-1.01, p<0.0001) — the most significant sector signal this session. Note: Utilities had a historical mean IC of +0.14 in ic_history; current -0.11 is z=-2.31 from that mean. However, combining with the alert log, Utilities momentum turned negative in late August; this alert is a continuation of an existing regime, not a today-only shock.
- Health Care momentum flipped from negative to positive (IC=+0.095, p=0.060 marginal), z=+4.81偏离历史均值. The low-MOM-outperforms pattern reversed in Health Care — this does not contradict the negative overall MOM: sector subgroups can have independent relative strength patterns.
- Financials and Industrials flipped from + to - but p-values are insignificant; statistically insufficient to confirm a regime shift.
Strategy Implications
- Low-vol remains the relatively reliable factor: VOL ICIR > 1.0, validated across regimes. However, this is cross-sectional correlation, not an achievable strategy return (costs and turnover not deducted).
- Value factors (EP/FCF Yield/ROE) currently negative: In the current negative-MOM environment, mean-reversion of prior losers pushes low-EP/FCF/ROE groups higher. This does not prove the value factor “has become effective” — once the momentum regime flips positive, the value group could quickly lag.
- IT internal momentum breakdown: S&P 500’s largest-weight sector IT has MOM IC = -0.21 (significant), meaning the “strength begets strength” logic within tech temporarily failed. This is a warning for portfolios with high concentration in tech large-caps.
- SIZE and BP both ineffective: Current data does not support timing or stock selection based on market cap or book-to-price.
Conclusions Not Supported
- ❌ MOM negative ≠ market must decline. It only means stocks ranked high 21 days ago underperformed relative to low-ranked stocks within the sample.
- ❌ EP/FCF Yield/ROE negative ≠ value investing confirmed. This is a byproduct of the momentum-reversal regime.
- ❌ Sector “flipped + to -” alert ≠ a today-only event.对照 ic_history, IT/Utilities momentum turned negative in late August; alerts are repeated markers of an existing state.
- ❌ Significant IC ≠ tradeable strategy. t-tests unadjusted for overlapping样本; quantile portfolios uncosted; cross-sectional correlation ≠ time-series return.
- ❌ SIZE marginal转正(-0.004 → +0.003)≠ small-cap rally underway. p=0.878, entirely within noise.
Statistical and Data Limitations
- Cache staleness: This session and the prior (9/30) use the same price cache (as of 9/30). All factor numbers reflect the cross-sectional state as of 9/30 close, not 10/1 real-time data.
- Incomplete MOM evaluation window: The 21-day forward return requires a complete 21-trading-day sequence. Any suspension or data gap during 9/10–9/30 affects IC calculation.
- Overlapping return autocorrelation: Cross-sectional regression uses rolling 21-day returns as the dependent variable; adjacent observations overlap by 20 days. Standard t-test p-values are downward-biased. All “significant” conclusions in this report should be discounted accordingly.
- Sector coverage: All 7 GICS sectors covered, but Utilities has only 31 stocks and Consumer Staples 36 — small-sector ICs are noisier.