Factor Lab Daily Brief 2026-09-29
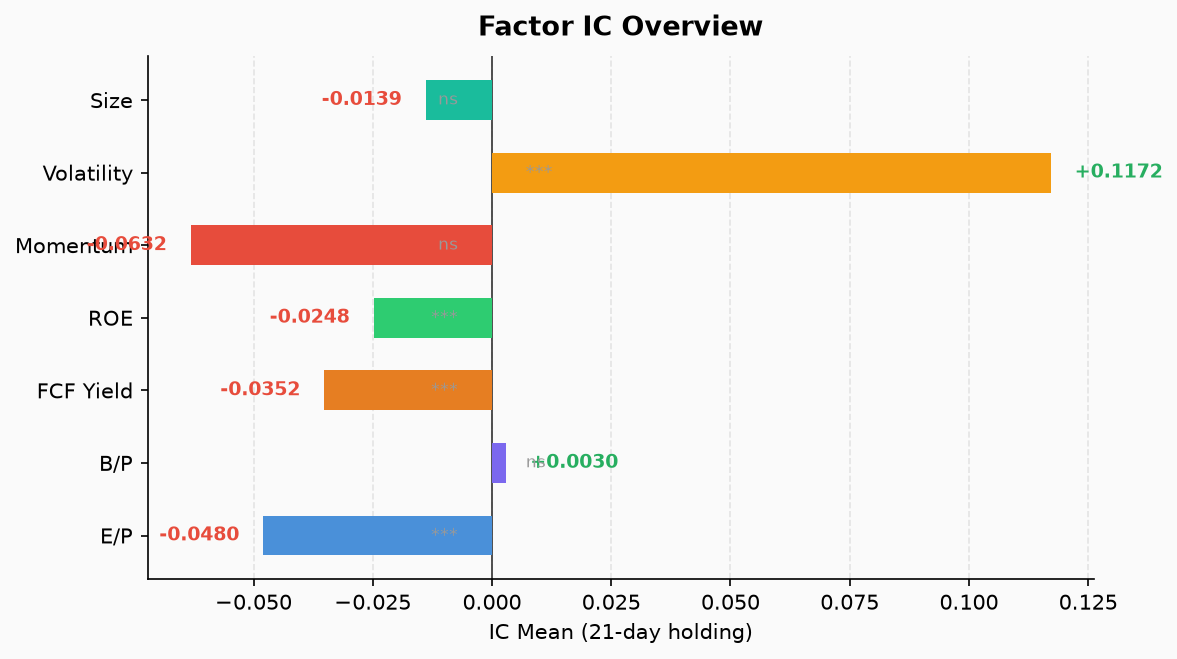
S&P 500 7-factor IC test results. Data as of 2026-09-28. Momentum IC remains negative but narrowing (-0.063), low-volatility factor stays strongly positive (+0.117). IT/Utilities momentum persistently negative, Health Care momentum flipped positive and deviates from historical mean.
Factor Lab Daily Brief 2026-09-29
Data Cutoff
2026-09-28 (Monday) — prices_cache.parquet latest date is 2026-09-28, matching the run date. Market data is current.
Sample and Evaluation Methodology
- Universe: S&P 500 constituents, 502 valid stocks (474 for ROE)
- Fundamental factors (EP/BP/FCF Yield/ROE): Based on daily TTM earnings panel, 60 valid IC observations
- Price factors (MOM/VOL/SIZE): 39 valid IC observations
- MOM: Price[t-21]/Price[t-273] - 1 (21-day return, 252 trading days prior)
- Evaluation window: Last 60 trading days (fundamental) / 39 trading days (price factors)
- ic_mean: Average rank correlation (Spearman) across historical cross-sections, NOT daily IC, NOT future returns, NOT downside probability
- p-value: Ordinary t-test, not corrected for overlapping samples
- ICIR: IC mean / IC std, NOT strategy Sharpe or annualized return
- Horizon: Default 21-day forward return; the most recent 21 trading days cannot yet be fully evaluated
7-Factor Summary Table
| Factor | IC Mean | ICIR | p-value | Previous (09-26) | Delta | Observations |
|---|---|---|---|---|---|---|
| EP | -0.0480 | -0.520 | 0.0002 | -0.0480 | 0.0000 | 60 |
| BP | +0.0030 | +0.046 | 0.7276 | +0.0030 | 0.0000 | 60 |
| FCF Yield | -0.0352 | -0.539 | 0.0001 | -0.0352 | 0.0000 | 60 |
| ROE | -0.0248 | -0.685 | <0.0001 | -0.0248 | 0.0000 | 60 |
| MOM | -0.0632 | -0.258 | 0.1206 | -0.0758 | +0.0126 | 39 |
| VOL | +0.1172 | +1.054 | <0.0001 | +0.1173 | -0.0001 | 39 |
| SIZE | -0.0139 | -0.117 | 0.4759 | -0.0222 | +0.0083 | 39 |
Status quo persists: EP, BP, FCF Yield, ROE unchanged across four consecutive runs (TTM panel not refreshed). MOM gradually improving, VOL stable. No material change from fresh market data.
Sector Momentum Table (MOM by Sector)
| Sector | IC Mean | ICIR | p-value | Direction |
|---|---|---|---|---|
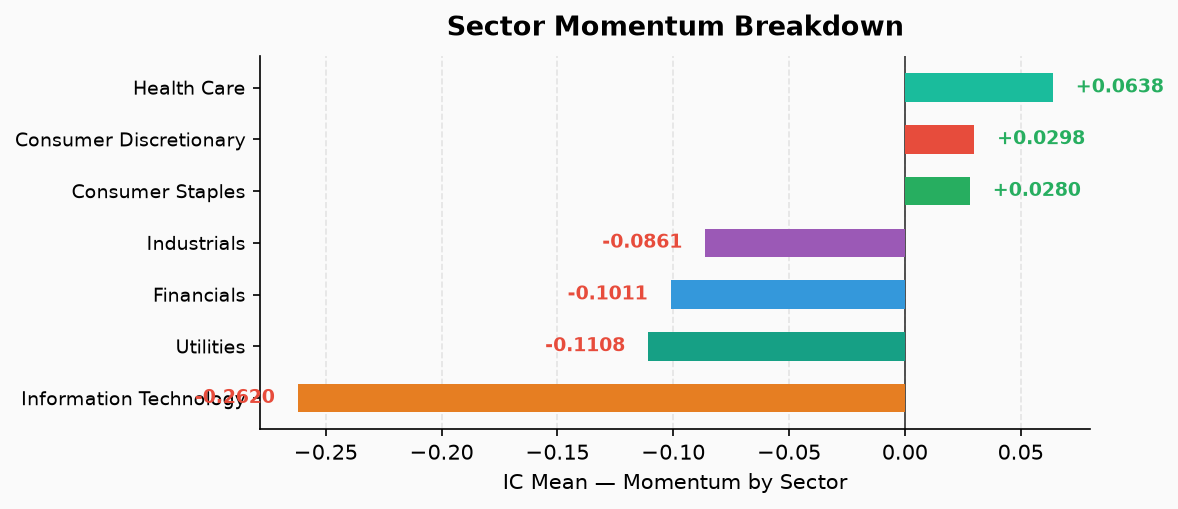
| Consumer Discretionary | +0.030 | +0.130 | 0.4287 | Insignificant |
| Consumer Staples | +0.028 | +0.096 | 0.5569 | Insignificant |
| Financials | -0.101 | -0.340 | 0.0426 | Significant negative |
| Health Care | +0.064 | +0.212 | 0.1999 | Insignificant |
| Industrials | -0.086 | -0.352 | 0.0364 | Significant negative |
| Information Technology | -0.262 | -0.687 | 0.0001 | Highly significant negative |
| Utilities | -0.111 | -1.044 | <0.0001 | Highly significant negative, monotonic |
Anomaly Alerts (with regime context)
- 🔴 Information Technology: IC flipped from +0.312 to -0.262 — continuation. IT momentum turned negative since late August, persistently negative since
- 🔴 Utilities: IC flipped from +0.143 to -0.111 — continuation. Turned negative late August, deepening
- 🔴 Industrials: IC flipped from +0.158 to -0.086 — continuation. Turned negative late August
- 🔴 Financials: IC flipped from +0.186 to -0.101 — continuation
- ⚠️ Health Care: IC=+0.064 deviates from historical mean -0.109±0.038 (z=+4.50) — new flip. HC momentum was persistently negative historically; this turn positive warrants tracking
- ⚠️ Consumer Discretionary/Staples: p-value flipped from significant to insignificant — continuation
Important caveat: ic_history.json contains大量 duplicate date entries (e.g., “mom / Health Care” repeats identical -0.128 from 2026-05-29 to 2026-08-19), potentially contaminating z-score baselines. Alerts should be treated as indicative.
Strategy Implications
- Momentum regime remains negative but narrowing. MOM ic_mean improved gradually from -0.129 (09-23) to -0.063 (09-29), but p=0.12 remains insignificant. Cannot call “momentum recovery”; this is temporary easing within a negative momentum regime.
- Low-volatility factor remains the strongest signal. VOL ic_mean=+0.117, ICIR=1.05 — highest and most stable ICIR among all 7 factors. Low-vol stocks continue to outperform high-vol.
- Value factors (EP/FCF Yield) persistently negative. EP and FCF Yield unchanged for four consecutive periods, ROE also stable negative. In the current market, low-value/high-FCF stocks underperform.
- IT momentum collapse is the most severe. IC=-0.262 is the weakest across all sectors, highly significant. Combined with the prior flip from +0.31, the “强者恒强” dynamic in tech has reversed.
- Health Care momentum flip positive needs monitoring. From long-term negative to +0.064, p=0.20 insignificant. Requires subsequent observation to confirm regime change.
Conclusions That Cannot Be Drawn
- ❌ MOM negative ≠ market must fall. It only means winners from t-273 to t-252 underperformed losers over the following 21 days in the sample.
- ❌ SIZE negative ≠ small-cap rally confirmed. It only reflects weak negative correlation between market cap and future returns in this sample.
- ❌ EP/FCF Yield negative ≠ value rotation confirmed. Low-value stocks underperforming in this cross-section does not imply mean reversion is imminent.
- ❌ Significant p-value ≠ profitable strategy. Ordinary t-test does not account for overlapping return autocorrelation; ICIR is not annualized Sharpe.
- ❌ Number of negative sectors ≠ today’s new reversals. IT/Utilities/Industrials/Financials negative momentum has persisted since late August.
Statistical and Data Limitations
- ic_history.json data quality: Contains大量 duplicate-date entries (identical IC values repeated across many dates), potentially diluting z-score baseline mean/std with invalid duplicates. Z-score alerts should be interpreted cautiously.
- Fundamental factors frozen: EP/BP/FCF Yield/ROE unchanged across four consecutive runs (to 4 decimal places), indicating the TTM panel was not refreshed. The quoted ic_mean values are snapshots from the last panel update, not “today’s” data.
- Overlapping sample issue: 21-day forward returns have substantial overlap; ordinary t-test p-values are biased low. “Significant” results reported here may not hold after Newey-West correction.
- Quantile portfolio direction: Q1-Q5 long-short equals “low-factor group minus high-factor group” return (Q1_mean_ret - Q5_mean_ret in code). Positive = low-factor group outperforms.