Factor Lab Daily Brief 2026-09-19
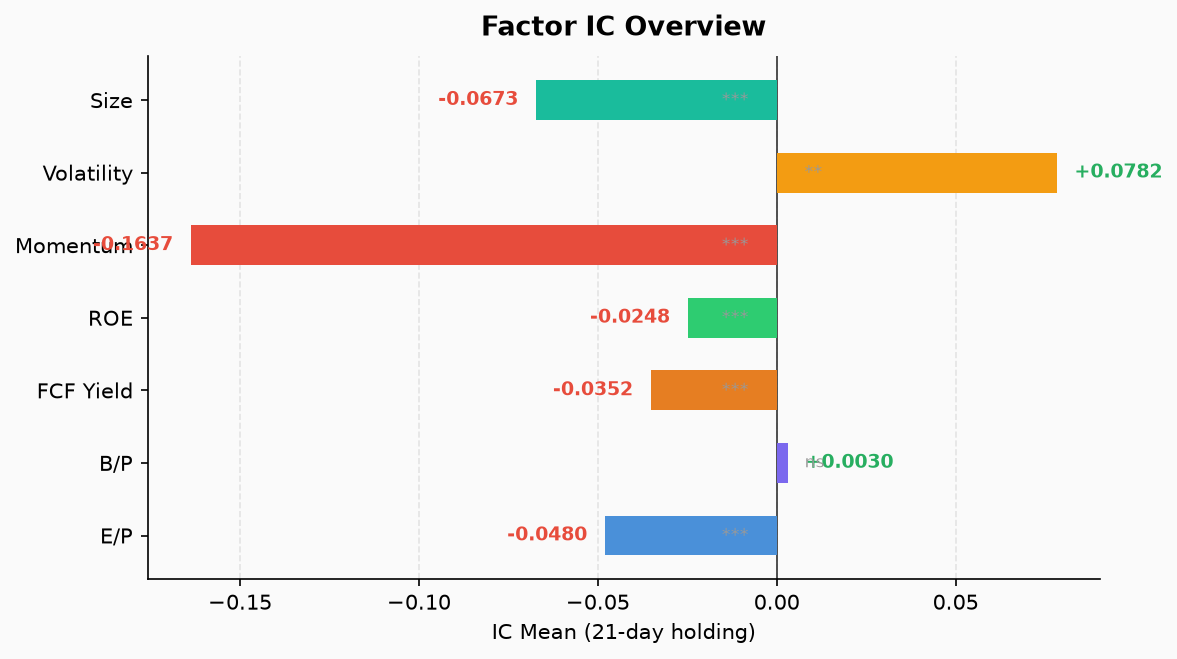
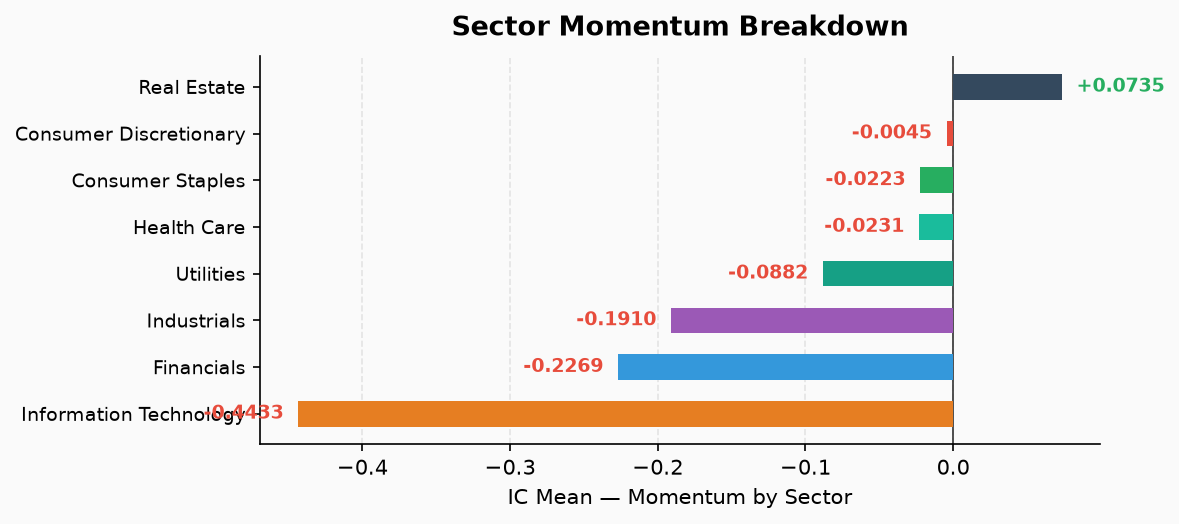
S&P 500 7-factor test results. Market data as of 2026-09-18 (Friday). Momentum IC=-0.164, continuing the negative momentum regime since late August; IT sector momentum flipped to -0.443, the deepest negative across all sectors.
Factor Lab Daily Brief 2026-09-19
Data Cut-off and Sample
- Price data cut-off: 2026-09-18 (Friday), last row in
prices_cache.parquet - Financial panel:
combined_panel.pkl, unchanged since 2026-05-29 (FY2026 Q1 TTM data). EP/BP/FCF Yield/ROE are identical to 9/16-9/18 runs - Valid factor dates: Price-sensitive factors (MOM/VOL/SIZE) updated to latest trading day; fundamental factors limited by panel cut-off
- Sample: 502 S&P 500 constituents (474 for ROE); 39-60 cross-sectional IC observations
- Evaluation window: Default 21-day forward return
- MOM definition: Price[t-21]/Price[t-273] - 1 (12-month momentum skipping most recent month)
- IC: Spearman rank correlation, averaged across cross-sections; not a single-day cross-sectional IC
- p-value: Ordinary t-test, uncorrected for overlapping sample autocorrelation
- ICIR: IC mean / IC std, not strategy Sharpe
7-Factor Summary Table
| Factor | IC | ICIR | Previous (9/18) | Delta | p-value | Observations | Long-Short Q1-Q5 |
|---|---|---|---|---|---|---|---|
| MOM | -0.1637 | -0.9578 | -0.1761 | +0.0124 | 0.000001 | 39 | +5.04% |
| EP | -0.0480 | -0.5196 | -0.0480 | 0.0000 | 0.000184 | 60 | +2.98% |
| BP | +0.0030 | +0.0456 | +0.0030 | 0.0000 | 0.727567 | 60 | +1.13% |
| FCF Yield | -0.0352 | -0.5390 | -0.0352 | 0.0000 | 0.000112 | 60 | +2.48% |
| ROE | -0.0248 | -0.6845 | -0.0248 | 0.0000 | 0.000002 | 60 | +0.76% |
| VOL | +0.0782 | +0.5699 | +0.0712 | +0.0070 | 0.001161 | 39 | -3.15% |
| SIZE | -0.0673 | -0.9068 | -0.0722 | +0.0049 | 0.000002 | 39 | +3.88% |
Note: Delta = Current IC − Previous IC. Positive delta for MOM means the negative value is narrowing.
Cross-run Comparison (5 most recent runs)
| Factor | 9/16 | 9/17 | 9/18 | 9/19 | Trend |
|---|---|---|---|---|---|
| MOM | -0.1855 | -0.1817 | -0.1761 | -0.1637 | Negative, narrowing |
| VOL | +0.0609 | +0.0654 | +0.0712 | +0.0782 | Steadily rising |
| SIZE | -0.0741 | -0.0722 | -0.0722 | -0.0673 | Negative, slight narrowing |
| EP | -0.0480 | -0.0480 | -0.0480 | -0.0480 | No change (panel stale) |
| BP | +0.0030 | +0.0030 | +0.0030 | +0.0030 | No change (panel stale) |
| FCF Yield | -0.0352 | -0.0352 | -0.0352 | -0.0352 | No change (panel stale) |
| ROE | -0.0248 | -0.0248 | -0.0248 | -0.0248 | No change (panel stale) |
Sector Momentum Breakdown
| Sector | IC | ICIR | p-value | Long-Short Q1-Q5 | Status |
|---|---|---|---|---|---|
| Information Technology | -0.4433 | -1.6284 | 0.0000 | +17.31% | 🔴 Major flip |
| Industrials | -0.1910 | -1.0462 | 0.0000 | +7.17% | 🔴 Flipped |
| Financials | -0.2269 | -0.9570 | 0.0000 | +4.18% | 🔴 Flipped |
| Utilities | -0.0882 | -0.7641 | 0.00003 | +1.91% | 🔴 Flipped, monotonic |
| Consumer Discretionary | -0.0045 | -0.0232 | 0.8869 | +1.60% | ⚠️ Insignificant |
| Consumer Staples | -0.0223 | -0.0931 | 0.5694 | +3.22% | ⚠️ Insignificant |
| Health Care | -0.0231 | -0.0776 | 0.6353 | -1.95% | Insignificant |
| Real Estate | +0.0735 | +0.2181 | 0.4282 | -0.46% | Insignificant |
Coverage: 8 GICS sectors, 433 stocks combined (some small-cap S&P 500 constituents excluded due to data gaps).
Continuity of Sector Momentum Flips
- 🔴 IT momentum flipped from +0.3323 to -0.4433: Continuation of the late-August regime shift. Historical ic_history shows IT momentum was长期 positive (mean +0.33); current -0.44 is z=-2.03 from mean. Not a “today” event—global MOM has been persistently negative since 9/1 (-0.22 → -0.16).
- 🔴 Industrials from +0.1674 to -0.1910, Financials from +0.1964 to -0.2269, Utilities from +0.1505 to -0.0882: Same pattern—既有 regime continuation signals, not new Monday-morning surprises.
- ⚠️ CDD and CDNS p-values turned from significant to insignificant: Factor signal drifting in noise; no directional implication.
Strategic Implications
Momentum regime remains negative, but the negative value is narrowing from the extreme -0.22 in early September to -0.16 today. This is not a reversal signal—it’s noise within a negative regime. Recent winners (Q5) returned -0.04%, losers (Q1) +5.0%. Momentum retains its “contrarian” effectiveness.
IT sector momentum IC=-0.443, the largest absolute value across all sectors. The “strong get stronger” dynamic in tech has completely reversed. Previous leaders are now the worst performers. Q1 (low momentum) IT returned +13.92%, Q5 (high momentum) -3.39%, long-short +17.31%.
Low-volatility factor (VOL) IC=+0.078, steadily improving. Low-vol stocks continue to outperform high-vol stocks, consistent with the “low-vol anomaly.” ICIR=0.57 reaches statistical significance.
Size factor (SIZE) IC=-0.067, small-cap persists in outperforming. Note: SIZE negative only indicates relative performance within the sample; it does not forecast a broad small-cap rally.
EP/FCF Yield/ROE all negative. Low-value groups (Q1) outperform high-value groups (Q5). However, these three factors are limited by the stale financial panel (cut-off ~5/29); their ICs reflect ~60 cross-sections averaged over time, not this week’s immediate signal.
Conclusions Not Supported
- ❌ MOM negative ≠ market must decline. It only means 12-month momentum winners (skipping last month) underperform losers over the next 21 days.
- ❌ SIZE negative ≠ small-cap stocks will broadly rise. It is only relative performance within the cross-sectional ranking.
- ❌ EP/FCF Yield negative ≠ “value factor is alive.” The panel data is stale; these ICs cannot represent current cross-sections.
- ❌ 6 sector momentum alerts ≠ a new systemic regime shift this week. Per ic_history, these flips began in late August—repeated triggers of an existing signal.
- ❌ IC p-value < 0.05 without overlapping sample correction is not conclusive evidence of “not random.”
- ❌ ICIR is not a strategy Sharpe ratio; it does not represent achievable annualized risk-adjusted returns.
Statistical and Data Limitations
- Stale fundamental panel: EP/BP/FCF Yield/ROE’s 60 IC observations span approximately 2026-05 to 2026-09. The most recent 21 trading days cannot recompute cross-sectional factor values due to unchanged financial data. The reported ic_mean is a rolling average across windows, not a single-day cross-sectional correlation.
- Overlapping returns: 21-day forward returns have 20-period overlap; ordinary t-test p-values are underestimated. Labeled “uncorrected for overlapping sample.”
- MOM holding period: 252 days skipping the most recent 21 days; the last 21 trading days are insufficient for complete factor evaluation (the final 21 IC observations require subsequent 21-day realized returns).
- Quantile direction: In the code, Q1 = lowest factor value group, Q5 = highest factor value group. Long-short = Q1 − Q5. Negative means high-factor group outperforms.
- Quantile portfolio returns are gross, not net of transaction costs.