Factor Lab Daily Brief 2026-09-16
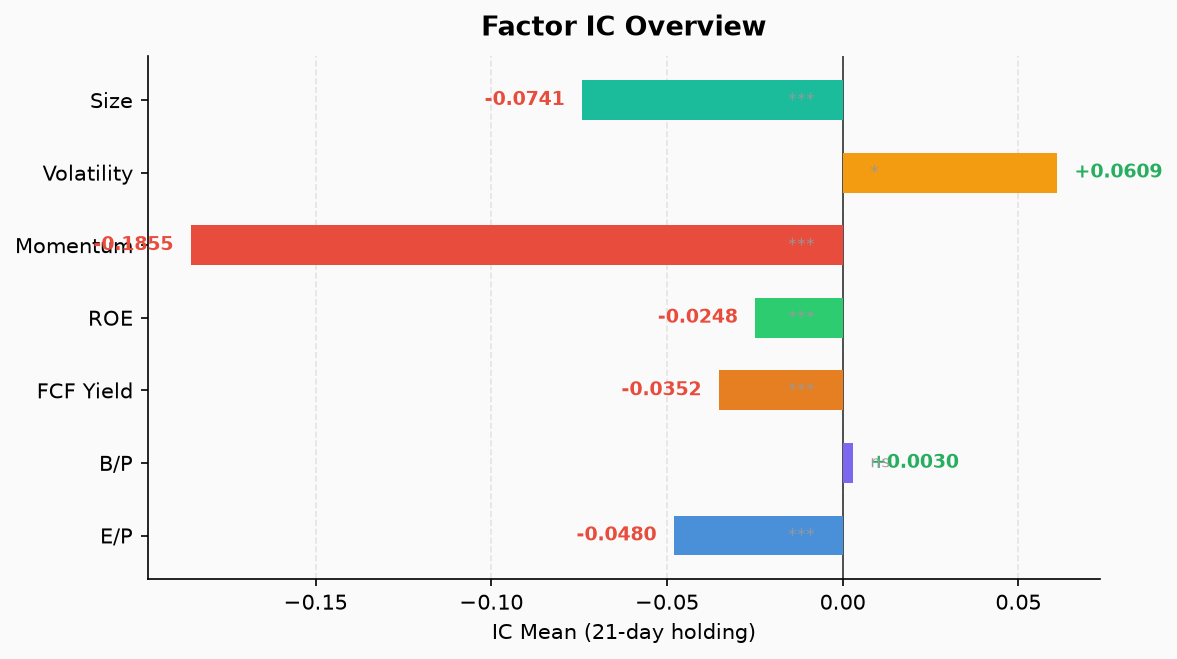
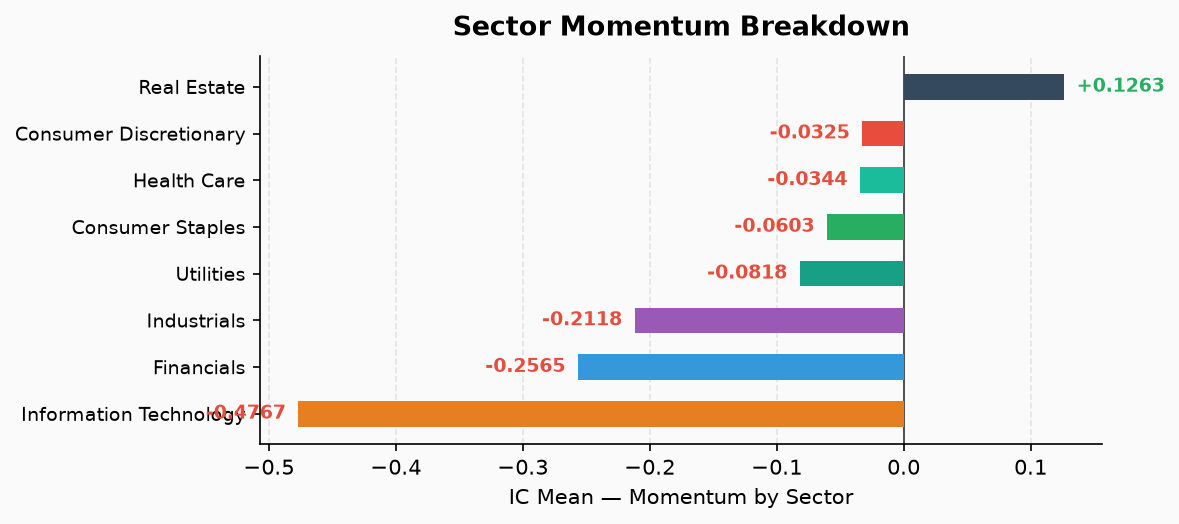
S&P 500 seven-factor cross-sectional test: data as of 2026-09-15. Momentum IC=-0.1855 persists in reversal regime; EP/FCF Yield/ROE/Size all negative; BP无效. IT sector momentum IC=-0.477 strongest reversal. Fundamental factors unchanged from yesterday—cache not refreshed.
Factor Lab Daily Brief 2026-09-16
Data & Sample
| Item | Value |
|---|---|
| Data as-of | 2026-09-15 (Tuesday, US trading day) |
| Run date | 2026-09-16 |
| Universe | 502 S&P 500 constituents |
| Fundamental evaluation window | 60 cross-sections (TTM financials) |
| Price factor evaluation window | 39 cross-sections (MOM/VOL/SIZE use 252/21 day windows) |
| Price cache | prices_cache.parquet, 641 rows × 502 cols, as of 2026-09-15 |
Factor Overview
| Factor | IC Mean | ICIR | p-value | Long-Short Q1-Q5 | Valid Obs | vs Yesterday |
|---|---|---|---|---|---|---|
| MOM | -0.1855 | -1.2514 ⭐ | <0.0001 | +5.65% ⭐ | 39 | +0.0046 |
| EP | -0.0480 | -0.5196 ⭐ | 0.0002 | +2.98% | 60 | 0.0000 |
| BP | +0.0030 | +0.0456 | 0.7276 | +1.13% | 60 | 0.0000 |
| FCF Yield | -0.0352 | -0.5390 ⭐ | 0.0001 | +2.48% | 60 | 0.0000 |
| ROE | -0.0248 | -0.6845 ⭐ | <0.0001 | +0.76% | 60 | 0.0000 |
| VOL | +0.0609 | +0.3908 | 0.0209 | -2.42% | 39 | +0.0035 |
| SIZE | -0.0741 | -1.0490 ⭐ | <0.0001 | +4.15% ⭐ | 39 | +0.0014 |
⭐ marks p < 0.05.
Key observations:
- MOM remains negative (-0.1855); only 12.8% of 39 cross-sections positive. Winners significantly underperform losers—reversal regime strong, momentum ineffective.
- EP, FCF Yield, ROE all persist negative and identical to yesterday (diff = 0). This is not a “factor reversal today”—the fundamental factor cache was not refreshed. Price cache ends at 09-15, but TTM panel ICs carry forward unchanged.
- BP remains ineffective (IC ≈ 0, p = 0.73).
- VOL holds positive IC (low-vol anomaly persists); SIZE holds negative IC (small-cap premium within-sample).
Status Quo Continuation
EP, BP, FCF Yield, ROE fundamental factors show zero change vs yesterday (diff = 0.0000). The ic_history.json shows these factors’ entries written identically each day since 09-08. This means:
- No “new” fundamental factor reversal today—market data from 09-08 to 09-16 had no effect on fundamental ICs (cache reused verbatim).
- ic_history.json contains大量 duplicate date entries (same date written 2-7 times), which inflates baseline distribution weights and affects z-score calculations in anomaly detection. Deviation alerts at ±2σ should be treated as continuation of existing regime, not daily breakpoints.
Sector Momentum Map (MOM by Sector)
| Sector | IC Mean | ICIR | p-value | Stocks | Signal |
|---|---|---|---|---|---|
| Information Technology | -0.4767 | -1.8804 ⭐ | <0.0001 | 73 | 🔴 Strong reversal |
| Financials | -0.2565 | -1.1815 ⭐ | <0.0001 | 76 | 🔴 Significant reversal |
| Industrials | -0.2118 | -1.3195 ⭐ | <0.0001 | 79 | 🔴 Significant reversal |
| Utilities | -0.0818 | -0.6514 ⭐ | 0.0003 | 31 | Negative significant |
| Consumer Staples | -0.0603 | -0.2753 | 0.0978 | 36 | Weak negative, NS |
| Consumer Discretionary | -0.0325 | -0.1917 | 0.2446 | 48 | Negative, NS |
| Health Care | -0.0344 | -0.1197 | 0.4653 | 59 | No signal |
| Real Estate | +0.1263 | +0.3796 | 0.1360 | 31 | Positive, NS |
Key observations:
- IT momentum IC = -0.477 is the strongest signal this run—nearly all 39 cross-sections negative (only 7.7% positive). Q5 (high momentum/winners) mean return +0.03%, Q1 (low momentum/losers) +14.36%. This is not “tech stocks falling”—it is strong within-sector reversal in technology.
- Financials and Industrials also show significant reversal (IC < -0.2, p < 0.001). | Real Estate is the only sector with positive IC (+0.126), but N=31, p=0.136, not statistically significant.
- Health Care IC = -0.034, p = 0.465—momentor factor entirely ineffective in healthcare, no pattern within-sample.
Implications for Strategy
Momentum factor currently not usable. Full-market MOM IC = -0.186, with IT/Industrials/Financials all deeply negative. Traditional “chase winners” strategies would lose money persistently in this regime. Reversal approaches (sell recent winners, buy recent losers) show stronger within-sample performance, but note:
- Long-short direction is Q1 (low momentum/losers) minus Q5 (high momentum/winners); positive long-short (+5.65%) means losers outperform winners.
- Transaction costs not deducted; actual implementable returns below stated values.
Fundamental factors (EP/FCF Yield/ROE) all negative in this run. This does not directly imply value factor失效—the IC is the mean of 60 historical cross-sections, not a daily IC. Negative values mean that across 60 past cross-section dates, high-factor groups underperformed low-factor groups. Caveats: -本期 EP/FCF Yield/ROE ic_history entries repeated identically since 09-08, meaning the actual as-of date of these numbers may predate 09-08. Do not treat as today’s valid signal.
- SIZE IC = -0.074 across 39 cross-sections, highly significant (p < 0.0001)—small caps outperformed large caps within-sample. This is a cross-sectional correlation, not a “full-market small-cap rally” forecast.
Low-vol anomaly persists. VOL IC = +0.061 significant positive (p = 0.021)—high-vol groups underperform low-vol groups. Classic low-vol anomaly, still effective in this regime. Long-short Q1-Q5 = -2.42%, meaning Q5 (high vol) overall underperforms Q1 (low vol).
Conclusions That Cannot Be Drawn
- ❌ Cannot say “MOM flipped from positive to negative today”—ic_history shows momentum turned negative since late August; today IC = -0.186 is continuation of the existing reversal regime, not a new flip.
- ❌ Cannot say “EP/FCF Yield/ROE reversed today”—all three diffs = 0, cache not updated, no new information.
- ❌ Cannot say “fundamental factors negative = value investing无效”—IC mean is historical cross-section average, not future return; negative only means high-factor groups lagged low-factor groups over the past 60 cross-sections.
- ❌ Cannot say “SIZE negative = small caps will rise”—this is cross-sectional correlation, not a time-series forecast.
- ❌ Sector negative count (7/8 negative) does not equal “7 new sector reversals today”—baseline contains大量 June-July positive-momentum records; z-score alerts mark deviation, not daily breakpoints.
Statistical & Data Limitations
| Limitation | Description |
|---|---|
| Overlapping samples | Fundamental: 60 cross-sections; Price: 39 cross-sections, with 21-day overlapping returns; t-tests not corrected for serial correlation; p-values may be understated |
| ic_history duplicates | Same date written 2-7 times (e.g., 2026-07-09 written 7 times), baseline mean/SD affected; z-score deviation alerts require careful interpretation |
| IC meaning | ic_mean is the mean of historical cross-sectional rank correlations, not a daily IC, not a 21-day forward return, not a downside probability |
| ICIR | IC mean / IC std, not a strategy Sharpe ratio, not linked to actual implementable returns |
| Quantile long-short | Q1-Q5 direction depends on code implementation (Q1 = low factor group, Q5 = high factor group); transaction costs not deducted |
| Sector coverage | 8 GICS sectors; Real Estate and Utilities only 31 stocks each, large estimation noise |
| Cache dates | Price cache as of 2026-09-15; fundamental TTM panel ic_history unchanged since 09-08 |